- Page 1 and 2: Experiments with MATLAB Cleve Moler
- Page 3 and 4: Contents Preface iii 1 Iteration 1
- Page 5 and 6: Experiments with MATLAB R⃝ Copyri
- Page 7 and 8: Preface Figure 1. exmgui provides a
- Page 9 and 10: Preface v Better yet, enter edit ma
- Page 11 and 12: Chapter 1 Iteration Iteration is a
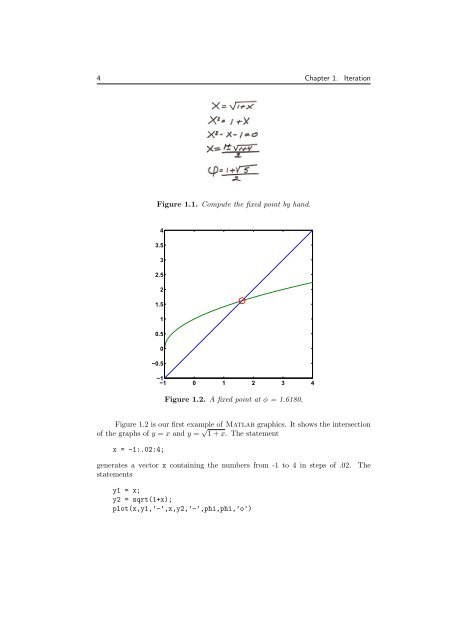
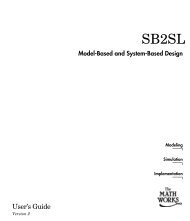
- Page 13: x = 2 x = 1.732050807568877 x = 1.6
- Page 17 and 18: provide brief descriptions of comma
- Page 19 and 20: format compact %% Names and assignm
- Page 21 and 22: Express one barn-megaparsec in teas
- Page 23 and 24: 1.11 cos(x). Find the numerical sol
- Page 25 and 26: 2.5 2 1.5 1 0.5 0 −0.5 −1 −1.
- Page 27 and 28: Chapter 2 Fibonacci Numbers Fibonac
- Page 29 and 30: f = zeros(n,1); f(1) = 1; f(2) = 2;
- Page 31 and 32: The fibnum function is recursive. I
- Page 33 and 34: 2.00000000000000 1.50000000000000 1
- Page 35 and 36: and ends with Recap 2 3 5 8 13 21 3
- Page 37 and 38: Exercises 2.1 Rabbits. Explain what
- Page 39 and 40: Our function fibfun1 is a first att
- Page 41 and 42: There is no array of coefficients.
- Page 43 and 44: Chapter 3 Calendars and Clocks Comp
- Page 45 and 46: and datenum(2011,8,2) datenum(’Au
- Page 47 and 48: period of 23 days, the emotional cy
- Page 49 and 50: xmas = datenum(c(1),12,25) days_til
- Page 51 and 52: 3.9 Your birthday. On which day of
- Page 53 and 54: (b) Make clockex run counter-clockw
- Page 55 and 56: Chapter 4 Matrices Matlab began as
- Page 57 and 58: This implies that points near x are
- Page 59 and 60: 10 8 6 4 2 0 −2 −4 −6 −8 3
- Page 61 and 62: R = 2*rand(2,2) - 1 generates a 2-b
- Page 63 and 64: 0.2588 0.9659 G45 = 0.7071 -0.7071
- Page 65 and 66:
Matrix arithmetic Matrix addition a
- Page 67 and 68:
% This is an executable program tha
- Page 69 and 70:
% and the complex conjugate transpo
- Page 71 and 72:
are mirror images of each other. 10
- Page 73 and 74:
Chapter 5 Linear Equations The most
- Page 75 and 76:
A = [3 12 1; 12 0 2; 0 2 3] Since a
- Page 77 and 78:
so b = 2.36 5.26 2.63 Now we do not
- Page 79 and 80:
Did that solution occur to you? The
- Page 81 and 82:
(c) (d) (e) (f) ⎛ ⎝ ⎛ ⎝ ⎛
- Page 83 and 84:
5.7 Circuit. Figure 5.2 is the circ
- Page 85 and 86:
Chapter 6 Fractal Fern The fractal
- Page 87 and 88:
the point into the lower subfern on
- Page 89 and 90:
stop = uicontrol(’style’,’tog
- Page 91 and 92:
% fern % finitefern %% fern.jpg F =
- Page 93 and 94:
Chapter 7 Google PageRank The world
- Page 95 and 96:
The best way to compute PageRank in
- Page 97 and 98:
alpha beta gamma delta sigma rho Fi
- Page 99 and 100:
We see that alpha has a higher Page
- Page 101 and 102:
0.02 0.018 0.016 0.014 0.012 0.01 0
- Page 103 and 104:
Exercises 7.1 Use surfer and pagera
- Page 105 and 106:
% PAGERANKPOW PageRank by power met
- Page 107 and 108:
Chapter 8 Exponential Function The
- Page 109 and 110:
0.9 0.85 0.8 0.75 0.7 0.65 0.6 0.55
- Page 111 and 112:
The result gives us the numerical v
- Page 113 and 114:
then log e(y) = t The function log
- Page 115 and 116:
17 2292.02 2335.52 2339.65 18 2406.
- Page 117 and 118:
Figure 8.3. Two plots of e iθ . 10
- Page 119 and 120:
= s; n = n + 1; term = (t/n)*term;
- Page 121 and 122:
format compact format long Explain
- Page 123 and 124:
Chapter 9 T Puzzle A classic puzzle
- Page 125 and 126:
Figure 9.4. The arrow and the rhomb
- Page 127 and 128:
z = 3.0000 + 4.0000i r = 5 phi = 0.
- Page 129 and 130:
% % puzzle_recap % edit puzzle_reca
- Page 131 and 132:
9.8 Rotation. Reproduce figure 9.6.
- Page 133 and 134:
Chapter 10 Magic Squares With origi
- Page 135 and 136:
produces sum(diag(flipud(A))) 15 Th
- Page 137 and 138:
.. image(X) colormap(map) axis imag
- Page 139 and 140:
odd, n is odd. singly-even, n is di
- Page 141 and 142:
M = n*A+B+1 131 produces a matrix w
- Page 143 and 144:
Further Reading 133 The reasons why
- Page 145 and 146:
%% Rank figure for n = 3:20 r(n) =
- Page 147 and 148:
gbplot(hot) This is what TV movie c
- Page 149 and 150:
for n = 3:20 r(n) = rank(magic(n));
- Page 151 and 152:
Chapter 11 TicTacToe Magic Three si
- Page 153 and 154:
Figure 11.4. Typical output from a
- Page 155 and 156:
145 Briefly, then, the green moves
- Page 157 and 158:
147 You see that 4 and 5 are on the
- Page 159 and 160:
% function [i,j] = winningmove(X,p)
- Page 161 and 162:
Chapter 12 Game of Life Conway’s
- Page 163 and 164:
Figure 12.3. A glider gliding. Figu
- Page 165 and 166:
generate index vectors that increas
- Page 167 and 168:
Further Reading The Wikipedia artic
- Page 169 and 170:
12.4 Glider collisions. What happen
- Page 171 and 172:
R = P(:,2)./P(:,1); hist(P(:,1),30)
- Page 173 and 174:
Chapter 13 Mandelbrot Set Fractals,
- Page 175 and 176:
Figure 13.3. Two trajectories. z0 =
- Page 177 and 178:
167 Use the up arrow and backspace
- Page 179 and 180:
n = length(x); e = ones(n,1); z0 =
- Page 181 and 182:
grid^2 * depth So the statement cou
- Page 183 and 184:
4.0e-11,1024,2048,2) 173 Taking wid
- Page 185 and 186:
Exercises 13.1 Explore. Use the man
- Page 187 and 188:
Figure 13.8. Region #4. “Valley o
- Page 189 and 190:
Figure 13.12. Region #8. “Nebula
- Page 191 and 192:
Figure 13.16. Region #12. “Geode
- Page 193 and 194:
Chapter 14 Sudoku Humans look for p
- Page 195 and 196:
8 3 4 1 5 9 6 7 2 8 3 4 1 5 9 6 7 2
- Page 197 and 198:
1 1 3 2 3 4 Figure 14.8. diag(1:4)
- Page 199 and 200:
189 A number of operations on a Sud
- Page 201 and 202:
191 The following statement creates
- Page 203 and 204:
%% Disclaimer % Our Sudoku chapter
- Page 205 and 206:
14.6 Try this. Try to use sudoku_as
- Page 207 and 208:
H C D A A E I B F G B C A H C D A E
- Page 209 and 210:
Chapter 15 Ordinary Differential Eq
- Page 211 and 212:
Figure 15.2. Spacewar, the world’
- Page 213 and 214:
203 two different values of the tim
- Page 215 and 216:
1 0.8 0.6 0.4 0.2 0 −0.2 −0.4
- Page 217 and 218:
will also produce figure 15.5. Use
- Page 219 and 220:
plot(y(:,1),y(:,2),’-o’) axis s
- Page 221 and 222:
15.5 Linear system Write the system
- Page 223 and 224:
Chapter 16 Predator-Prey Model Mode
- Page 225 and 226:
y = mu*eta*exp(k*t)./(eta*exp(k*t)
- Page 227 and 228:
217 There are two tricky parts of t
- Page 229 and 230:
eta = 1 mu = 20 ydot = @(t,y) k*(1-
- Page 231 and 232:
Chapter 17 Orbits Dynamics of many-
- Page 233 and 234:
Figure 17.1. Initial, and final, po
- Page 235 and 236:
plot(x,y,’.-’) s = 2*sqrt(m); a
- Page 237 and 238:
227 interface controls. In particul
- Page 239 and 240:
1.5 1 0.5 0 −0.5 −1 −1.5 −1
- Page 241 and 242:
1 0 −1 −1 0 1 1 0 −1 −1 0 1
- Page 243 and 244:
0.3836 -0.4836 233 The three masses
- Page 245 and 246:
0.3 0.2 0.1 0 −0.1 −0.2 −0.3
- Page 247 and 248:
%% Snapshot of three dimensional Br
- Page 249 and 250:
Exercises 239 17.1 Bouncing ball. (
- Page 251 and 252:
Chapter 18 Shallow Water Equations
- Page 253 and 254:
243 represents a three component ve
- Page 255 and 256:
%% Create a two dimensional grid. m
- Page 257 and 258:
Chapter 19 Morse Code Morse code de
- Page 259 and 260:
produces a cell array that contains
- Page 261 and 262:
And finally one assignment statemen
- Page 263 and 264:
. . E T I A N M S U R W . . Figure
- Page 265 and 266:
255 Encoding is a little more work
- Page 267 and 268:
257 A computer byte is 8 bits and s
- Page 269 and 270:
% publish morse_recap % % Related E
- Page 271 and 272:
19.3 dash. Why didn’t I use an un
- Page 273 and 274:
Chapter 20 Music What does 12√ 2
- Page 275 and 276:
ange is -12:12. The statement piano
- Page 277 and 278:
Figure 20.4. x = sin t, y = sin 3/2
- Page 279 and 280:
269 a and b by entering values in e
- Page 281 and 282:
5 1.334840 4/3 1.333333 0.0011 6 1.
- Page 283 and 284:
Figure 20.10. C major fifth with eq
- Page 285 and 286:
http://en.wikipedia.org/wiki/Music_
- Page 287 and 288:
tfinal = 12*pi; t = 0:pi/512:tfinal