Rheoencephalography (REG) as a Non-Invasive Monitoring ...
Rheoencephalography (REG) as a Non-Invasive Monitoring ...
Rheoencephalography (REG) as a Non-Invasive Monitoring ...

Create successful ePaper yourself
Turn your PDF publications into a flip-book with our unique Google optimized e-Paper software.
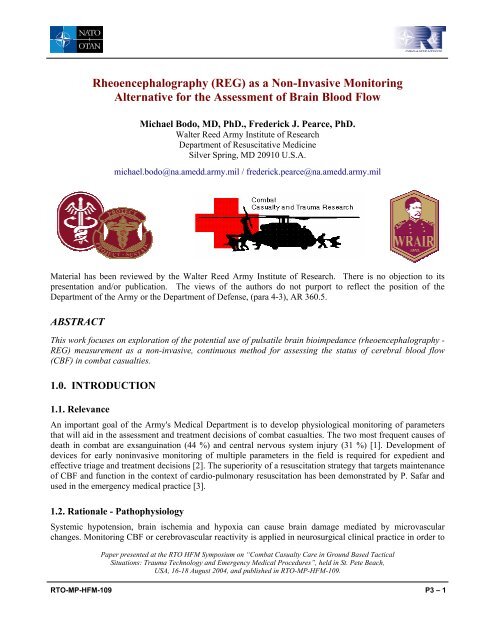
<strong>Rheoencephalography</strong> (<strong>REG</strong>) <strong>as</strong> a <strong>Non</strong>-Inv<strong>as</strong>ive <strong>Monitoring</strong><br />
Alternative for the Assessment of Brain Blood Flow<br />
Michael Bodo, MD, PhD., Frederick J. Pearce, PhD.<br />
Walter Reed Army Institute of Research<br />
Department of Resuscitative Medicine<br />
Silver Spring, MD 20910 U.S.A.<br />
michael.bodo@na.amedd.army.mil / frederick.pearce@na.amedd.army.mil<br />
Material h<strong>as</strong> been reviewed by the Walter Reed Army Institute of Research. There is no objection to its<br />
presentation and/or publication. The views of the authors do not purport to reflect the position of the<br />
Department of the Army or the Department of Defense, (para 4-3), AR 360.5.<br />
ABSTRACT<br />
This work focuses on exploration of the potential use of pulsatile brain bioimpedance (rheoencephalography -<br />
<strong>REG</strong>) me<strong>as</strong>urement <strong>as</strong> a non-inv<strong>as</strong>ive, continuous method for <strong>as</strong>sessing the status of cerebral blood flow<br />
(CBF) in combat c<strong>as</strong>ualties.<br />
1.0. INTRODUCTION<br />
1.1. Relevance<br />
An important goal of the Army's Medical Department is to develop physiological monitoring of parameters<br />
that will aid in the <strong>as</strong>sessment and treatment decisions of combat c<strong>as</strong>ualties. The two most frequent causes of<br />
death in combat are exsanguination (44 %) and central nervous system injury (31 %) [1]. Development of<br />
devices for early noninv<strong>as</strong>ive monitoring of multiple parameters in the field is required for expedient and<br />
effective triage and treatment decisions [2]. The superiority of a resuscitation strategy that targets maintenance<br />
of CBF and function in the context of cardio-pulmonary resuscitation h<strong>as</strong> been demonstrated by P. Safar and<br />
used in the emergency medical practice [3].<br />
1.2. Rationale - Pathophysiology<br />
Systemic hypotension, brain ischemia and hypoxia can cause brain damage mediated by microv<strong>as</strong>cular<br />
changes. <strong>Monitoring</strong> CBF or cerebrov<strong>as</strong>cular reactivity is applied in neurosurgical clinical practice in order to<br />
Paper presented at the RTO HFM Symposium on “Combat C<strong>as</strong>ualty Care in Ground B<strong>as</strong>ed Tactical<br />
Situations: Trauma Technology and Emergency Medical Procedures”, held in St. Pete Beach,<br />
USA, 16-18 August 2004, and published in RTO-MP-HFM-109.<br />
RTO-MP-HFM-109 P3 – 1
<strong>Rheoencephalography</strong> (<strong>REG</strong>) <strong>as</strong> a <strong>Non</strong>-Inv<strong>as</strong>ive<br />
<strong>Monitoring</strong> Alternative for the Assessment of Brain Blood Flow<br />
evaluate the status of the patient after brain injury or operation. The concept of CBF thresholds of ischemia<br />
w<strong>as</strong> introduced in the seventies when it w<strong>as</strong> observed that a more dense zone of ischemia exists within the<br />
central core of the ischemic zone, but in the peripheral zones, where electrical silence may pertain, there is a<br />
zone of intact ionic homeost<strong>as</strong>is, which h<strong>as</strong> been termed the “ischemic penumbra”. The flow threshold for<br />
maintenance of electrical activity in the cortex is 15-20 ml/100g/min [4,5] and an ultimate goal for<br />
resuscitation from hemorrhagic hypotension is to maintain the CBF above this level.<br />
1.3. Broader View<br />
The application of <strong>REG</strong> for potential military applications began at the Walter Reed Army Institute of<br />
Research over 40 years ago [6,7]. Authors found characteristic changes in the <strong>REG</strong> wave with incre<strong>as</strong>ed<br />
intracranial pressure in humans and in animals, furthermore complained about the manual control of <strong>REG</strong><br />
amplifier. Since that time advances in the development of microprocessors and signal processing techniques<br />
h<strong>as</strong> presented the possibility to reconsider the fe<strong>as</strong>ibility of implementing a portable or even wearable version<br />
of the rheoencepahalography monitoring technique to evaluate the adequacy of brain blood flow [8]. Our goal<br />
is to develop a non-inv<strong>as</strong>ive approach to monitoring brain blood flow that would serve <strong>as</strong> an important<br />
component of <strong>as</strong>sessing the severity of injury and <strong>as</strong> an end-point for resuscitation. Use of <strong>REG</strong> <strong>as</strong> a wearable<br />
monitoring system would allow life-saving <strong>as</strong>sessment and treatment during the first critical minutes after<br />
injury during the transport of a wounded soldier.<br />
1.4. This Study<br />
In the animal studies reported here, we monitored and compared global CBF using <strong>REG</strong>, local CBF by l<strong>as</strong>er<br />
Doppler flow, and carotid flow by Doppler ultr<strong>as</strong>ound during physiological stimuli known to produce<br />
predictable changes in CBF.<br />
2.0. METHODS<br />
Research w<strong>as</strong> conducted in compliance with the Animal Welfare Act and other federal statutes and regulations<br />
relating to animals and experiments involving animals and adheres to principles stated in the Guide for the<br />
Care and Use of Laboratory Animals, NRC Publication, 1996 edition.<br />
2.1. Rats (Group 1)<br />
In this group two studies were undertaken in anesthetized rats to study the changes CBF using two standard<br />
perturbations: 1) CO2 and O2 inhalation and 2) electrical stimulation of the brain.<br />
Brain electrical impedance w<strong>as</strong> recorded in 8 male Wistar rats anesthetized with pentobarbital and<br />
ventilated with 30% O2 (balance N2). Stainless steel needle electrodes were implanted into the brain and fixed<br />
with dental cement. These <strong>REG</strong> recordings were made by monitoring impedance shifts with bipolar<br />
(intrahemispherial) or tetrapolar (interhemispherial) techniques with an excitation frequency of 50 kHz<br />
(Model 2991 and 2994, UFI, Inc. Morro Bay, CA). CBF levels were altered by changing the inspired g<strong>as</strong><br />
mixture for one minute (one mixture for one minute; 100% O2, 5% CO2, and 20% CO2) or by applying<br />
electrical pulses (20 Hz, 0.5 msec pulse duration, 2 sec pulse trains with intensity varied to produce an effect,<br />
i.e. max 15 sec, ramped up by 10 V for each trial until CBF incre<strong>as</strong>ed, max 60 V, and 3 trials) directly to the<br />
exposed cerebral surface of one hemisphere. The stimulating electrodes were covered with dental cement,<br />
also. <strong>REG</strong> me<strong>as</strong>urements and DC impedance (Ro) were recorded simultaneously on a portable IBM<br />
compatible computer using CODAS (DATAQ, Inc., Akron, OH) data acquisition system. Data collection for<br />
P3 - 2 RTO-MP-HFM-109
<strong>Rheoencephalography</strong> (<strong>REG</strong>) <strong>as</strong> a <strong>Non</strong>-Inv<strong>as</strong>ive<br />
<strong>Monitoring</strong> Alternative for the Assessment of Brain Blood Flow<br />
analysis l<strong>as</strong>ted 4 min, covering a b<strong>as</strong>eline, g<strong>as</strong> administration or electrical stimulation and recovery. Each of<br />
the recorded signals w<strong>as</strong> digitized at a rate of 250 Hz using a 12-bit A/D conversion board. The signals were<br />
processed by Rheosys software. Data were quantified using the recorded pulsatile and b<strong>as</strong>al resistance values,<br />
<strong>as</strong> described earlier [9].<br />
2.2. Rats (Group 2)<br />
In this study in anesthetized rats, various CO2 concentrations were used to study CBF reactivity.<br />
<strong>REG</strong> signals were recorded in female Wistar rats anesthetized with pentobarbital (N = 5, 13<br />
me<strong>as</strong>urements; some rats were used more than once). Stainless steel needle electrodes were implanted into the<br />
brain and fixed with dental cement. These me<strong>as</strong>urements were made prior to, during and after 2-min<br />
substitutions of varying fractions of CO2 (4%, 6%, 8% or 10%) for N2 in the inspired g<strong>as</strong> mixture. The <strong>REG</strong><br />
me<strong>as</strong>urements were made using a rheograph (ReoRon-61; Mikromed, Esztergom, Hungary). The me<strong>as</strong>uring<br />
frequency w<strong>as</strong>: 160 kHz, sensitivity: 0.03 ohm. The <strong>REG</strong> and electrocardiogram signals were connected to<br />
the analog memory recorder (MCAM-4, Rolitron, Budapest, Hungary). The data processing of the abovementioned<br />
modalities w<strong>as</strong> signal averaging (n = 40 pulses in about 10 sec), triggered by the R-peak of the<br />
EKG. The b<strong>as</strong>is of comparison w<strong>as</strong> the change of amplitude, integral and <strong>as</strong>cending portion of the <strong>REG</strong> curve<br />
during different concentrations of CO2 inhalation compared to b<strong>as</strong>eline.<br />
2.3. Rat (Group 3)<br />
In this group three correlative studies were undertaken on anesthetized rats to study CBF responses to the<br />
following perturbations: 1) CO2 inhalation, 2) carotid clamping, and 3) hemorrhage to 40 mmHg.<br />
Sprague-Dawley rats (250-350 g) were anesthetized with sodium pentobarbital IP (50 mg/kg), heparin zed<br />
(50 IU/100g, IV), a tracheostomy performed and body temperature maintained with a closed loop heating padrectal<br />
thermometer system (Homeostatic Blanket Control Unit, Harvard Apparatus, Edenbridge, KT). One<br />
femoral artery w<strong>as</strong> used for heart rate and blood pressure, and the other w<strong>as</strong> attached to a peristaltic pump for<br />
hemorrhaging the animal. The controlled hemorrhage model w<strong>as</strong> a modified Wiggers isobaric shock model in<br />
which the animal’s mean arterial blood pressure is reduced at a precise rate, under computer control, to a<br />
target mean arterial pressure of 40 mmHg, and then held there until experimental intervention, resuscitation,<br />
decompensation or death occurred. The experiment w<strong>as</strong> performed using a computer-b<strong>as</strong>ed data acquisition<br />
system, running a program written in LabView (National Instruments, Houston, TX). <strong>REG</strong> w<strong>as</strong> me<strong>as</strong>ured with<br />
intracranial electrodes (Pl<strong>as</strong>tics One, Roanoke, VA) with 5 mm uninsulated surface in intrahemispherial<br />
derivation (left or right side) (see Fig. 1). The composition of the CO2 inhaled g<strong>as</strong> used for the challenge w<strong>as</strong><br />
10 % CO2 (Calibrating G<strong>as</strong>, Nova Biomedical, Waltham, MA; 10% CO2, 0% oxygen, 90% N2) for 1 s. The<br />
total number of rats me<strong>as</strong>ured by <strong>REG</strong> during CO2 inhalation w<strong>as</strong> n=11, in 63 trials. Here we present results<br />
of two subgroups (A: n = 4, trials = 32, B: n=5, 17 trials). Occlusion of the common carotid arteries w<strong>as</strong><br />
accomplished using aneurism clips or carotid ligatures, while the rat w<strong>as</strong> in the supine position (n=5, 13<br />
trials). Readings from the Doppler flow probes verified the lack of blood flow through the carotid arteries,<br />
Fig. 2. During hemorrhage mean blood pressure w<strong>as</strong> 40 mmHg. Me<strong>as</strong>urement of CBF w<strong>as</strong> taken with <strong>REG</strong><br />
(n=14), l<strong>as</strong>er Doppler flowmetry (Integrating probe, Periflux System 4001, Perimed Sweden), (LDF; n=4),<br />
and carotid flow by Doppler ultr<strong>as</strong>ound (T201 Ultr<strong>as</strong>onic Bloodflow Meter, Transonic Systems, Ithaca, NY),<br />
(n=11).<br />
RTO-MP-HFM-109 P3 - 3
<strong>Rheoencephalography</strong> (<strong>REG</strong>) <strong>as</strong> a <strong>Non</strong>-Inv<strong>as</strong>ive<br />
<strong>Monitoring</strong> Alternative for the Assessment of Brain Blood Flow<br />
2.4. Pig<br />
Figure 1. Rat skull with electrode and probe localization.<br />
Figure 2. Schematics of CBF, global (<strong>REG</strong>), local (LDF) and carotid flow me<strong>as</strong>urement.<br />
A 22 kg pig w<strong>as</strong> anesthetized with ketamine and acepromazine (iv). The pig w<strong>as</strong> instrumented with a LDF<br />
probe over the parietal cortex (19 mm AP, 10 mm Lat.). The probe w<strong>as</strong> inserted through a hollow cranial bolt,<br />
and contacted bone w<strong>as</strong> thinned to translucency. The local CBF w<strong>as</strong> me<strong>as</strong>ured by a LDF monitor<br />
P3 - 4 RTO-MP-HFM-109
(V<strong>as</strong>aMedics, St. Paul, MN) with 3 second averaging. Arterial blood pressure (BP) w<strong>as</strong> also me<strong>as</strong>ured via<br />
catheterization of the femoral artery. BP w<strong>as</strong> me<strong>as</strong>ured using a pressure transducer connected to a pressure<br />
amplifier ((23XL, Gould Instrument Systems, Valley View, OH). B<strong>as</strong>eline mean BP w<strong>as</strong> 62 mmHg; this value<br />
w<strong>as</strong> considered <strong>as</strong> 100 percent. The <strong>REG</strong> w<strong>as</strong> me<strong>as</strong>ured by placing 9 mm diameter stainless steel disc<br />
electrodes on the skull over the parietal cortex. The probes were held in place by 0-80 x 3/16” stainless steel<br />
screws. A conductive gel w<strong>as</strong> used to decre<strong>as</strong>e resistance between the electrode and the skull. To investigate<br />
autoregulation of CBF with varying SAP a series of temporary (5 min) aortic occlusions (n = 4) were<br />
performed proximal to the kidneys. SAP, LD and <strong>REG</strong> were continuously collected before, during, and after<br />
each occlusion.<br />
2.5. Challenges<br />
CBF w<strong>as</strong> altered with the following manipulations: CO2 inhalation [10,11], brain electrical stimulation [12],<br />
ligature of the common carotid arteries [13,14], and hemorrhage in rats, furthermore aorta compression [15] in<br />
swine.<br />
2.6. Data Acquisition<br />
Unless noted otherwise, the <strong>REG</strong> amplifier w<strong>as</strong> operated with 46 kHz (KR-Rheo Preamp, Galileo, Italy). An<br />
IBM compatible PC performed the data collection with a PC-LPM-16 (National Instruments, Austin, TX), or<br />
PCL-718 AD card (Advantech, CA). The A/D sampling rate w<strong>as</strong> 100-500 Hz. For analog physiological data<br />
acquisition, proprietary software (Analyz, Chart, Extract, Gral [16], Redirec [17], DataLyser) w<strong>as</strong> used on a<br />
PC and the data processed off line. The <strong>REG</strong>, LDF and carotid flow calculation and comparison w<strong>as</strong> analyzed<br />
quantitatively, b<strong>as</strong>ed on amplitude (minimum - maximum distance of a <strong>REG</strong> pulse) and integral (area under<br />
the pulse curve) me<strong>as</strong>urement of 5 to 10-sec time-windows. Since neither LDF nor <strong>REG</strong> is an absolute flow<br />
me<strong>as</strong>urement, a control segment of recording w<strong>as</strong> chosen from the pretreatment period (b<strong>as</strong>eline), and the<br />
changes were expressed <strong>as</strong> a percentage of b<strong>as</strong>eline. In order to decre<strong>as</strong>e the respiratory interference with<br />
<strong>REG</strong>, the data w<strong>as</strong> digitally filtered (Butterworth band p<strong>as</strong>s, 0.3-60 Hz, 512 point, 60 dB; with a software<br />
module integrated into the DataLyser software (Baranyi, WRAIR).<br />
2.6.1. Statistical Analysis<br />
Student t-test, Pearson’s linear correlation, and Spearman’s rank correlation were utilized within the Minitab<br />
software for data analysis. Pearson's correlation coefficient indicates the strength of a linear relationship, and<br />
Spearman's rank correlation indicates the strength of a monotonic relationship. The P-values indicate how<br />
likely it is that the coefficients are equal to zero (i.e. the null hypothesis tested is that each coefficient is equal<br />
to zero). P < 0.05 w<strong>as</strong> considered significant.<br />
3. 0. RESULTS<br />
3.1. Rat/1<br />
3.1.1. Brain Electrostimulation<br />
<strong>Rheoencephalography</strong> (<strong>REG</strong>) <strong>as</strong> a <strong>Non</strong>-Inv<strong>as</strong>ive<br />
<strong>Monitoring</strong> Alternative for the Assessment of Brain Blood Flow<br />
Electrical stimulation caused a <strong>REG</strong> amplitude incre<strong>as</strong>e in the ipsilateral (but not the contralateral) hemisphere<br />
Fig. 3.<br />
RTO-MP-HFM-109 P3 - 5
<strong>Rheoencephalography</strong> (<strong>REG</strong>) <strong>as</strong> a <strong>Non</strong>-Inv<strong>as</strong>ive<br />
<strong>Monitoring</strong> Alternative for the Assessment of Brain Blood Flow<br />
<strong>REG</strong> Amplitude (%)<br />
600<br />
500<br />
400<br />
300<br />
200<br />
100 LR<br />
R<br />
0 L<br />
0 50 100 150 200 250<br />
Time (s)<br />
Figure 3. Typical maximal <strong>REG</strong> amplitude responses to electrical stimulation of the right hemisphere.<br />
Stimulation produced a marked incre<strong>as</strong>e in <strong>REG</strong> pulse amplitude of the stimulated hemisphere and a possible<br />
decre<strong>as</strong>e in pulse amplitude of the non-stimulated left hemisphere. These responses would not likely be detected by<br />
monitoring the total CBF. The time of the stimulation is indicated by downward arrow. Y-axis units are in<br />
percentage of b<strong>as</strong>eline. Legend: left (oL), right (-R), and combined left and right (∇LR); mean of 3 runs on one rat<br />
([18] with permission).<br />
3.1.2. CO2 Inhalation<br />
When 5% CO2 w<strong>as</strong> substituted for the equivalent fraction of N2 in the inspired g<strong>as</strong> mixture, there were no<br />
significant changes in the <strong>REG</strong> amplitude, indicating that this treatment w<strong>as</strong> without effect on CBF. The<br />
substitution of 20% CO2 for the equivalent fraction of N2, however, markedly incre<strong>as</strong>ed the <strong>REG</strong> signal<br />
amplitude, indicating incre<strong>as</strong>ed CBF, Fig. 4.<br />
<strong>REG</strong> Amplitude (%)<br />
160<br />
140<br />
120<br />
100<br />
80 20 % CO2<br />
5 % CO2<br />
60 100 % O2<br />
0 50 100 150 200 250<br />
Time (s)<br />
Figure 4. <strong>REG</strong> amplitude prior to, during, and following 2 min of 100% O2, 5% CO2, and 20% CO2<br />
inhalation. The time of the start and stop of the g<strong>as</strong> administration is indicated by downward and upward arrows,<br />
respectively. Inspiration of 100% oxygen (o) produced a slight decre<strong>as</strong>e in <strong>REG</strong> amplitude. Inspiration of 5% CO2<br />
(-) with 30% O2 did not affect <strong>REG</strong> amplitude. Breathing 20% CO2 (�) with 30% O2 produced a 50% incre<strong>as</strong>e in<br />
<strong>REG</strong> amplitude. Y-axis units are in percentage of b<strong>as</strong>eline ([18] with permission).<br />
P3 - 6 RTO-MP-HFM-109
3.2. Rat/2<br />
During CO2 inhalation a linear relationship w<strong>as</strong> established between CO2 concentration and <strong>REG</strong> peak<br />
amplitude (correlation coefficient: 0.88, p = 0.05), and the raise time (anacrotic portion) of the curve (0.88, p<br />
= 0.05), Fig. 5.<br />
Figure 5. Incre<strong>as</strong>e of <strong>REG</strong> amplitude (upper) and integral (lower) during inhalation of various CO2<br />
concentrations. Y-axis values are percentage of b<strong>as</strong>eline. Data are mean + SD. Statistical significance<br />
(compared to b<strong>as</strong>eline) is expressed <strong>as</strong>: * = p
<strong>Rheoencephalography</strong> (<strong>REG</strong>) <strong>as</strong> a <strong>Non</strong>-Inv<strong>as</strong>ive<br />
<strong>Monitoring</strong> Alternative for the Assessment of Brain Blood Flow<br />
<strong>REG</strong><br />
Filtered<br />
<strong>REG</strong><br />
Carotis L<br />
Carotis R<br />
SAP<br />
CO2<br />
60 seconds<br />
Figure 6. <strong>REG</strong> pulse amplitude incre<strong>as</strong>es during CO2 inhalation (subgroup A). Filtered <strong>REG</strong>:<br />
rheoencephalograph after removal of the respiratory subharmonic, Carotid L and R: left and right carotid<br />
arterial flow, SAP: systemic arterial pressure, CO2: exhaled carbon dioxide and at the arrow: 10 % inhaled<br />
CO2 during 1 s. Time window: 60 s. The rat/file ID w<strong>as</strong>: 157 – 3.<br />
Table 1. <strong>REG</strong> integral incre<strong>as</strong>e during CO2 inhalation (subgroup B).<br />
Rat ID BL MAX Incre<strong>as</strong>e<br />
%<br />
158-1 0.071 0.196 176.06<br />
158-2 0.097 0.278 186.60<br />
158-3 0.109 0.341 212.84<br />
158-4 0.1 0.324 224.00<br />
157-1 0.079 0.586 641.77<br />
157-2 0.133 0.454 241.35<br />
157-3 0.141 0.508 260.28<br />
157-4 0.112 0.383 241.96<br />
7-2-1 0.061 0.221 262.30<br />
7-2-2 0.012 0.031 158.33<br />
7-2-3 0.639 2.491 289.83<br />
8-1-1 0.04 0.066 65.00<br />
8-6-1 0.101 1.562 1446.53<br />
8-6-2 0.191 2.311 1109.95<br />
8-6-3 0.01 0.072 620.00<br />
8-6-4 0.01 0.063 530.00<br />
8-6-5 0.011 0.059 436.36<br />
P3 - 8 RTO-MP-HFM-109
<strong>Rheoencephalography</strong> (<strong>REG</strong>) <strong>as</strong> a <strong>Non</strong>-Inv<strong>as</strong>ive<br />
<strong>Monitoring</strong> Alternative for the Assessment of Brain Blood Flow<br />
Rat ID: identification of a rat/trial; BL: value of 5-second b<strong>as</strong>eline <strong>REG</strong> integral; MAX: value of 5-sec<br />
integral during maximal <strong>REG</strong> amplitude; Incre<strong>as</strong>e: value expressed <strong>as</strong> percentage of BL. The group average<br />
incre<strong>as</strong>e w<strong>as</strong> 417.83 ± 366.74. Total number of rats w<strong>as</strong> 5; total number of trials w<strong>as</strong> 17. The incre<strong>as</strong>e w<strong>as</strong><br />
expressed <strong>as</strong> percentage of BL; it w<strong>as</strong> significant (p = 0.0048). The Pearson correlation coefficient w<strong>as</strong> 0.79,<br />
and the Spearman correlation coefficient w<strong>as</strong> 0.88. The p-value <strong>as</strong>sociated with each correlation w<strong>as</strong> less than<br />
0.0001.<br />
Rat ID Number of time<br />
points<br />
Pearson's (r) Spearman's (r)<br />
7/11/02 29 0.63 0.73<br />
7/18/02 29 0.80 0.74<br />
7/23/02 35 0.71 0.66<br />
7/25/02 24 0.63 0.81<br />
Total 117 2.77 2.94<br />
Mean 29.25 0.69 0.74<br />
SD 4.50 0.08 0.06<br />
Table 2. Statistical summary of the CO2 inhalation results in <strong>REG</strong>/LDF group. The 10 sec time window<br />
of the analyzed sample w<strong>as</strong> characterized by 3 or 4 values. Pearson's (r) for all 117 time points = 0.80,<br />
Spearman's (r) for all 117 time points = 0.73. All correlations are statistically different from zero with a pvalue<br />
less than 0.01. Rat ID: identification of a rat.<br />
3.3.2. Carotid Clamping<br />
Figures 7 and 8 show the effect of carotid artery clamping on <strong>REG</strong> amplitude and integral. During carotid<br />
artery clamping, the decre<strong>as</strong>e in <strong>REG</strong> amplitude and integral were both highly significant (P < 0.0001).<br />
ECG<br />
Filtered<br />
<strong>REG</strong><br />
Carotid<br />
Flow<br />
Right<br />
Carotid<br />
Flow<br />
Left<br />
SAP<br />
Figure 7. Effect of clamping of common carotid arteries. Following the first clip placement on the left<br />
carotid artery, the rheoencephalogram (<strong>REG</strong>) amplitude (Filtered <strong>REG</strong>) decre<strong>as</strong>ed; the placement of the<br />
second clip right carotid artery had no further decre<strong>as</strong>e. During the clamping period there w<strong>as</strong> no pulse<br />
amplitude observed in either carotid trace. For better visibility the recording traces were blown up; the real<br />
flow calibration values appear on the right side. Amplification of left and right carotid flow differed. A few<br />
RTO-MP-HFM-109 P3 - 9<br />
1 mV<br />
10 mL/min<br />
2.5 mL/min<br />
100 mmHg
<strong>Rheoencephalography</strong> (<strong>REG</strong>) <strong>as</strong> a <strong>Non</strong>-Inv<strong>as</strong>ive<br />
<strong>Monitoring</strong> Alternative for the Assessment of Brain Blood Flow<br />
minutes after removal of one clip from the right carotid artery, <strong>REG</strong> amplitude moderately incre<strong>as</strong>ed, and after<br />
removal of the second clip from the left carotid artery, the <strong>REG</strong> amplitude returned to slightly above the<br />
b<strong>as</strong>eline level. Similarly, both carotids showed a slight hyperemic reaction. The b<strong>as</strong>eline systemic arterial<br />
pressure (SAP) value w<strong>as</strong> 135/80 mm Hg; during clamping, the minimal value w<strong>as</strong> 80/40 mm Hg. <strong>REG</strong> w<strong>as</strong><br />
an intrahemispherial (left side) derivation. The time window w<strong>as</strong> 10 min; <strong>REG</strong> Filter w<strong>as</strong> 3-100 Hz. ECG:<br />
Electrocardiogram. The rat/file ID w<strong>as</strong> 5-23-02/11.<br />
Figure 8. <strong>REG</strong> integral before and during carotid clamping. Data are expressed <strong>as</strong> a percentage of<br />
b<strong>as</strong>eline. Mean decre<strong>as</strong>e: 27.53 %, SEM: 0.05, SD: 0.1804.<br />
3.3.3. Hemorrhage<br />
During hemorrhage, <strong>REG</strong> transiently incre<strong>as</strong>ed (147% ± 44; p=0.037), while cortical flow (me<strong>as</strong>ured by l<strong>as</strong>er<br />
Doppler) (78 % ± 45; p=0.046) and carotid flow (52 ± 7.5; p=0.005) decre<strong>as</strong>ed and correlated with systemic<br />
arterial pressure, Fig. 9.<br />
EEG<br />
Filtered <strong>REG</strong><br />
Carotid Flow<br />
SAP<br />
CO2<br />
Area Under <strong>REG</strong> Pulse Wave<br />
(10 sec)<br />
0.100<br />
0.075<br />
0.050<br />
0.025<br />
0.000<br />
P
<strong>Rheoencephalography</strong> (<strong>REG</strong>) <strong>as</strong> a <strong>Non</strong>-Inv<strong>as</strong>ive<br />
<strong>Monitoring</strong> Alternative for the Assessment of Brain Blood Flow<br />
Arrows indicate start and end of SAP decre<strong>as</strong>e to 40 mmHg. Carotid flow decre<strong>as</strong>ed similarly to SAP without<br />
showing any sign of CBF autoregulation. <strong>REG</strong> amplitude transiently incre<strong>as</strong>ed than decre<strong>as</strong>ed, demonstrating<br />
CBF autoregulation and indicating its lower limit before 40 mmHg SAP. The EEG amplitude decre<strong>as</strong>e<br />
coincides with the disruption in brain activity coincident with the diminished CBF status. EEG:<br />
electroencephalogram, Filtered <strong>REG</strong>: left side, after removal of respiratory subharmonic, Carotid Flow: left<br />
side, SAP: systemic arterial pressure, CO2: exhaled carbon dioxide. Time window: 24 m. The rat/file ID w<strong>as</strong>:<br />
174 –CO3.<br />
3.4.Pig<br />
During aortic occlusion (caused by abdominal compression) the systemic arterial blood pressure incre<strong>as</strong>ed<br />
59.67 + 11.92 percent (mean + SD; p = 0.008), LDF incre<strong>as</strong>e w<strong>as</strong> non-significant 10.75 + 2.21 % (mean +<br />
SD; p = 0.089), and <strong>REG</strong> decre<strong>as</strong>ed 23.75 + 8.18 % (mean + SD; p = 0.01), Fig. 10.<br />
Figure 10. A typical effect of the compression of abdominal aorta in a pig. During the 5-min compression<br />
(start and end indicated by arrows), mean arterial blood pressure (MABP) incre<strong>as</strong>ed; local CBF me<strong>as</strong>ured by<br />
LDF (LD CBF) incre<strong>as</strong>ed; and global CBF me<strong>as</strong>ured by <strong>REG</strong> amplitude (<strong>REG</strong>), decre<strong>as</strong>ed. This global CBF<br />
decre<strong>as</strong>e is the demonstration of CBF autoregulation. MABP Y-axis is mmHg, LD CBF; <strong>REG</strong> values are<br />
expressed <strong>as</strong> a percentage of the b<strong>as</strong>eline (% C) ([18] with permission).<br />
4.0. DISCUSSION<br />
4.1. Challenges<br />
MABP (mmHg)<br />
LD CBF (%C)<br />
<strong>REG</strong> AMP (%C)<br />
140<br />
120<br />
100<br />
80<br />
60<br />
40<br />
Aortic Occlusion 3<br />
50 55 60 65 70<br />
Time (min)<br />
CBF w<strong>as</strong> altered with stimuli known to cause incre<strong>as</strong>es in CBF: CO2 inhalation and brain electrical<br />
stimulation. Clamping of the common carotid arteries decre<strong>as</strong>es CBF. The CBF autoregulation w<strong>as</strong><br />
additionally tested by hemorrhage causing blood pressure decre<strong>as</strong>e, resulting brain v<strong>as</strong>odilatation, and aorta<br />
compression causing blood pressure incre<strong>as</strong>e resulting brain v<strong>as</strong>oconstriction. For details see 4.2.1.<br />
RTO-MP-HFM-109 P3 - 11<br />
MABP<br />
LD CBF<br />
<strong>REG</strong>
<strong>Rheoencephalography</strong> (<strong>REG</strong>) <strong>as</strong> a <strong>Non</strong>-Inv<strong>as</strong>ive<br />
<strong>Monitoring</strong> Alternative for the Assessment of Brain Blood Flow<br />
4.2. CBF<br />
The brain h<strong>as</strong> ongoing, substantial energy requirements but minimal stores of energy-generating substrates. As<br />
a result, it is completely dependent on a continuous, uninterrupted supply of substrate (oxygen, glucose).<br />
Although the demand by the brain for energy-generating substrates is substantial (the central nervous system<br />
consumes 20% of the oxygen or 170 mmol/l00 g per min or 3-5 ml O2/100 g brain tissue per mm or,<br />
approximately, 40-70 ml O2/min) and 25% of the glucose (31 mmol/l00 g per mm) utilized by the resting<br />
individual under physiological conditions, this is met more than adequately by the 15% of the resting cardiac<br />
output (750 ml/mm) which perfuses the brain (mean global CBF) = 50 ml/l00 g brain tissue per mm (range<br />
45-55 ml/l00 g per mm) approximately 80% to grey matter and 20% to white matter). Indeed, normally, the<br />
supply of oxygen (approximately 150 ml O2/min) is considerably in excess of requirements (around 40-70 ml<br />
O2/min) such that the brain extracts only 25-30% of that supplied. In addition, the brain can conserve energy<br />
and, hence, decre<strong>as</strong>e demand by switching off many of its metabolic processes before its reserves have been<br />
compromised when the delivery of substrate reaches 'critical' values. However, the flip side of this argument is<br />
that, paradoxically, the brain cannot tolerate significant incre<strong>as</strong>es in the volume of the contents of the rigid<br />
container in which it is enclosed. Moreover, because the brain’s own store of energy-generating substances<br />
(glycogen, glucose, oxygen) is small (so small that, at normal rates of adenosine triphosphate production, the<br />
stores of glycogen in the brain would be exhausted in less than 3 min) it is uniquely dependent on a<br />
continuing, and adequate, supply of substrate [19].<br />
4.2.1. CBF Autoregulation<br />
Autoregulation in the cerebral circulation may be defined more pragmatically <strong>as</strong> the mechanism that protects<br />
the brain against the dangers of hypoxia at low perfusion pressures and against the risks of brain edema at<br />
high arterial pressures. B<strong>as</strong>ed on this definition, cerebral autoregulation may be thought of <strong>as</strong> a homeostatic<br />
mechanism that is superimposed over and above the baroreceptor reflexes. The baroreceptors, strategically<br />
located at the most proximal locations in the cerebral circulation, provide the first line of defense against acute<br />
ranges in arterial pressure. Autoregulation then serves <strong>as</strong> the next line of defense by helping to maintain<br />
constant cerebral capillary pressure, thus <strong>as</strong>suring a steady supply of essential metabolites and simultaneously<br />
protecting the blood-brain barrier. Several hypotheses (myogenic, neurogenic, and metabolic) have been<br />
proposed to account for the mechanisms that underlie autoregulation, detailed elsewhere [20].<br />
The anatomical foundation of CBF autoregulation is the arteriole. The arterioles are the l<strong>as</strong>t small<br />
branches of the arterial system, and they act <strong>as</strong> control valves through which blood is rele<strong>as</strong>ed into the<br />
capillaries. The arteriole h<strong>as</strong> a strong muscular wall that is capable of closing the arteriole completely or of<br />
allowing it to be dilated several fold, thus having the capability of v<strong>as</strong>tly altering blood flow to the capillaries<br />
in response to the needs of tissue [21,22]. This arteriolar functioning is visualized by functional MRI in brain<br />
imaging [23].<br />
<strong>REG</strong> showed the cl<strong>as</strong>sical CBF autoregulatory response, indicating its close relationship to arteriolar<br />
changes. Early CBF-<strong>REG</strong> studies did not focus on this topic [24-27].<br />
4.2.2. CBF and CO2<br />
In man, 5% and 7 % CO2 inhalation raises CBF by approximately 50 and 100 %, respectively [10]. Cerebral<br />
v<strong>as</strong>odilatory responses to hypercapnia and hypoxia are consistent, reproducible and reversible. Accordingly,<br />
changes in systemic g<strong>as</strong> tensions have been frequently employed <strong>as</strong> a test of essential cerebrov<strong>as</strong>cular<br />
reactivity under normal and pathophysiologic conditions. The mathematical expressions that govern the<br />
relationship between CBF and partial pressure of carbon dioxide have been described [11, 28]. In these<br />
P3 - 12 RTO-MP-HFM-109
experiments we demonstrated that <strong>REG</strong> detects CBF (and/or volume) incre<strong>as</strong>e during CO2 inhalation,<br />
similarly to other quantitative CBF techniques.<br />
4.2.3. CBF and Hemorrhage<br />
The vital functions of the brain, in spite of its well-developed autoregulation, are impaired during<br />
prolonged hypovolemic conditions <strong>as</strong> the CBF autoregulatory reserve is exhausted. Afferent neural input to<br />
the brain seems to be elevated during shock. It may be presumed that this leads to incre<strong>as</strong>ed tissue metabolism<br />
and the accumulation of metabolites. The low flow combined with elevated neuronal activity and cellular<br />
metabolism produces an imbalance between oxygen delivery and oxygen utilization [29] leading to neuronal<br />
damage.<br />
Cerebrov<strong>as</strong>cular responses to hemorrhage reflect the balance between autoregulatory v<strong>as</strong>odilatation<br />
and sympathetic v<strong>as</strong>oconstriction [30]. During hemorrhage CBF heterogeneity [31] and hypovolemic cerebral<br />
hyperemia w<strong>as</strong> observed [32]. In hemorrhagic hypotension the shift of CBF autoregulation is described [20].<br />
In our experiments during hemorrhage only <strong>REG</strong> showed the cl<strong>as</strong>sical CBF autoregulation: LDF and carotid<br />
flow followed SAP decre<strong>as</strong>e during hemorrhage. It would appear from these responses that the <strong>REG</strong><br />
responses may best be explained if the <strong>REG</strong> signal is a v<strong>as</strong>cular volume me<strong>as</strong>urement <strong>as</strong> opposed to a me<strong>as</strong>ure<br />
of blood flow. This would explain why the <strong>REG</strong> and LDF me<strong>as</strong>ures may change in apparently opposite<br />
directions, such <strong>as</strong> that encountered in the c<strong>as</strong>e of hemorrhagic hypotension.<br />
4.3. <strong>REG</strong><br />
The physical b<strong>as</strong>is of the electrical impedance method is b<strong>as</strong>ed on the fact that blood or cerebrospinal fluid are<br />
better conductors than the brain or other 'dry' tissue. The electrical impedance method (me<strong>as</strong>uring blood flow<br />
by alternating current) is known in clinical practice, however it is used mostly in cardiology and for me<strong>as</strong>uring<br />
peripheral circulation. When used on the head, it is called rheoencephalography, <strong>REG</strong> [26]. <strong>REG</strong> is b<strong>as</strong>ed on<br />
monitoring pulse synchronous variations in cranial electrical impedance over time. Various correlations were<br />
established between <strong>REG</strong> and CBF (volume, flow or pressure, detailed by [26]. <strong>REG</strong> pulse amplitude is<br />
quantified most frequently using its derivative [9,24,25] or integral. Both variables detect the applied CBF<br />
manipulations. The application of the <strong>REG</strong> derivative and integral h<strong>as</strong> an advantage using computer data<br />
processing. Other potential <strong>REG</strong> processing methods [33] have resulted in no practical improvement.<br />
According to an earlier WRAIR publication, <strong>REG</strong> can be used for ICP monitoring [6]. Additionally, recent<br />
results suggest that noninv<strong>as</strong>ive cerebral impedance me<strong>as</strong>urements do reflect intracranial events, and are able<br />
to detect cerebral edema following hypoxia-ischemia [34].<br />
One technical problem with the <strong>REG</strong> instrumentation used in this study is with regard to the fact that<br />
the <strong>REG</strong> device (except in Rat/1 group) with bipolar derivation is able to me<strong>as</strong>ure AC, i.e. pulsatile<br />
impedance only. The b<strong>as</strong>ic impedance is compensated at the beginning of the me<strong>as</strong>urement in such type of<br />
impedance amplifiers, so they are unable to record the DC component <strong>as</strong> a signal. This prevents detection of<br />
changes in the DC portion of the signal, which are related to the overall brain volume. The tetrapolar devices<br />
are able to record b<strong>as</strong>ic impedance and consequently detect the absolute volume changes, <strong>as</strong> they are used in<br />
clinical practice for venous outflow phlebography or impedance cardiography.<br />
In order to avoid potential interference with extracranial circulation here we used intracerebral <strong>REG</strong><br />
derivations, only. We plan to study the relationship of intracerebral and surface derivations.<br />
4.4. <strong>Monitoring</strong><br />
<strong>Rheoencephalography</strong> (<strong>REG</strong>) <strong>as</strong> a <strong>Non</strong>-Inv<strong>as</strong>ive<br />
<strong>Monitoring</strong> Alternative for the Assessment of Brain Blood Flow<br />
The primary aim of managing patients with acute brain injury in the intensive care unit is to minimize<br />
secondary injury by maintaining cerebral perfusion and oxygenation. The mechanisms of secondary injury are<br />
RTO-MP-HFM-109 P3 - 13
<strong>Rheoencephalography</strong> (<strong>REG</strong>) <strong>as</strong> a <strong>Non</strong>-Inv<strong>as</strong>ive<br />
<strong>Monitoring</strong> Alternative for the Assessment of Brain Blood Flow<br />
frequently triggered by secondary insults, which may be subtle and remain undetected by the usual systemic<br />
physiological monitoring. Continuous monitoring of the central nervous system in the intensive care unit can<br />
serve two functions. Firstly it will help early detection of these secondary cerebral insults so that appropriate<br />
interventions can be instituted. Secondly, it can help to monitor therapeutic interventions and provide online<br />
feedback [35]. On the battlefield the Doppler CBF test (or other clinically used CBF me<strong>as</strong>urement, such <strong>as</strong><br />
fMRI, SPECT, PET scan) is not realistic due to size and weight considerations.<br />
From our previous experiment [36] it is known that the information content of <strong>REG</strong> can be different,<br />
depending on the physiological or pathophysiologic range of CBF autoregulation. The <strong>REG</strong> signal reflects the<br />
electrical conductivity within the cranial cavity. Pathophysiologic changes influence the normal conductivity<br />
[27]. Our recent data obtained during CO2 inhalation were collected in the physiological range, consequently,<br />
one cannot draw any conclusions regarding what will be shown under pathophysiologic conditions such <strong>as</strong><br />
hemorrhage or elevated ICP. Similarly, there is no comparative data examining the difference between local<br />
and global CBF and carotid flow during the above conditions. For noninv<strong>as</strong>ive blood flow monitoring<br />
purposes, there is a need to clarify the potentially useful CBF monitoring modality (possibly global flow -<br />
<strong>REG</strong>) and examine the relationship between CBF, SAP, ICP, and EEG. <strong>Non</strong>-inv<strong>as</strong>ive monitoring, including<br />
cardiac impedance me<strong>as</strong>urement, revealed low-flow and poor tissue perfusion that w<strong>as</strong> worse in the nonsurvivors<br />
(on high-risk elective surgery patients, [37].<br />
4.5. Technical Remarks<br />
In clinical practice the CBF autoregulation is me<strong>as</strong>ured <strong>as</strong> a routine test using Doppler ultr<strong>as</strong>ound [38].<br />
Doppler technique, <strong>as</strong> it is used in today’s clinical practice, is not applicable in military environments. The<br />
<strong>REG</strong> CNS monitoring method is more suited for military environments because of its non-inv<strong>as</strong>iveness, good<br />
time resolution and potential for miniaturization. Although several CBF-<strong>REG</strong> correlative studies have shown<br />
that it is possible to quantify CBF me<strong>as</strong>ured by <strong>REG</strong> [24-27], the studies reported here suggest that its utility<br />
would appear to be more related to its relationship to cerebrov<strong>as</strong>cular reactivity (CBF autoregulation).<br />
Therefore, interpretation of the <strong>REG</strong> signal alone, without knowledge of the perfusion pressure or SAP, is<br />
difficult. However, under normotensive conditions, or steady state blood pressure conditions, changes in <strong>REG</strong><br />
amplitude would be expected to correlate with changes in cerebral blood flow.<br />
The key question then is whether <strong>REG</strong> me<strong>as</strong>ures volume or flow. The definition invoked by the FDA<br />
[39] states: Sec. 882.1825. “Rheoencephalograph: (a) Identification. A rheoencephalograph is a device used to<br />
estimate a patient's cerebral circulation (blood flow in the brain) by electrical impedance methods with direct<br />
electrical connections to the scalp or neck area.” In other words it specifically defines <strong>REG</strong> <strong>as</strong> a me<strong>as</strong>ure of<br />
flow and this is the re<strong>as</strong>on why we used flow in the text. On the b<strong>as</strong>is of previous and recent data [40-42],<br />
however, a more practical definition would use volume rather than flow. This statement is supported by<br />
human and animal me<strong>as</strong>urements <strong>as</strong> well [36].<br />
In the potentially applicable <strong>REG</strong> electronics and software used in the Cerberus system [8], the EKG<br />
signal is synthesized from impedance electrodes located on the upper arms and legs. In this c<strong>as</strong>e, the<br />
electrodes (conductive el<strong>as</strong>tic fabrics sewn into a uniform) are multifunctional sensors; a 2-channel bioimpedance<br />
signal can be used to generate a pulse wave, an EKG, a respiratory trace and a pulse wave<br />
transmission time, which could potentially provide noninv<strong>as</strong>ive blood pressure information [43].<br />
5. 0. CONCLUSIONS<br />
Animal studies confirmed that <strong>REG</strong> qualitatively reflects changes in CBF during physiological perturbations<br />
known to alter CBF. The results are consistent with <strong>REG</strong> being a reflection of cerebrov<strong>as</strong>cular responsiveness<br />
<strong>as</strong> opposed to the local CBF changes shown with LDF or carotid flow. Because of the CBF heterogeneity,<br />
only global CBF would be suitable for monitoring purposes.<br />
P3 - 14 RTO-MP-HFM-109
<strong>REG</strong> monitoring may be a useful, non-inv<strong>as</strong>ive, continuous monitoring method of <strong>as</strong>sessing global<br />
CBF and cerebrov<strong>as</strong>cular reactivity or capacitance for combat c<strong>as</strong>ualty care of victims suffering from<br />
hemorrhage and may have applicability for maintaining cerebral blood flow in non-combat medicine <strong>as</strong> well.<br />
Further work will focus on correlating brain function: EEG and CBF/<strong>REG</strong> <strong>as</strong>sessments [44-48] during<br />
hemorrhage and resuscitation, using various resuscitation fluids. Further studies are needed to test the CBF<br />
autoregulation with graded incre<strong>as</strong>es in intracranial pressure, a common consequence of traumatic brain injury<br />
[49-54].<br />
6.0. ACKNOWLEDGEMENTS<br />
The authors thank G. Thuroczy, M. Rosenthal, L. Montgomery, J. Braisted, D, Forcino, A. Warren, A.<br />
Naveen, T. Bentley, S. Cappello, A. Fleming, S. Hills, C. Morrissette, M. Stueber, T. Rose, J. Torres, for their<br />
help and technical support, I. Nagy, J. Heilig, L. Baranyi for use of software, and J. Meer for editorial<br />
<strong>as</strong>sistance.<br />
This work w<strong>as</strong> performed while the first author held a National Research Council (WRAIR<br />
Department of Resuscitative Medicine) Research Associateship.<br />
Disclaimer: Funded by the U.S. Army Medical Research and Materiel Command.<br />
7.0. REFERENCES<br />
<strong>Rheoencephalography</strong> (<strong>REG</strong>) <strong>as</strong> a <strong>Non</strong>-Inv<strong>as</strong>ive<br />
<strong>Monitoring</strong> Alternative for the Assessment of Brain Blood Flow<br />
[1] Bellamy R, Safar P, et al: Suspended animation for delayed resuscitation. Crit Care Med 24(2 Suppl):S24-<br />
S47. 1996<br />
[2] Shoemaker WC, et al. Resuscitation from severe hemorrhage. Crit Care Med 1996 Feb;24(2 Suppl):S12-<br />
23<br />
[3] Safar P. Resuscitation and suspended animation: human sustainment. In: Klatz R, Goldman R (eds): Antiaging<br />
medical therapeutics, vol. II. Health Quest, Marina Del Rey, CA, 37-49, 1998<br />
[4] Astrup J, Symon L, Branston NM, L<strong>as</strong>sen NA. Cortical Evoked Potential and Extracellular K+ and H+ at<br />
Critical Levels of Brain Ischemia. Stroke 8:51-57. 1977<br />
[5] Symon L. Thresold concept of functional failure in the CNS in relation to ischemia. In: Krieglstein J (ed):<br />
Pharmacology of Cerebral Ischemia. Elsevier, Amsterdam, pp 31-39,1986.<br />
[6] McHenry LC jr. <strong>Rheoencephalography</strong>: a clinical appraisal. Neurology. 1965 Jun;15:507-17.<br />
[7] Jenkner FL. A study of cerebrov<strong>as</strong>cular changes and cerebral edema. DDC AD424373, 30 Sep 1963.<br />
[8] Bodo M, Thuroczy G, Nagy I, Peredi J, Sipos K, Harcos P, Nagy Z, Voros J, Zoltai L, Ozsvald L: A<br />
complex cerebrov<strong>as</strong>cular screening system (Cerberus). Medical Progress through Technology,<br />
21(2):53-66. 1995<br />
[9] Montgomery LD et al : An impedance device for study of multisegment hemodynamic changes during<br />
orthostatic stress. Aviat Space Environ Med 1989; 60:1116-22.<br />
[10] Kety SS, Schmidt CF. The effect of altered tensions of carbon dioxide and oxygen on cerebral blood flow<br />
and cerebral oxygen consumption of normal young men. J Clin Invest 1948; 27:484-492.<br />
RTO-MP-HFM-109 P3 - 15
<strong>Rheoencephalography</strong> (<strong>REG</strong>) <strong>as</strong> a <strong>Non</strong>-Inv<strong>as</strong>ive<br />
<strong>Monitoring</strong> Alternative for the Assessment of Brain Blood Flow<br />
[11] Reivich M. Arterial PCO2and cerebral hemodynamics. Am J Physiol 1964; 206:25-35.<br />
[12] Branston NM. The physiology of the cerebrov<strong>as</strong>cular par<strong>as</strong>ympathetic innervation. Br J Neurosurg<br />
1995;9(3):319-29.<br />
[13] Eklof B, Siesjo B K 1973 Cerebral blood flow in ischemia caused by carotid artery ligation in the rat.<br />
Acta Physiol. Scand. 87 69-77.<br />
[14] Mima T. Forbrain ischemia in the rat: the four-vessel occlusion model. In: Ohnishi ST, Ohnishi T (Eds)<br />
Central nervous system trauma. Boca Raton, CRC, 1995. pp 107-117.<br />
[15] Strandgaard S, Paulson OB. Cerebral autoregulation. Stroke. 1984 May-Jun;15(3):413-6.<br />
[16] Nagy I, Bodo M: High-level interactive graphical language for signal processing - GRAL. 7th Hungarian<br />
Conference on Biomedical Engineering, Esztergom, HU, 16-18 Sept, 229-230, 1987.<br />
[17] Heilig J, Thuroczy G, Bodo M, authors: Real time data display software: REDIREC. United States<br />
copyright, TXu 879,647. 1998 June 17.<br />
[18] Bodo M, Pearce FJ, Montgomery LD, Rosenthal M, Kubinyi G, Thuroczy G, Braisted J, Forcino D,<br />
Morrissette C, Nagy I. Me<strong>as</strong>urement of brain electrical impedance: animal studies in<br />
rheoencephalography. Aviat Space Environ Med 2003; 74:506-511<br />
[19] Fitch W. Physiology of the cerebral circulation Bailliere’s Clinical Anaesthesiology 13, No. 4, pp. 487-<br />
498, 1999.<br />
[20] Chillon J.M, Baumbach G.L. Autoregulation: Arterial and intracranial pressure. In: Edvinsson, L.,<br />
Krause, D.N. (Eds.), Cerebral blood flow and metabolism - 2nd ed. Lippincott Williams & Wilkins,<br />
Philadelphia, pp. 395- 412. 2002.<br />
[21] Ganong WF. Review of medical physiology. Lange, 20th ed, New York, 2001.<br />
[22] Kontos HA, Wei EP, Navari RM, Lev<strong>as</strong>seur JE, Rosenblum WI, Patterson JL Jr. Responses of cerebral<br />
arteries and arterioles to acute hypotension and hypertension. Am J Physiol 1978 Apr;234(4):H371-83.<br />
[23] Vainrub A, Li TB, Fofanov Y, Pettott BM. Theoretical considerations for the efficient design DNA<br />
arrays. In: Moore J, Zouridakis G (eds) Biomedical technology and devices handbook. CRC Press, Boca<br />
Raton, 2004. pp 14-1-14.<br />
[24] Hadjiev D: A new method for quantitative evaluation of cerebral blood flow by rheoencephalography.<br />
Brain Res 8:213-215. 1968<br />
[25] Jacquy J, Dekonick WJ, Piraux A, Calay R, Bacq J, Levy D, Noel G. Cerebral blood flow and<br />
quantitative rheoencephalography. Electroenceph Clin. Neurophysiol 37:501-511. 1974<br />
[26] Jenkner FL: Clinical Rheonecephalography. Ertldruck, Vienna, Austria, 1986<br />
[27] Moskalenko, Yu. Ye. (ed). Biophysical <strong>as</strong>pects of cerebral circulation. Oxford, Pergamon, 1980.<br />
[28] Olesen J, Paulson OB, L<strong>as</strong>sen NA. Regional cerebral blood flow in man determined by the initial slope of<br />
the clearance of intra-arterially injected 133 Xe. Stroke 1971; 2:519-540.<br />
[29] Kovach AG. Cerebral circulation in hypoxia and ischemia. Prog Clin Biol Res 1988;264:147-58<br />
[30] Pearce WJ, D'Alecy LG. Hemorrhage-induced cerebral v<strong>as</strong>oconstriction in dogs.<br />
Stroke. 1980 Mar-Apr;11(2):190-7.<br />
P3 - 16 RTO-MP-HFM-109
<strong>Rheoencephalography</strong> (<strong>REG</strong>) <strong>as</strong> a <strong>Non</strong>-Inv<strong>as</strong>ive<br />
<strong>Monitoring</strong> Alternative for the Assessment of Brain Blood Flow<br />
[31] Komjati K, Sandor P, Reivich M, Greenberg JH, Kovach AG, Jaggi JL, Nyary I. Regional heterogeneity<br />
and differential vulnerability of cerebral and spinal v<strong>as</strong>cular CO2-responsiveness during graded<br />
hemorrhagic hypotension. Acta Physiol Hung 84:229-49. 1996.<br />
[32] W<strong>as</strong>chke KF, Riedel M, Albrecht DM, van Ackern K, Kuschinsky W. Regional heterogeneity of cerebral<br />
blood flow response to graded volume-controlled hemorrhage. Intensive Care Med. 1996<br />
Oct;22(10):1026-33.<br />
[33] Sokolova IV, Iarullin KhKh, Maksimenko IM, Ronkin MA. [Analysis of the structure of the<br />
rheoencephalogram <strong>as</strong> a biosignal of pulsatile blood-filling] Zh Nevropatol Psikhiatr Im S S Korsakova.<br />
1977;77(9):1314-21. [Article in Russian]<br />
[34] Lingwood BE, Dunster KR, Colditz PB, Ward LC. <strong>Non</strong>inv<strong>as</strong>ive me<strong>as</strong>urement of cerebral bioimpedance<br />
for detection of cerebral edema in the neonatal piglet. Brain Res. 2002 Jul 26;945(1):97-105.<br />
[35] Gupta AK. <strong>Monitoring</strong> the injured brain in the intensive care unit. J Postgrad Med. 2002 Jul-<br />
Sep;48(3):218-25.<br />
[36] Bodo M, Racz J, Ili<strong>as</strong> L, P<strong>as</strong>ztor A, Vajda J, Weinstein GB, P<strong>as</strong>ztor E, Moskalenko YE:<br />
Rheoencephalographic changes during incre<strong>as</strong>ed intracranial pressure. In: Krieglstein J (ed):<br />
Pharmacology of Cerebral Ischemia. Elsevier, Amsterdam, 1986. pp 265-269.<br />
[37] Velmahos GC, Wo CC, Demetriades D, Murray JA, Cornwell EE 3rd, Asensio JA,<br />
Belzberg H, Shoemaker WC. Inv<strong>as</strong>ive and non-inv<strong>as</strong>ive physiological monitoring of blunt trauma patients<br />
in the early period after emergency admission. Int Surg. 1999 Oct-Dec;84(4):354-60.<br />
[38] A<strong>as</strong>lid R, Lindegaard KF, Sorteberg W, Nornes H. Cerebral autoregulation dynamics in humans. Stroke<br />
1989; 20:45-52.<br />
[39] Anonymous 1997 Rheoencephalograph. (a) Identification. Code of Federal Regulations, Title 21,<br />
Volume 8, Parts 800 to 1299. Revised <strong>as</strong> of April 1, 1997 (W<strong>as</strong>hington, DC, U.S. Government Printing<br />
Office)<br />
[40] Nyboer J. Regional pulse volume and perfusion flow me<strong>as</strong>urement. AMA Arch. Internat Med 1960;<br />
105:64-276.<br />
[41] Nyboyer J: Electrorheometric properties of tissues and fluids. In: Markovich SE, ed. International<br />
Conference on Bioelectrical Impedance, 1970 July 30. Annals of the New York Academy of Sciences,<br />
170: 410-20. New York, NY 1970.<br />
[42] Bodo M, Pearce FJ, Thuroczy G, Braisted J, Montgomery LD, Kubinyi G, Forcino D, Baranyi L, Heilig J,<br />
Nagy I, Morrissette C, Lee J. Electrical impedance validations: in vitro and in vivo studies. In: Grimmes<br />
S, Martinsen OG, Bruvoll H (eds): Proceedings of the XI International Conference on Electrical Bio-<br />
Impedance. June 17-21, 2001 Oslo, Norway. Unipob Vorlag, Oslo. ISBN: 82-91853-05-3, pp 325-29.<br />
[43] Bodo M, Sowd M, Pearce FJ. Evaluation of wearable conductive fabrics for the peripheral pulse<br />
detection and me<strong>as</strong>urement of continuous non-inv<strong>as</strong>ive blood pressure by pulse wave velocity.<br />
Advanced Technology Applications for Combat C<strong>as</strong>ualty Care 2003 Conference, August 18-21, 2003<br />
St. Pete Beach, FL. Poster Session: Advance Combat Medic Capabilities Research, Poster #2.<br />
[44] Zikov T, Schmidt RN. C<strong>as</strong>ualty vital signs and brain status monitor. Advanced Technology Applications<br />
for Combat C<strong>as</strong>ualty Care 2003 Conference, August 18-21, 2003 St. Pete Beach, FL, Poster Session:<br />
Advance Combat Medic Capabilities Research, Poster #13.<br />
[45] Zikov, T.; Bibian, S.; Dumont, G.A.; Huzmezan, M.; Ries, C.R.; "A wavelet b<strong>as</strong>ed de-noising technique<br />
for ocular artifact correction of the electroencephalogram"; [Engineering in Medicine and Biology,<br />
2002. 24th Annual Conference and the Annual Fall Meeting of the Biomedical Engineering Society],<br />
Proceedings of the Second Joint EMBS/BMES Conference, Volume: 1, Page(s): 98 -105 vol.1. 2002.<br />
RTO-MP-HFM-109 P3 - 17
<strong>Rheoencephalography</strong> (<strong>REG</strong>) <strong>as</strong> a <strong>Non</strong>-Inv<strong>as</strong>ive<br />
<strong>Monitoring</strong> Alternative for the Assessment of Brain Blood Flow<br />
[46] Freeman J, Ingvar DH. Elimination by hypoxia cerebral blood flow autoregulation and EEG relationship.<br />
Exp Brain Res. 1968;5(1):61-71.<br />
[47] Ingvar DH, Sjolund B, Ardo A. Correlation between dominant EEG frequency, cerebral oxygen uptake<br />
and blood flow. Electroencephalogr Clin Neurophysiol. 1976 Sep;41(3):268-76.<br />
[48] Jacquy J, Charles P, Piraux A, Noel G. Relationship between the electroencephalogram and the<br />
rheoencephalogram in the normal young adult. Neuropsychobiology. 1980;6(6):341-8.<br />
[49] Bakay L, Lee JC. Cerebral edema. Thom<strong>as</strong> CC, Springfield, IL, 1965.<br />
[50] Marmarou A. Traumatic brain edema: an overview. Acta Neurochir Suppl (Wien). 1994;60:421-4.<br />
[51] Manz HJ. Pathophysiology and pathology of elevated intracranial pressure. Pathobiol Annu. 1979;9:359-<br />
81.<br />
[52] Pronk RAF. Peri-operative monitoring. IN: Lopes de Silva FH, Storm van Leeuwen,<br />
Remond A (eds) Handbook of electroencephalography and clinical neurophysiology, vol. 2. Clinical<br />
applications of computer analysis of EEG and other neurophysiological signals. Amsterdam, Elsevier,<br />
1986. pp 93-130.<br />
[53] Rosner MJ, Rosner SD, Johnson AH. Cerebral perfusion pressure: management protocol and clinical<br />
results. J Neurosurg. 1995 Dec;83(6):949-62.<br />
[54] Roffey P, Zellman V, Katz RL. Intraoperative evaluation of tissue perfusion in high-risk patients by<br />
inv<strong>as</strong>ive and noninv<strong>as</strong>ive hemodynamic monitoring. Crit Care Med. 1999 Oct;27(10):2147-52.<br />
P3 - 18 RTO-MP-HFM-109