

.DON MILLS CROSSING TRANSPORTATION STUDY
Don%20Mills%20Crossing%20Transportation%20Study_FinalAODA_Dec28-2016_2
Don%20Mills%20Crossing%20Transportation%20Study_FinalAODA_Dec28-2016_2

You also want an ePaper? Increase the reach of your titles
YUMPU automatically turns print PDFs into web optimized ePapers that Google loves.
Don Mills Crossing Transportation Study: Phase 1<br />
4.3 Demographic Characteristics <br />
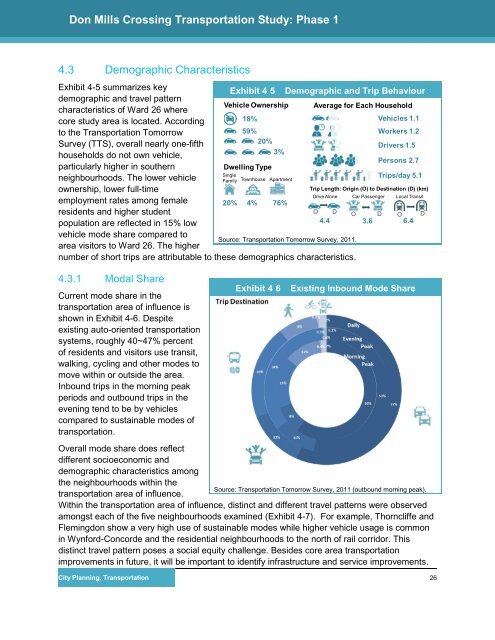
Exhibit 4-5 summarizes key<br />
demographic and travel pattern<br />
characteristics of Ward 26 where<br />
Vehicle Ownership<br />
core study area is located. Accordi ng<br />
to the Transportation Tomorrow<br />
Survey (TTS), overall nearly one-fif th<br />
households do not own vehicle,<br />
18%<br />
59%<br />
20%<br />
3%<br />
particularly higher in southern<br />
Dwelling Type<br />
Single<br />
neighbourhoods. The lower vehicle<br />
Family Townhouse Apartment<br />
ownership, lower full-time<br />
employment rates among female 20% 4% 76%<br />
residents and higher student<br />
O<br />
population are reflected in 15% low<br />
4.4<br />
vehicle mode share compared to<br />
area visitors to Ward 26. The highe r<br />
Source: Transportation Tomorrow Survey, 2011.<br />
number of short trips are attributable to these demographics characteristics.<br />
4.3.1 Modal Share<br />
Current mode share in the<br />
transportation area of influence is<br />
shown in Exhibit 4-6. Despite<br />
existing auto-oriented transportation<br />
systems, roughly 40~47% percent<br />
of residents and visitors use transit,<br />
walking, cycling and other modes to<br />
move within or outside the area.<br />
Inbound trips in the morning peak<br />
periods and outbound trips in the<br />
evening tend to be by vehicles<br />
compared to sustainable modes of<br />
transportation.<br />
Exhibit 4 - 5 – Demographic and Trip Behaviour<br />
Average for Each Household<br />
Vehicles 1.1<br />
Workers 1.2<br />
Drivers 1.5<br />
Persons 2.7<br />
Trips/day 5.1<br />
Trip Length: Origin (O) to Destination (D) (km)<br />
Drive Alone Car Passenger Local Transit<br />
D O D O D<br />
3.6 6.4<br />
Exhibit 4 - 6 – Existing Inbound Mode Share<br />
Overall mode share does reflect<br />
different socioeconomic and<br />
demographic characteristics among<br />
the neighbourhoods within the<br />
Source: Transportation Tomorrow Survey, 2011 (outbound morning peak).<br />
transportation area of influence.<br />
Within the transportation area of influence, distinct and different travel patterns were observed<br />
amongst each of the five neighbourhoods examined (Exhibit 4-7). For example, Thorncliffe and<br />
Flemingdon show a very high use of sustainable modes while higher vehicle usage is common<br />
in Wynford-Concorde and the residential neighbourhoods to the north of rail corridor. This<br />
distinct travel pattern poses a social equity challenge. Besides core area transportation<br />
improvements in future, it will be important to identify infrastructure and service improvements.<br />
City Planning, Transportation<br />
26