The FUSE Archival Data Handbook - MAST - STScI
The FUSE Archival Data Handbook - MAST - STScI
The FUSE Archival Data Handbook - MAST - STScI

Create successful ePaper yourself
Turn your PDF publications into a flip-book with our unique Google optimized e-Paper software.
4.2.1.4 Preview Files (*rat.gif, *ext.gif)<br />
Two types of exposure-level diagnostic preview files are available, and both serve as useful tools<br />
to verify the integrity of spectra derived from the exposure.<br />
*rat.gif: <strong>The</strong>se files display the count rate throughout the exposure (see Fig. 4.3). For TTAG<br />
data, this is the actual count rate for events occurring within the region of the detector corresponding<br />
to the target aperture (excluding airglow features) evaluated every second. For<br />
HIST data, these are the dead time corrected counter data from the time engineering files<br />
(housekeeping file, see Section 5.2), which are sampled once every 16 seconds (see Table 4.9).<br />
For non-variable objects, these are useful diagnostics, since they enable the user to determine<br />
whether the target remained within the aperture throughout the exposure.<br />
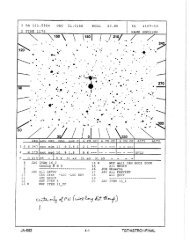
Figure 4.3: Example of a count rate plot (*rat.gif) for detector segment 1A of exposure 001<br />
for the TTAG observation C1600101. <strong>The</strong>se plots show the count rates within the science<br />
apertures. <strong>The</strong> various reasons for flagging bad data are shown below the figure. <strong>The</strong> dashed<br />
curve is the count rate from the sections of the detector used for burst detection. In this case,<br />
the plot shows that the observation was obtained during the day, and that several bursts were<br />
detected and eliminated from the final spectrum. It also shows that the SiC1A count rate varied<br />
significantly during the observation. Because the same plot for LiF1A is stable, we conclude<br />
that the target was wandering in and out of the SiC1 aperture (see Chapter 7). As a result, the<br />
flux level of the SiC1A spectrum will be less than other channels covering similar wavelengths<br />
(see Fig. 4.7). Cal<strong>FUSE</strong> cannot check for this effect since different segments are processed<br />
independently and cannot be compared. However, users can use the <strong>FUSE</strong> tools to exclude these<br />
regions (see Chapters 3 and 8).<br />
30