

Measuring the SDGs an initial picture for the Netherlands
SDGs-NL
SDGs-NL

Create successful ePaper yourself
Turn your PDF publications into a flip-book with our unique Google optimized e-Paper software.
SDG 13 Climate protection<br />
——<br />
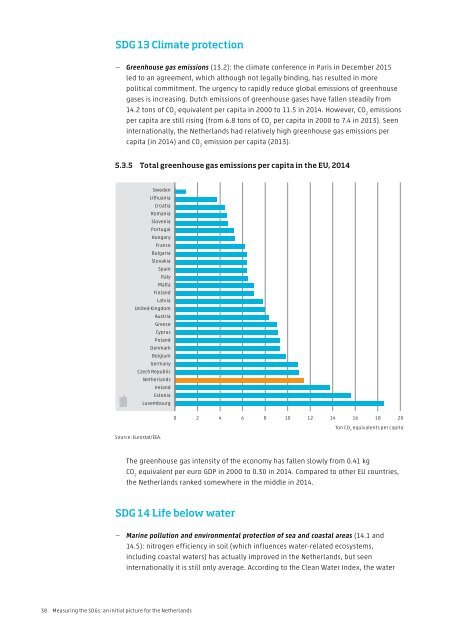
Greenhouse gas emissions (13.2): <strong>the</strong> climate conference in Paris in December 2015<br />
led to <strong>an</strong> agreement, which although not legally binding, has resulted in more<br />
political commitment. The urgency to rapidly reduce global emissions of greenhouse<br />
gases is increasing. Dutch emissions of greenhouse gases have fallen steadily from<br />
14.2 tons of CO 2<br />
equivalent per capita in 2000 to 11.5 in 2014. However, CO 2<br />
emissions<br />
per capita are still rising (from 6.8 tons of CO 2<br />
per capita in 2000 to 7.4 in 2013). Seen<br />
internationally, <strong>the</strong> Ne<strong>the</strong>rl<strong>an</strong>ds had relatively high greenhouse gas emissions per<br />
capita (in 2014) <strong>an</strong>d CO 2<br />
emission per capita (2013).<br />
5.3.5 Total greenhouse gas emissions per capita in <strong>the</strong> EU, 2014<br />
Sweden<br />
Lithu<strong>an</strong>ia<br />
Croatia<br />
Rom<strong>an</strong>ia<br />
Slovenia<br />
Portugal<br />
Hungary<br />
Fr<strong>an</strong>ce<br />
Bulgaria<br />
Slovakia<br />
Spain<br />
Italy<br />
Malta<br />
Finl<strong>an</strong>d<br />
Latvia<br />
United Kingdom<br />
Austria<br />
Greece<br />
Cyprus<br />
Pol<strong>an</strong>d<br />
Denmark<br />
Belgium<br />
Germ<strong>an</strong>y<br />
Czech Republic<br />
Ne<strong>the</strong>rl<strong>an</strong>ds<br />
Irel<strong>an</strong>d<br />
Estonia<br />
Luxembourg<br />
Source: Eurostat/EEA.<br />
0 2 4 6 8 10 12 14 16 18 20<br />
Ton CO 2<br />
equivalents per capita<br />
The greenhouse gas intensity of <strong>the</strong> economy has fallen slowly from 0.41 kg<br />
CO 2<br />
equivalent per euro GDP in 2000 to 0.30 in 2014. Compared to o<strong>the</strong>r EU countries,<br />
<strong>the</strong> Ne<strong>the</strong>rl<strong>an</strong>ds r<strong>an</strong>ked somewhere in <strong>the</strong> middle in 2014.<br />
SDG 14 Life below water<br />
——<br />
Marine pollution <strong>an</strong>d environmental protection of sea <strong>an</strong>d coastal areas (14.1 <strong>an</strong>d<br />
14.5): nitrogen efficiency in soil (which influences water-related ecosystems,<br />
including coastal waters) has actually improved in <strong>the</strong> Ne<strong>the</strong>rl<strong>an</strong>ds, but seen<br />
internationally it is still only average. According to <strong>the</strong> Cle<strong>an</strong> Water Index, <strong>the</strong> water<br />
38 <strong>Measuring</strong> <strong>the</strong> <strong>SDGs</strong>: <strong>an</strong> <strong>initial</strong> <strong>picture</strong> <strong>for</strong> <strong>the</strong> Ne<strong>the</strong>rl<strong>an</strong>ds