227ch 8 practice
227ch 8 practice
227ch 8 practice

You also want an ePaper? Increase the reach of your titles
YUMPU automatically turns print PDFs into web optimized ePapers that Google loves.
Chapter 8 review questions<br />
Disclaimer: Actual exam questions do not mirror these questions. This is here as a tool for <strong>practice</strong> only. The actual exam<br />
is fill in and not multiple choice, also.<br />
Solve the problem.<br />
1) What do you conclude about the claim<br />
below? Do not use formal procedures or exact<br />
calculations. Use only the rare event rule and<br />
make a subjective estimate to determine<br />
whether the event is likely.<br />
Claim: A die is fair and in 100 rolls there are<br />
63 sixes.<br />
Assume that a hypothesis test of the given claim will be<br />
conducted. Identify the type I or type II error for the test.<br />
2) The principal of a school claims that the<br />
percentage of students at his school that come<br />
from single-parent homes is 13%. Identify the<br />
type II error for the test.<br />
A) Fail to reject the claim that the<br />
percentage of students that come from<br />
single-parent homes is equal to 13%<br />
when that percentage is actually<br />
different from 13%.<br />
B) Fail to reject the claim that the<br />
percentage of students that come from<br />
single-parent homes is equal to 13%<br />
when that percentage is actually 13%.<br />
C) Reject the claim that the percentage of<br />
students that come from single-parent<br />
homes is equal to 13% when that<br />
percentage is actually 13%.<br />
D) Reject the claim that the percentage of<br />
students that come from single-parent<br />
homes is equal to 13% when that<br />
percentage is actually less than 13%.<br />
1<br />
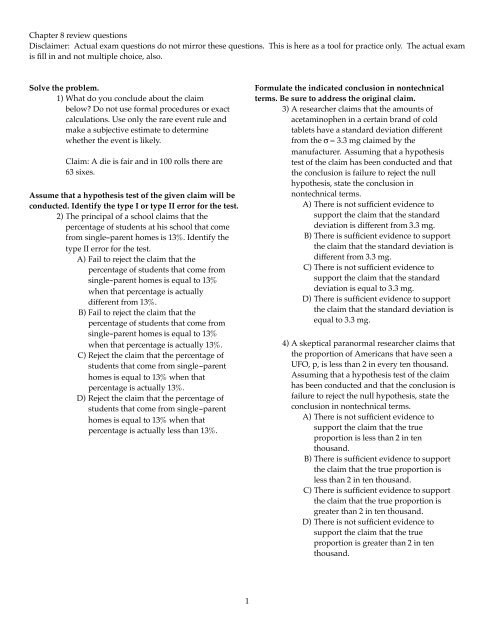
Formulate the indicated conclusion in nontechnical<br />
terms. Be sure to address the original claim.<br />
3) A researcher claims that the amounts of<br />
acetaminophen in a certain brand of cold<br />
tablets have a standard deviation different<br />
from the σ = 3.3 mg claimed by the<br />
manufacturer. Assuming that a hypothesis<br />
test of the claim has been conducted and that<br />
the conclusion is failure to reject the null<br />
hypothesis, state the conclusion in<br />
nontechnical terms.<br />
A) There is not sufficient evidence to<br />
support the claim that the standard<br />
deviation is different from 3.3 mg.<br />
B) There is sufficient evidence to support<br />
the claim that the standard deviation is<br />
different from 3.3 mg.<br />
C) There is not sufficient evidence to<br />
support the claim that the standard<br />
deviation is equal to 3.3 mg.<br />
D) There is sufficient evidence to support<br />
the claim that the standard deviation is<br />
equal to 3.3 mg.<br />
4) A skeptical paranormal researcher claims that<br />
the proportion of Americans that have seen a<br />
UFO, p, is less than 2 in every ten thousand.<br />
Assuming that a hypothesis test of the claim<br />
has been conducted and that the conclusion is<br />
failure to reject the null hypothesis, state the<br />
conclusion in nontechnical terms.<br />
A) There is not sufficient evidence to<br />
support the claim that the true<br />
proportion is less than 2 in ten<br />
thousand.<br />
B) There is sufficient evidence to support<br />
the claim that the true proportion is<br />
less than 2 in ten thousand.<br />
C) There is sufficient evidence to support<br />
the claim that the true proportion is<br />
greater than 2 in ten thousand.<br />
D) There is not sufficient evidence to<br />
support the claim that the true<br />
proportion is greater than 2 in ten<br />
thousand.
5) Carter Motor Company claims that its new<br />
sedan, the Libra, will average better than 30<br />
miles per gallon in the city. Assuming that a<br />
hypothesis test of the claim has been<br />
conducted and that the conclusion is to reject<br />
the null hypothesis, state the conclusion in<br />
nontechnical terms.<br />
A) There is sufficient evidence to support<br />
the claim that the mean is greater than<br />
30 miles per gallon.<br />
B) There is not sufficient evidence to<br />
support the claim that the mean is<br />
greater than 30 miles per gallon.<br />
C) There is sufficient evidence to support<br />
the claim that the mean is less than 30<br />
miles per gallon.<br />
D) There is not sufficient evidence to<br />
support the claim that the mean is less<br />
than 30 miles per gallon.<br />
6) The owner of a football team claims that the<br />
average attendance at games is over 694, and<br />
he is therefore justified in moving the team to<br />
a city with a larger stadium. Assuming that a<br />
hypothesis test of the claim has been<br />
conducted and that the conclusion is failure<br />
to reject the null hypothesis, state the<br />
conclusion in nontechnical terms.<br />
A) There is not sufficient evidence to<br />
support the claim that the mean<br />
attendance is greater than 694.<br />
B) There is sufficient evidence to support<br />
the claim that the mean attendance is<br />
less than 694.<br />
C) There is not sufficient evidence to<br />
support the claim that the mean<br />
attendance is less than 694.<br />
D) There is sufficient evidence to support<br />
the claim that the mean attendance is<br />
greater than than 694.<br />
Identify the null hypothesis, alternative hypothesis, test<br />
statistic, P-value, conclusion about the null hypothesis,<br />
and final conclusion that addresses the original claim.<br />
7) According to a recent poll 53% of Americans<br />
would vote for the incumbent president. If a<br />
random sample of 100 people results in 45%<br />
who would vote for the incumbent, test the<br />
claim that the actual percentage is 53%. Use a<br />
0.10 significance level.<br />
2<br />
Solve the problem.<br />
8) What do you conclude about the claim<br />
below? Do not use formal procedures or exact<br />
calculations. Use only the rare event rule and<br />
make a subjective estimate to determine<br />
whether the event is likely.<br />
Claim: A company claims that the proportion<br />
of defective units among a particular model<br />
of computers is 4%. In a shipment of 200 such<br />
computers, there are 10 defective units.<br />
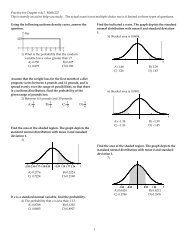
Use the given information to find the P-value. Also, use<br />
a 0.05 significance level and state the conclusion about<br />
the null hypothesis (reject the null hypothesis or fail to<br />
reject the null hypothesis).<br />
9) With H1: p ≠ 0.612, the test statistic is z =<br />
-3.06.<br />
A) 0.0022; reject the null hypothesis<br />
B) 0.0011; reject the null hypothesis<br />
C) 0.0011; fail to reject the null hypothesis<br />
D) 0.0022; fail to reject the null hypothesis<br />
Express the null hypothesis and the alternative<br />
hypothesis in symbolic form. Use the correct symbol<br />
(µ, p, σ) for the indicated parameter.<br />
10) A skeptical paranormal researcher claims that<br />
the proportion of Americans that have seen a<br />
UFO, p, is less than 3 in every one thousand.<br />
A) H0: p = 0.003 B) H0: p > 0.003<br />
H1: p < 0.003<br />
C) H0: p < 0.003<br />
H1: p ≥ 0.003<br />
H1: p ≤ 0.003<br />
D) H0: p = 0.003<br />
H1: p > 0.003<br />
Identify the null hypothesis, alternative hypothesis, test<br />
statistic, P-value, conclusion about the null hypothesis,<br />
and final conclusion that addresses the original claim.<br />
11) A supplier of digital memory cards claims<br />
that no more than 1% of the cards are<br />
defective. In a random sample of 600 memory<br />
cards, it is found that 3% are defective, but<br />
the supplier claims that this is only a sample<br />
fluctuation. At the 0.01 level of significance,<br />
test the supplier's claim that no more than 1%<br />
are defective.
12) In a clinical study of an allergy drug, 108 of<br />
the 202 subjects reported experiencing<br />
significant relief from their symptoms. At the<br />
0.01 significance level, test the claim that<br />
more than half of all those using the drug<br />
experience relief.<br />
Formulate the indicated conclusion in nontechnical<br />
terms. Be sure to address the original claim.<br />
13) An entomologist writes an article in a<br />
scientific journal which claims that fewer<br />
than 12 in ten thousand male fireflies are<br />
unable to produce light due to a genetic<br />
mutation. Assuming that a hypothesis test of<br />
the claim has been conducted and that the<br />
conclusion is to reject the null hypothesis,<br />
state the conclusion in nontechnical terms.<br />
A) There is sufficient evidence to support<br />
the claim that the true proportion is<br />
less than 12 in ten thousand.<br />
B) There is not sufficient evidence to<br />
support the claim that the true<br />
proportion is less than 12 in ten<br />
thousand.<br />
C) There is sufficient evidence to support<br />
the claim that the true proportion is<br />
greater than 12 in ten thousand.<br />
D) There is not sufficient evidence to<br />
support the claim that the true<br />
proportion is greater than 12 in ten<br />
thousand.<br />
Use the given information to find the P-value. Also, use<br />
a 0.05 significance level and state the conclusion about<br />
the null hypothesis (reject the null hypothesis or fail to<br />
reject the null hypothesis).<br />
14) The test statistic in a left-tailed test is z =<br />
-2.05.<br />
A) 0.0202; reject the null hypothesis<br />
B) 0.4798; fail to reject the null hypothesis<br />
C) 0.0404; reject the null hypothesis<br />
D) 0.0453 fail to reject the null hypothesis<br />
Assume that the data has a normal distribution and the<br />
number of observations is greater than fifty. Find the<br />
critical z value used to test a null hypothesis.<br />
15) α = 0.08; H1 is µ ≠ 3.24<br />
A) ±1.75 B) 1.75<br />
C) 1.41 D) ±1.41<br />
3<br />
Use the given information to find the P-value. Also, use<br />
a 0.05 significance level and state the conclusion about<br />
the null hypothesis (reject the null hypothesis or fail to<br />
reject the null hypothesis).<br />
16) The test statistic in a right-tailed test is z =<br />
1.43.<br />
A) 0.0764; fail to reject the null hypothesis<br />
B) 0.0764; reject the null hypothesis<br />
C) 0.1528; fail to reject the null hypothesis<br />
D) 0.1528; reject the null hypothesis<br />
17) With H1: p > 0.383, the test statistic is z = 0.41.<br />
A) 0.3409; fail to reject the null hypothesis<br />
B) 0.6591; fail to reject the null hypothesis<br />
C) 0.3409; reject the null hypothesis<br />
D) 0.6818; reject the null hypothesis<br />
Find the value of the test statistic z using z = p^ - p<br />
pq<br />
n<br />
18) The claim is that the proportion of accidental<br />
deaths of the elderly attributable to<br />
residential falls is more than 0.10, and the<br />
sample statistics include n = 800 deaths of the<br />
elderly with 15% of them attributable to<br />
residential falls.<br />
A) 4.71 B) -3.96<br />
C) -4.71 D) 3.96<br />
19) A claim is made that the proportion of<br />
children who play sports is less than 0.5, and<br />
the sample statistics include n = 1671 subjects<br />
with 30% saying that they play a sport.<br />
A) -16.35 B) 16.35<br />
C) -33.38 D) 33.38<br />
.
Express the null hypothesis and the alternative<br />
hypothesis in symbolic form. Use the correct symbol<br />
(µ, p, σ) for the indicated parameter.<br />
20) The owner of a football team claims that the<br />
average attendance at games is over 62,900,<br />
and he is therefore justified in moving the<br />
team to a city with a larger stadium.<br />
A) H0: µ = 62,900<br />
H1: µ > 62,900<br />
B) H0: µ > 62,900<br />
H1: µ ≤ 62,900<br />
C) H0: µ < 62,900<br />
H1: µ ≥ 62,900<br />
D) H0: µ = 62,900<br />
H1: µ < 62,900<br />
Assume that the data has a normal distribution and the<br />
number of observations is greater than fifty. Find the<br />
critical z value used to test a null hypothesis.<br />
21) α = 0.09 for a right-tailed test.<br />
A) 1.34 B) ±1.34<br />
C) 1.96 D) ±1.96<br />
Solve the problem.<br />
22) Write the claim that is suggested by the given<br />
statement, then write a conclusion about the<br />
claim. Do not use symbolic expressions or<br />
formal procedures; use common sense.<br />
A person claims to have extra sensory<br />
powers. A card is drawn at random from a<br />
deck of cards and without looking at the card,<br />
the person is asked to identify the suit of the<br />
card. He correctly identifies the suit 28 times<br />
out of 100.<br />
Find the P-value for the indicated hypothesis test.<br />
23) A medical school claims that more than 28%<br />
of its students plan to go into general<br />
<strong>practice</strong>. It is found that among a random<br />
sample of 130 of the school's students, 32% of<br />
them plan to go into general <strong>practice</strong>. Find<br />
the P-value for a test of the school's claim.<br />
A) 0.1539 B) 0.3461<br />
C) 0.3078 D) 0.1635<br />
4<br />
Express the null hypothesis and the alternative<br />
hypothesis in symbolic form. Use the correct symbol<br />
(µ, p, σ) for the indicated parameter.<br />
24) A researcher claims that the amounts of<br />
acetaminophen in a certain brand of cold<br />
tablets have a standard deviation different<br />
from the σ = 3.3 mg claimed by the<br />
manufacturer.<br />
A) H0: σ = 3.3 mg<br />
H1: σ ≠ 3.3 mg<br />
B) H0: σ ≠ 3.3 mg<br />
H1: σ = 3.3 mg<br />
C) H0: σ ≥ 3.3 mg<br />
H1: σ < 3.3 mg<br />
D) H0: σ ≤ 3.3 mg<br />
H1: σ > 3.3 mg<br />
Assume that the data has a normal distribution and the<br />
number of observations is greater than fifty. Find the<br />
critical z value used to test a null hypothesis.<br />
25) α = 0.05 for a left-tailed test.<br />
A) -1.645 B) ±1.645<br />
C) -1.96 D) ±1.96<br />
Express the null hypothesis and the alternative<br />
hypothesis in symbolic form. Use the correct symbol<br />
(µ, p, σ) for the indicated parameter.<br />
26) A cereal company claims that the mean<br />
weight of the cereal in its packets is at least 14<br />
oz.<br />
A) H0: µ = 14<br />
B) H0: µ < 14<br />
H1: µ < 14<br />
C) H0: µ = 14<br />
H1: µ > 14<br />
H1: µ ≥ 14<br />
D) H0: µ > 14<br />
H1: µ ≤ 14<br />
Find the P-value for the indicated hypothesis test.<br />
27) In a sample of 88 children selected randomly<br />
from one town, it is found that 8 of them<br />
suffer from asthma. Find the P-value for a<br />
test of the claim that the proportion of all<br />
children in the town who suffer from asthma<br />
is equal to 11%.<br />
A) 0.5686 B) 0.2843<br />
C) 0.2157 D) -0.2843
Identify the null hypothesis, alternative hypothesis, test<br />
statistic, P-value, conclusion about the null hypothesis,<br />
and final conclusion that addresses the original claim.<br />
28) The health of employees is monitored by<br />
periodically weighing them in. A sample of<br />
54 employees has a mean weight of 183.9 lb.<br />
Assuming that σ is known to be 121.2 lb, use<br />
a 0.10 significance level to test the claim that<br />
the population mean of all such employees<br />
weights is less than 200 lb.<br />
Determine whether the given conditions justify testing a<br />
claim about a population mean µ.<br />
29) The sample size is n = 19, σ is not known, and<br />
the original population is normally<br />
distributed.<br />
A) Yes B) No<br />
Find the P-value for the indicated hypothesis test.<br />
30) Find the P-value for a test of the claim that<br />
less than 50% of the people following a<br />
particular diet will experience increased<br />
energy. Of 100 randomly selected subjects<br />
who followed the diet, 47 noticed an increase<br />
in their energy level.<br />
A) 0.2743 B) 0.7257<br />
C) 0.2257 D) 0.5486<br />
Determine whether the hypothesis test involves a<br />
sampling distribution of means that is a normal<br />
distribution, Student t distribution, or neither.<br />
31) Claim: µ = 82. Sample data: n = 20, x = 100, s =<br />
15.1. The sample data appear to come from a<br />
population with a distribution that is very far<br />
from normal, and σ is unknown.<br />
A) Neither<br />
B) Student t<br />
C) Normal<br />
32) Claim: µ = 120. Sample data: n = 11, x = 100, s<br />
= 15.2. The sample data appear to come from<br />
a normally distributed population with<br />
unknown µ and σ.<br />
A) Student t<br />
B) Normal<br />
C) Neither<br />
5<br />
Test the given claim. Use the P-value method or the<br />
traditional method as indicated. Identify the null<br />
hypothesis, alternative hypothesis, test statistic, critical<br />
value(s) or P-value, conclusion about the null<br />
hypothesis, and final conclusion that addresses the<br />
original claim.<br />
33) A simple random sample of 15-year old boys<br />
from one city is obtained and their weights<br />
(in pounds) are listed below. Use a 0.01<br />
significance level to test the claim that these<br />
sample weights come from a population with<br />
a mean equal to 149 lb. Assume that the<br />
standard deviation of the weights of all<br />
15-year old boys in the city is known to be<br />
16.2 lb. Use the traditional method of testing<br />
hypotheses.<br />
147 138 162 151 134 189 157<br />
144 175 127 164<br />
Determine whether the hypothesis test involves a<br />
sampling distribution of means that is a normal<br />
distribution, Student t distribution, or neither.<br />
34) Claim: µ = 981. Sample data: n = 24, x = 972, s<br />
= 26. The sample data appear to come from a<br />
normally distributed population with σ = 28.<br />
A) Normal<br />
B) Student t<br />
C) Neither<br />
Find the P-value for the indicated hypothesis test.<br />
35) A nationwide study of American<br />
homeowners revealed that 65% have one or<br />
more lawn mowers. A lawn equipment<br />
manufacturer, located in Omaha, feels the<br />
estimate is too low for households in Omaha.<br />
Find the P-value for a test of the claim that<br />
the proportion with lawn mowers in Omaha<br />
is higher than 65%. Among 497 randomly<br />
selected homes in Omaha, 340 had one or<br />
more lawn mowers.<br />
A) 0.0559 B) 0.1118<br />
C) 0.0505 D) 0.0252
Test the given claim. Use the P-value method or the<br />
traditional method as indicated. Identify the null<br />
hypothesis, alternative hypothesis, test statistic, critical<br />
value(s) or P-value, conclusion about the null<br />
hypothesis, and final conclusion that addresses the<br />
original claim.<br />
36) The mean resting pulse rate for men is 72<br />
beats per minute. A simple random sample of<br />
men who regularly work out at Mitch's Gym<br />
is obtained and their resting pulse rates (in<br />
beats per minute) are listed below. Use a 0.05<br />
significance level to test the claim that these<br />
sample pulse rates come from a population<br />
with a mean less than 72 beats per minute.<br />
Assume that the standard deviation of the<br />
resting pulse rates of all men who work out at<br />
Mitch's Gym is known to be 6.6 beats per<br />
minute. Use the traditional method of testing<br />
hypotheses.<br />
56 59 69 84 74 64 69<br />
70 66 80 59 71 76 63<br />
Assume that a simple random sample has been selected<br />
from a normally distributed population. Find the test<br />
statistic, P-value, critical value(s), and state the final<br />
conclusion.<br />
37) Test the claim that the mean lifetime of car<br />
engines of a particular type is greater than<br />
220,000 miles. Sample data are summarized<br />
as n = 23, x = 226,450 miles, and<br />
s = 11,500 miles. Use a significance level of<br />
α = 0.01.<br />
38) Test the claim that for the population of<br />
history exams, the mean score is 80. Sample<br />
data are summarized as n = 16, x = 84.5, and<br />
s = 11.2. Use a significance level of α = 0.01.<br />
Assume that a simple random sample has been selected<br />
from a normally distributed population and test the<br />
given claim. Use either the traditional method or<br />
P-value method as indicated. Identify the null and<br />
alternative hypotheses, test statistic, critical value(s) or<br />
P-value (or range of P-values) as appropriate, and state<br />
the final conclusion that addresses the original claim.<br />
39) Use a significance level of α = 0.05 to test the<br />
claim that µ = 32.6. The sample data consist of<br />
15 scores for which x = 39 and s = 7.8. Use the<br />
traditional method of testing hypotheses.<br />
6<br />
Assume that a simple random sample has been selected<br />
from a normally distributed population. Find the test<br />
statistic, P-value, critical value(s), and state the final<br />
conclusion.<br />
40) Test the claim that for the population of<br />
female college students, the mean weight is<br />
given by µ = 132 lb. Sample data are<br />
summarized as n = 20, x = 137 lb, and<br />
s = 14.2 lb. Use a significance level of α = 0.1.<br />
Assume that a simple random sample has been selected<br />
from a normally distributed population and test the<br />
given claim. Use either the traditional method or<br />
P-value method as indicated. Identify the null and<br />
alternative hypotheses, test statistic, critical value(s) or<br />
P-value (or range of P-values) as appropriate, and state<br />
the final conclusion that addresses the original claim.<br />
41) A large software company gives job<br />
applicants a test of programming ability and<br />
the mean for that test has been 160 in the<br />
past. Twenty-five job applicants are<br />
randomly selected from one large university<br />
and they produce a mean score and standard<br />
deviation of 183 and 12, respectively. Use a<br />
0.05 level of significance to test the claim that<br />
this sample comes from a population with a<br />
mean score greater than 160. Use the P-value<br />
method of testing hypotheses.<br />
42) A cereal company claims that the mean<br />
weight of the cereal in its packets is 14 oz.<br />
The weights (in ounces) of the cereal in a<br />
random sample of 8 of its cereal packets are<br />
listed below.<br />
14.6 13.8 14.1 13.7 14.0 14.4 13.6 14.2<br />
Test the claim at the 0.01 significance level.<br />
43) A light-bulb manufacturer advertises that the<br />
average life for its light bulbs is 900 hours. A<br />
random sample of 15 of its light bulbs<br />
resulted in the following lives in hours.<br />
995 590 510 539 739 917 571<br />
555<br />
916 728 664 693 708 887 849<br />
At the 10% significance level, test the claim<br />
that the sample is from a population with a<br />
mean life of 900 hours. Use the P-value<br />
method of testing hypotheses.
Find the critical value or values of χ2 based on the given<br />
information.<br />
44) H0: σ = 8.0<br />
n = 10<br />
α = 0.01<br />
A) 1.735, 23.589 B) 23.209<br />
C) 21.666 D) 2.088, 21.666<br />
45) H1: σ > 3.5<br />
n = 14<br />
α = 0.05<br />
A) 22.362 B) 23.685<br />
C) 24.736 D) 5.892<br />
46) H1: σ < 0.14<br />
n = 23<br />
α = 0.10<br />
A) 14.042 B) 30.813<br />
C) -30.813 D) 14.848<br />
47) H1: σ ≠ 9.3<br />
n = 28<br />
α = 0.05<br />
A) 14.573, 43.194<br />
B) 16.151, 40.113<br />
C) -40.113, 40.113<br />
D) -14.573, 14.573<br />
Use the traditional method to test the given hypothesis.<br />
Assume that the population is normally distributed and<br />
that the sample has been randomly selected.<br />
48) When 12 bolts are tested for hardness, their<br />
indexes have a standard deviation of 41.7.<br />
Test the claim that the standard deviation of<br />
the hardness indexes for all such bolts is<br />
greater than 30.0. Use a 0.025 level of<br />
significance.<br />
49) At the α = 0.05 significance level test the claim<br />
that a population has a standard deviation of<br />
20.3. A random sample of 18 people yields a<br />
standard deviation of 27.1.<br />
7<br />
50) With individual lines at the checkouts, a store<br />
manager finds that the standard deviation for<br />
the waiting times on Monday mornings is 5.7<br />
minutes. After switching to a single waiting<br />
line, he finds that for a random sample of 29<br />
customers, the waiting times have a standard<br />
deviation of 4.9 minutes. Use a 0.025<br />
significance level to test the claim that with a<br />
single line, waiting times vary less than with<br />
individual lines.<br />
51) Heights of men aged 25 to 34 have a standard<br />
deviation of 2.9. Use a 0.05 significance level<br />
to test the claim that the heights of women<br />
aged 25 to 34 have a different standard<br />
deviation. The heights (in inches) of 16<br />
randomly selected women aged 25 to 34 are<br />
listed below. Round the sample standard<br />
deviation to five decimal places.<br />
62.13 65.09 64.18 66.72 63.09<br />
61.15 67.50 64.65<br />
63.80 64.21 60.17 68.28 66.49<br />
62.10 65.73 64.72
Answer Key<br />
Testname: 227CH8P<br />
1) If the die were fair, the probability of obtaining 63 6's in 100 rolls would be extremely small. Therefore, by the rare<br />
event rule, we conclude that the claim that the die is fair is probably not correct.<br />
2) A<br />
3) A<br />
4) A<br />
5) A<br />
6) A<br />
7) H0: p = 0.53. H1: p ≠ 0.53. Test statistic: z = -1.60. P-value: p = 0.0548.<br />
Critical value: z = ±1.645. Fail to reject null hypothesis. There is not sufficient evidence to warrant rejection of the<br />
claim that the actual percentage is 53%.<br />
8) If the defective rate were really 4%, one could easily obtain 10 defective units among 200 computers by chance; this<br />
is not improbable. Therefore, by the rare event rule, we have no reason to reject the claim that the defective rate is<br />
4%.<br />
9) A<br />
10) A<br />
11) H0: p = 0.01. H1: p > 0.01. Test statistic: z = 4.92. P-value: p = 0.0001.<br />
Critical value: z = 2.33. Reject null hypothesis. There is sufficient evidence to warrant rejection of the claim that no<br />
more than 1% are defective. Note: Since the term "no more than" is used, the translation is p ≤ 0.01. Therefore, the<br />
competing hypothesis is p > 0.01.<br />
12) H0: p = 0.5. H1: p > 0.5. Test statistic: z = 0.99. P-value: p = 0.1611.<br />
Critical value: z = 2.33. Fail to reject null hypothesis. There is not sufficient evidence to support the claim that more<br />
than half of all those using the drug experience relief.<br />
13) A<br />
14) A<br />
15) A<br />
16) A<br />
17) A<br />
18) A<br />
19) A<br />
20) A<br />
21) A<br />
22) The claim is that the person is using his extra sensory powers to determine the suit of the card and that he correctly<br />
determines the suit more often than he would if he were guessing randomly. Even if he were just guessing<br />
randomly, he would have a reasonable chance of being correct 28 times out of a hundred; this is not improbable<br />
since there are four suits. Therefore, identifying the suit correctly 28 times out of 100 does not constitute strong<br />
evidence in favor of his claim.<br />
23) A<br />
24) A<br />
25) A<br />
26) A<br />
27) A<br />
28) H0: µ = 200; H1: µ < 200; Test statistic: z = -0.98. P-value: 0.1635. Fail to reject H0. There is not sufficient evidence<br />
to support the claim that the mean is less than 200 pounds.<br />
29) A<br />
30) A<br />
31) A<br />
32) A<br />
8
Answer Key<br />
Testname: 227CH8P<br />
33) H0: µ = 149 lb<br />
H1: µ ≠ 149 lb<br />
Test statistic: z = 0.91<br />
Critical-values: z = ± 2.575<br />
Do not reject H0; At the 1% significance level, there is not sufficient evidence to warrant rejection of the claim that<br />
these sample weights come from a population with a mean equal to 149 lb.<br />
34) A<br />
35) A<br />
36) H0: µ = 72 beats per minute<br />
H1: µ < 72 beats per minute<br />
Test statistic: z = -1.94<br />
Critical-value: z = -1.645<br />
Reject H0; At the 5% significance level, there is sufficient evidence to support the claim that .these sample pulse<br />
rates come from a population with a mean less than 72 beats per minute.<br />
37) α = 0.01<br />
Test statistic: t = 2.6898<br />
P-value: p = 0.0066<br />
Critical value: t = 2.508<br />
Because the test statistic, t > 2.508, we reject the null hypothesis. There is sufficient evidence to accept the claim that<br />
µ > 220,000 miles.<br />
38) α = 0.01<br />
Test statistic: t = 1.607<br />
P-value: p = 0.1289<br />
Critical values: t = ±2.947<br />
Because the test statistic, t < 2.947, we do not reject the null hypothesis. There is not sufficient evidence to warrant<br />
rejection of the claim that the mean score is 80.<br />
39) H 0 : µ = 32.6. H 1 : µ ≠ 32.6. Test statistic: t = 3.18. Critical values: t = ±2.145. Reject H 0 . There is sufficient evidence to<br />
warrant rejection of the claim that the mean is 32.6.<br />
40) α = 0.1<br />
Test statistic: t = 1.57<br />
P-value: p = 0.1318<br />
Critical values: t = ±1.729<br />
Because the test statistic, t < 1.729, we fail to reject the null hypothesis. There is not sufficient evidence to warrant<br />
rejection of the claim that µ = 132 lb.<br />
41) H 0 : µ = 160. H 1 : µ > 160. Test statistic: t = 9.583. P-value < 0.005. Reject H 0 . There is sufficient evidence to support<br />
the claim that the mean is greater than 160.<br />
42) H 0 : µ = 14 oz. H 1 : µ ≠ 14 oz. Test statistic: t = 0.408. Critical values: t = ±3.499. Fail to reject H0. There is not sufficient<br />
evidence to warrant rejection of the claim that the mean weight is 14 ounces.<br />
43) H 0 : µ = 900 hrs. H 1 : µ ≠ 900 hrs. Test statistic: t = -4.342. P-value < 0.01. Reject H0. There is sufficient evidence to<br />
warrant rejection of the claim that the sample is from a population with a mean life of 900 hours. The light bulbs do<br />
not appear to conform to the manufacturer's specifications.<br />
44) A<br />
45) A<br />
46) A<br />
47) A<br />
9
Answer Key<br />
Testname: 227CH8P<br />
48) Test statistic: χ2 = 21.253. Critical value: χ2 = 21.920. Fail to reject the null hypothesis. There is not sufficient evidence<br />
to support the claim that the standard deviation is greater than 30.0.<br />
49) Test statistic: χ2 = 30.297. Critical values: χ2 = 7.564, 30.191. Reject the null hypothesis. There is sufficient evidence to<br />
warrant rejection of the claim that the standard deviation of the population is equal to 20.3.<br />
50) Test statistic: χ2 = 20.692. Critical value: χ2 = 15.308. Fail to reject H0. There is not sufficient evidence to support the<br />
claim that with a single line waiting times have a smaller standard deviation.<br />
51) Test statistic: χ2 = 9.2597. Critical values: χ2 = 6.262, 27.488. Fail to reject H0. There is not sufficient evidence to<br />
support the claim that heights of women aged 25 to 34 have a standard deviation different from 2.9 in.<br />
10