

CMA (4)

Create successful ePaper yourself
Turn your PDF publications into a flip-book with our unique Google optimized e-Paper software.
Comparative Market Analysis<br />
Address: 20 Gordon Avenue, Milford, North Shore<br />
Prepared on: 08 March 2017<br />
This is a Comparative Market Analysis report for 20 Gordon Avenue, Milford, North Shore . This report provides an estimate of the<br />
most probable selling price of the subject property.<br />
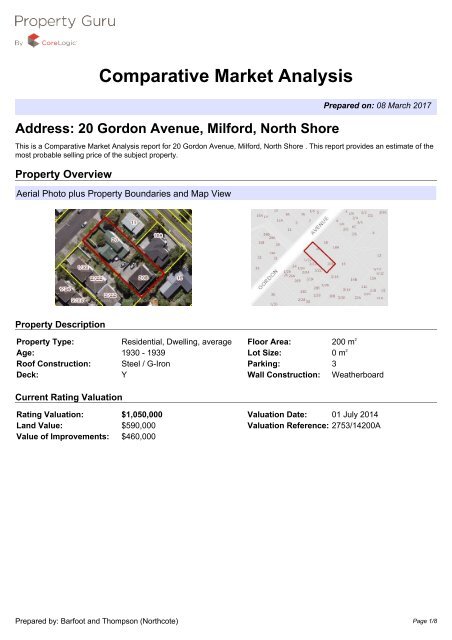
Property Overview<br />
Aerial Photo plus Property Boundaries and Map View<br />
Property Description<br />
Property Type: Residential, Dwelling, average Floor Area: 200 m 2<br />
Age: 1930 - 1939 Lot Size: 0 m 2<br />
Roof Construction: Steel / G-Iron Parking: 3<br />
Deck: Y Wall Construction: Weatherboard<br />
Current Rating Valuation<br />
Rating Valuation: $1,050,000 Valuation Date: 01 July 2014<br />
Land Value: $590,000 Valuation Reference: 2753/14200A<br />
Value of Improvements: $460,000<br />
Prepared by: Barfoot and Thompson (Northcote) Page 1/8
Address: 20 Gordon Avenue, Milford, North Shore<br />
Comparable Sales in the Area<br />
A requirement of the Real Estate Agents Act is to support the recommendation with an analysis of properties that have recently<br />
sold in the area. These properties are mainly selected on the basis of geographical proximity, size area and time of sale. As no two<br />
properties are exactly alike there maybe slight differences in the characteristics in the property selection shown in this section.<br />
Gross Sale Price Min: $1,130,000 Median: $1,405,432 Max: $1,968,000<br />
Rating Valuation Min: $960,000 Median: $1,005,000 Max: $1,150,000<br />
102 East Coast Road Forrest Hill North Shore<br />
Rating Valuations: $960,000<br />
Land Value: $740,000<br />
Improvements Value:<br />
$220,000<br />
Last Sale Price: $1,130,000<br />
Last Sale Date: 30-Jun-16<br />
Last Sale Price:<br />
Last Sale Price:<br />
Advertised Date:<br />
Floor Area: 200 m 2<br />
Land Area: n/a<br />
Building Age: 1980 - 1989<br />
Category: Residential,<br />
Dwelling, average<br />
Number of Bedrooms: 3-4 *<br />
Wall Material: Mixed Material<br />
Roof Material: Steel / G-Iron<br />
Deck:<br />
Parking Freestanding: 2<br />
Parking Main Roof: 0<br />
24 Knightsbridge Drive Forrest Hill North Shore<br />
Rating Valuations: $985,000<br />
Land Value: $750,000<br />
Improvements Value:<br />
$235,000<br />
Last Sale Price: $1,353,000<br />
Last Sale Date: 24-Mar-16<br />
Last Sale Price:<br />
Last Sale Price:<br />
Advertised Date: 02-Oct-13<br />
Floor Area: 190 m 2<br />
Land Area: 675 m 2<br />
Building Age: 1970 - 1979<br />
Category: Residential,<br />
Dwelling, average<br />
Number of Bedrooms: 4 *<br />
Wall Material: Fibre Cement<br />
Roof Material: Tile Profile<br />
Deck: Y<br />
Parking Freestanding: 2<br />
Parking Main Roof: 2<br />
140a Nile Road Milford North Shore<br />
Rating Valuations:<br />
$1,150,000<br />
Land Value: $650,000<br />
Improvements Value:<br />
$500,000<br />
Last Sale Price: $1,968,000<br />
Last Sale Date: 13-Sep-16<br />
Last Sale Price:<br />
Floor Area: 216 m 2<br />
Land Area: n/a<br />
Building Age: 1960 - 1969<br />
Category: Residential,<br />
Dwelling, average<br />
Number of Bedrooms: 3-5 *<br />
Wall Material: Brick<br />
Roof Material: Tile Profile<br />
Deck:<br />
Parking Freestanding: 1<br />
Parking Main Roof: 0<br />
Prepared by: Barfoot and Thompson (Northcote) Page 2/8
17a Rangitoto Terrace Milford North Shore<br />
Rating Valuations:<br />
$1,125,000<br />
Land Value: $650,000<br />
Improvements Value:<br />
$475,000<br />
Last Sale Price: $1,457,864<br />
Last Sale Date: 09-Mar-16<br />
Last Sale Price:<br />
Last Sale Price:<br />
Advertised Date: 21-Apr-16<br />
Floor Area: 190 m 2<br />
Land Area: 859 m 2<br />
Building Age: 1980 - 1989<br />
Category: Residential,<br />
Dwelling, superior<br />
Number of Bedrooms: 3 *<br />
Wall Material: Weatherboard<br />
Roof Material: Tile Profile<br />
Deck: Y<br />
Parking Freestanding: 2<br />
Parking Main Roof: 2<br />
37 Rangitoto Terrace Milford North Shore<br />
Rating Valuations: $960,000<br />
Land Value: $800,000<br />
Improvements Value:<br />
$160,000<br />
Last Sale Price: $1,268,000*<br />
Last Sale Date: 24-Feb-17*<br />
Last Sale Price: $1,268,000*<br />
Last Sale Price: $1,268,000*<br />
Advertised Date: 12-Jun-14<br />
Floor Area: 190 m 2<br />
Land Area: n/a<br />
Building Age: 1970 - 1979<br />
Category: Residential, OYO,<br />
average<br />
Number of Bedrooms: 3 *<br />
Wall Material: Brick<br />
Roof Material: Tile Profile<br />
Deck:<br />
Parking Freestanding: 2<br />
Parking Main Roof: 0<br />
22 Tobruk Crescent Milford North Shore<br />
Rating Valuations:<br />
$1,025,000<br />
Land Value: $600,000<br />
Improvements Value:<br />
$425,000<br />
Last Sale Price: $1,500,000<br />
Last Sale Date: 04-Apr-16<br />
Last Sale Price:<br />
Last Sale Price:<br />
Advertised Date: 30-Mar-16<br />
Floor Area: 210 m 2<br />
Land Area: n/a<br />
Building Age: 1980 - 1989<br />
Category: Residential,<br />
Dwelling, average<br />
Number of Bedrooms: 3 *<br />
Wall Material: Mixed Material<br />
Roof Material: Tile Profile<br />
Deck:<br />
Parking Freestanding: 2<br />
Parking Main Roof: 0<br />
Prepared by: Barfoot and Thompson (Northcote) Page 3/8
Address: 20 Gordon Avenue, Milford, North Shore<br />
Location of Comparable Sales<br />
The map shown above gives a spatial representation of the list of comparable sales. The blue house indicates the subject<br />
property, whereas the green houses show the location of the comparable sales around 20 Gordon Avenue, Milford, North Shore.<br />
The map also gives the location of nearby schools, parks, and other points of interest.<br />
Prepared by: Barfoot and Thompson (Northcote) Page 4/8
Historical Price Trends<br />
Trend analysis is the science of looking at past behaviour with the purpose of tryingto predict future events. House price<br />
movements are a product of many external influences such as the availability and cost of finance, job security and level of wages,<br />
the supply of property and the demand for it as influenced by local demographics.<br />
Residential Property One Year Average Selling Price - North Shore City<br />
This graph shows the actual monthly price movement of completed sales. Superimposed over this is a curved trend line. If the right<br />
side of the curve is trending upward this indicates a probable short term increase in value. In real terms this means that you might<br />
expect a property to sell towards the upper end of the indicated price range. Conversely if the right hand side of the curve is<br />
trending downward the opposite applies. You should note that short term changes are expected, however longer term trends<br />
should also be considered when selling.<br />
Residential Property Valuation to Sale Price Comparison - North Shore City<br />
This graph shows the average valuation versus the average sale price of properties over a twelve month period. The comparison<br />
shows the local authority's averages against the national averages. The dotted lines show the average current valuation for<br />
properties sold. The solid line shows the average sale price.<br />
Prepared by: Barfoot and Thompson (Northcote) Page 5/8
Residential Property Five Year Trend - North Shore City<br />
The Five Year Trend graph shows the change in the average sale price for properties within North Shore City over a five year<br />
period, shown in quarterly increments. This graph indicates a longer term view of the property market for the surrounding area and<br />
the potential capital gain over time. Because of the longer term view of the property market, the graph also helps remove some of<br />
the uncertainty around shorter term fluctuations.<br />
Residential Property Price Groups Over a Five Year Period - North Shore City<br />
This graph indicates where the subject property sits in relation to other properties nearby, using the sale price of properties over a<br />
five year period against the subject property's current valuation.<br />
There is usually a larger cluster of properties either to the left or centre of the graph indicating where the majority of property<br />
values lie in this location. If your property is in this cluster then a normal marketing approach is suggested (i.e. list with a price or<br />
price range). If the property is in this cluster it is also likely to face a greater amount of competition, therefore additional advertising<br />
budget should be considered in order to elevate the property above the group.<br />
If the property is outside the main cluster, it indicates that the property may have a rarity value in which case alternative marketing<br />
strategies could be considered.<br />
Prepared by: Barfoot and Thompson (Northcote) Page 6/8
Residential Property Sales Count - North Shore City<br />
The above graph indicates the number of recorded sales within the subject price range in a given period, and uses the settlement<br />
date of a property. Sale numbers for each period are compared over a two year time span.<br />
It should be fairly evident from the graph when the greatest number of sales take place. There are two possible interpretations of<br />
this: (a) the property is likely to face the greatest amount of competition over these periods, or (b) the largest number of<br />
transactions take place and therefore the property has the best chance of selling.<br />
It should be noted that many of the settlements will have been listed for sale and/or negotiated prior to the recorded settlement<br />
date.<br />
Prepared by: Barfoot and Thompson (Northcote) Page 7/8
Community Reports<br />
These reports offer demographic and statistical information on the relevant suburb or community for the subject property against<br />
national statistics. These reports will always be based on the most recent Census data available.<br />
Data not available.<br />
Data Currency<br />
Survey and Title Data 10 February 2017<br />
CoreLogic Address Data 03 March 2017<br />
Sales and Valuation Data 26 February 2017<br />
Some of the information provided in this report is sourced from third parties, and forms a guideline only. As a result CoreLogic NZ<br />
Ltd cannot and does not provide any warranties or assurances of any kind in relation to the accuracy of the information provided<br />
through this Report, the Site and Services. CoreLogic NZ Ltd will not be liable for any claims in relation to the content of this<br />
Report, the Site and this Service. The full terms and conditions for the use of the Reports, the Site and this Service are available at<br />
www.property-guru.co.nz.<br />
Prepared by: Barfoot and Thompson (Northcote) Page 8/8