

STICK SHIFT
Stick-Shift-Autonomous-Vehicles
Stick-Shift-Autonomous-Vehicles

You also want an ePaper? Increase the reach of your titles
YUMPU automatically turns print PDFs into web optimized ePapers that Google loves.
www.globalpolicysolutions.org<br />
Figure K shows the driving<br />
premium for specific groups. The<br />
groups with a driving premium<br />
are Hispanic men and black men.<br />
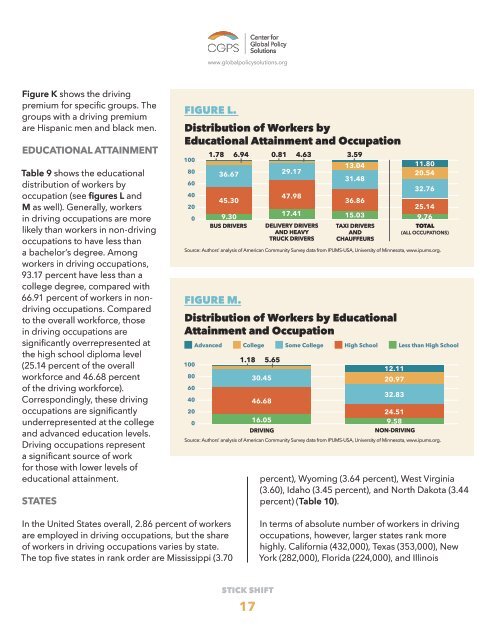
EDUCATIONAL ATTAINMENT<br />
Table 9 shows the educational<br />
distribution of workers by<br />
occupation (see figures L and<br />
M as well). Generally, workers<br />
in driving occupations are more<br />
likely than workers in non-driving<br />
occupations to have less than<br />
a bachelor’s degree. Among<br />
workers in driving occupations,<br />
93.17 percent have less than a<br />
college degree, compared with<br />
66.91 percent of workers in nondriving<br />
occupations. Compared<br />
to the overall workforce, those<br />
in driving occupations are<br />
significantly overrepresented at<br />
the high school diploma level<br />
(25.14 percent of the overall<br />
workforce and 46.68 percent<br />
of the driving workforce).<br />
Correspondingly, these driving<br />
occupations are significantly<br />
underrepresented at the college<br />
and advanced education levels.<br />
Driving occupations represent<br />
a significant source of work<br />
for those with lower levels of<br />
educational attainment.<br />
STATES<br />
FIGURE L.<br />
Distribution of Workers by<br />
Educational Attainment and Occupation<br />
100<br />
80<br />
60<br />
40<br />
20<br />
0<br />
1.78 6.94 0.81 4.63<br />
3.59<br />
36.67<br />
45.30<br />
9.30<br />
BUS DRIVERS<br />
29.17<br />
47.98<br />
17.41 15.03<br />
DELIVERY DRIVERS<br />
AND HEAVY<br />
TRUCK DRIVERS<br />
13.04<br />
31.48<br />
36.86<br />
TAXI DRIVERS<br />
AND<br />
CHAUFFEURS<br />
11.80<br />
20.54<br />
32.76<br />
25.14<br />
9.76<br />
TOTAL<br />
(ALL OCCUPATIONS)<br />
Source: Authors’ analysis of American Community Survey data from IPUMS-USA, University of Minnesota, www.ipums.org.<br />
FIGURE M.<br />
Distribution of Workers by Educational<br />
Attainment and Occupation<br />
100<br />
80<br />
60<br />
40<br />
20<br />
0<br />
Advanced College Some College High School Less than High School<br />
1.18 5.65<br />
12.11<br />
30.45 20.97<br />
46.68<br />
16.05<br />
DRIVING<br />
32.83<br />
24.51<br />
9.58<br />
NON-DRIVING<br />
Source: Authors’ analysis of American Community Survey data from IPUMS-USA, University of Minnesota, www.ipums.org.<br />
percent), Wyoming (3.64 percent), West Virginia<br />
(3.60), Idaho (3.45 percent), and North Dakota (3.44<br />
percent) (Table 10).<br />
In the United States overall, 2.86 percent of workers<br />
are employed in driving occupations, but the share<br />
of workers in driving occupations varies by state.<br />
The top five states in rank order are Mississippi (3.70<br />
In terms of absolute number of workers in driving<br />
occupations, however, larger states rank more<br />
highly. California (432,000), Texas (353,000), New<br />
York (282,000), Florida (224,000), and Illinois<br />
<strong>STICK</strong> <strong>SHIFT</strong><br />
17