

STICK SHIFT
Stick-Shift-Autonomous-Vehicles
Stick-Shift-Autonomous-Vehicles

Create successful ePaper yourself
Turn your PDF publications into a flip-book with our unique Google optimized e-Paper software.
www.globalpolicysolutions.org<br />
SECTION 1:<br />
DRIVING<br />
OCCUPATIONS:<br />
THE LABOR<br />
MARKET MOST<br />
LIKELY IMPACTED<br />
BY WIDESPREAD<br />
ADOPTION OF<br />
AUTONOMOUS-<br />
VEHICLE<br />
TECHNOLOGY<br />
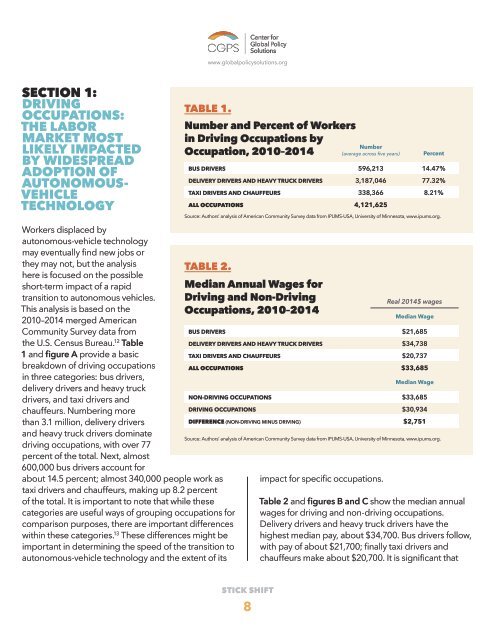
TABLE 1.<br />
Workers displaced by<br />
autonomous-vehicle technology<br />
may eventually find new jobs or<br />
they may not, but the analysis TABLE 2.<br />
here is focused on the possible<br />
short-term impact of a rapid<br />
transition to autonomous vehicles.<br />
This analysis is based on the<br />
2010–2014 merged American<br />
Community Survey data from<br />
the U.S. Census Bureau. 12 Table<br />
1 and figure A provide a basic<br />
breakdown of driving occupations<br />
in three categories: bus drivers,<br />
delivery drivers and heavy truck<br />
drivers, and taxi drivers and<br />
chauffeurs. Numbering more<br />
than 3.1 million, delivery drivers<br />
and heavy truck drivers dominate<br />
driving occupations, with over 77<br />
percent of the total. Next, almost<br />
600,000 bus drivers account for<br />
about 14.5 percent; almost 340,000 people work as<br />
taxi drivers and chauffeurs, making up 8.2 percent<br />
of the total. It is important to note that while these<br />
categories are useful ways of grouping occupations for<br />
comparison purposes, there are important differences<br />
within these categories. 13 These differences might be<br />
important in determining the speed of the transition to<br />
autonomous-vehicle technology and the extent of its<br />
Number and Percent of Workers<br />
in Driving Occupations by<br />
Occupation, 2010–2014<br />
Number<br />
(average across five years)<br />
impact for specific occupations.<br />
Percent<br />
BUS DRIVERS 596,213 14.47%<br />
DELIVERY DRIVERS AND HEAVY TRUCK DRIVERS 3,187,046 77.32%<br />
TAXI DRIVERS AND CHAUFFEURS 338,366 8.21%<br />
ALL OCCUPATIONS 4,121,625<br />
Source: Authors’ analysis of American Community Survey data from IPUMS-USA, University of Minnesota, www.ipums.org.<br />
Median Annual Wages for<br />
Driving and Non-Driving<br />
Occupations, 2010–2014<br />
Real 2014$ wages<br />
Median Wage<br />
BUS DRIVERS $21,685<br />
DELIVERY DRIVERS AND HEAVY TRUCK DRIVERS $34,738<br />
TAXI DRIVERS AND CHAUFFEURS $20,737<br />
ALL OCCUPATIONS $33,685<br />
Median Wage<br />
NON-DRIVING OCCUPATIONS $33,685<br />
DRIVING OCCUPATIONS $30,934<br />
DIFFERENCE (NON-DRIVING MINUS DRIVING) $2,751<br />
Source: Authors’ analysis of American Community Survey data from IPUMS-USA, University of Minnesota, www.ipums.org.<br />
Table 2 and figures B and C show the median annual<br />
wages for driving and non-driving occupations.<br />
Delivery drivers and heavy truck drivers have the<br />
highest median pay, about $34,700. Bus drivers follow,<br />
with pay of about $21,700; finally taxi drivers and<br />
chauffeurs make about $20,700. It is significant that<br />
<strong>STICK</strong> <strong>SHIFT</strong><br />
8