

STICK SHIFT
Stick-Shift-Autonomous-Vehicles
Stick-Shift-Autonomous-Vehicles

Create successful ePaper yourself
Turn your PDF publications into a flip-book with our unique Google optimized e-Paper software.
www.globalpolicysolutions.org<br />
occupations also have a poverty<br />
rate that is lower than the overall<br />
workforce (the overall poverty<br />
rate is 8.06 percent).<br />
This is further evidence that<br />
driving jobs, on the whole, are<br />
“good jobs.” While they may not<br />
be higher-paying jobs for every<br />
demographic, fewer drivers are<br />
in poverty.<br />
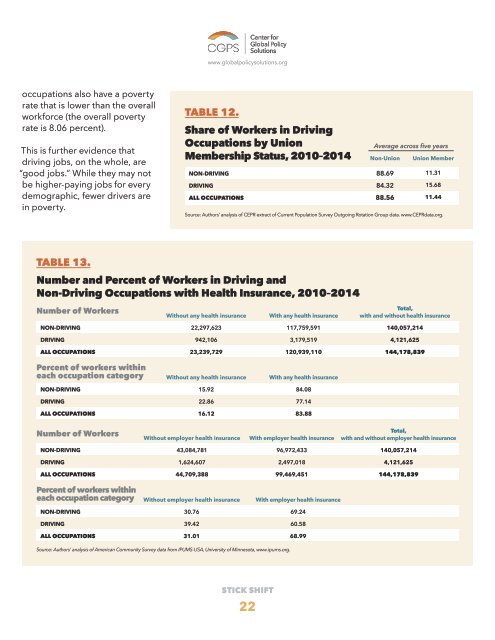
TABLE 12.<br />
Share of Workers in Driving<br />
Occupations by Union<br />
Average across five years<br />
Membership Status, 2010–2014 Non-Union Union Member<br />
NON-DRIVING 88.69 11.31<br />
DRIVING 84.32 15.68<br />
ALL OCCUPATIONS 88.56 11.44<br />
Source: Authors’ analysis of CEPR extract of Current Population Survey Outgoing Rotation Group data. www.CEPRdata.org.<br />
TABLE 13.<br />
Number and Percent of Workers in Driving and<br />
Non-Driving Occupations with Health Insurance, 2010–2014<br />
Number of Workers<br />
Without any health insurance<br />
With any health insurance<br />
Total,<br />
with and without health insurance<br />
NON-DRIVING 22,297,623 117,759,591 140,057,214<br />
DRIVING 942,106 3,179,519 4,121,625<br />
ALL OCCUPATIONS 23,239,729 120,939,110 144,178,839<br />
Percent of workers within<br />
each occupation category<br />
Without any health insurance<br />
With any health insurance<br />
NON-DRIVING 15.92 84.08<br />
DRIVING 22.86 77.14<br />
ALL OCCUPATIONS 16.12 83.88<br />
Number of Workers<br />
Without employer health insurance<br />
With employer health insurance<br />
Total,<br />
with and without employer health insurance<br />
NON-DRIVING 43,084,781 96,972,433 140,057,214<br />
DRIVING 1,624,607 2,497,018 4,121,625<br />
ALL OCCUPATIONS 44,709,388 99,469,451 144,178,839<br />
Percent of workers within<br />
each occupation category<br />
Without employer health insurance<br />
With employer health insurance<br />
NON-DRIVING 30.76 69.24<br />
DRIVING 39.42 60.58<br />
ALL OCCUPATIONS 31.01 68.99<br />
Source: Authors’ analysis of American Community Survey data from IPUMS-USA, University of Minnesota, www.ipums.org.<br />
<strong>STICK</strong> <strong>SHIFT</strong><br />
22