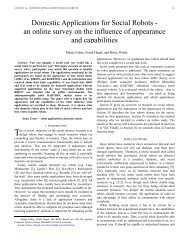
SALEM - Statistical AnaLysis of Elan files in Matlab
SALEM - Statistical AnaLysis of Elan files in Matlab
SALEM - Statistical AnaLysis of Elan files in Matlab

You also want an ePaper? Increase the reach of your titles
YUMPU automatically turns print PDFs into web optimized ePapers that Google loves.
<strong>SALEM</strong> - <strong>Statistical</strong> <strong>AnaLysis</strong> <strong>of</strong> <strong>Elan</strong> <strong>files</strong> <strong>in</strong> <strong>Matlab</strong><br />
Marc Hanheide 1 , Manja Lohse 2 , Angelika Dierker 2<br />
1 University <strong>of</strong> Birm<strong>in</strong>gham, School <strong>of</strong> Computer Science, B15 2TT, UK<br />
2 Bielefeld University, Technical Faculty, Universitätsstraße 25, 33615 Bielefeld, Germany<br />
E-mail: m.hanheide@cs.bham.ac.uk, mlohse@techfak.uni-bielefeld.de, adierker@techfak.uni-bielefeld.de<br />
Abstract<br />
This document proposes <strong>SALEM</strong> (<strong>Statistical</strong> <strong>AnaLysis</strong> <strong>of</strong> <strong>Elan</strong> <strong>files</strong> <strong>in</strong> <strong>Matlab</strong>) as a toolbox for the statistical analysis<br />
<strong>of</strong> data from human-mach<strong>in</strong>e <strong>in</strong>teraction that are annotated <strong>in</strong> <strong>Elan</strong>. The authors show how <strong>SALEM</strong> allows to analyze<br />
annotations quantitatively <strong>in</strong> an effective manner. The paper <strong>in</strong>troduces the position <strong>of</strong> <strong>SALEM</strong> <strong>in</strong> the data process<strong>in</strong>g<br />
cha<strong>in</strong>, its functionalities, and how it contributes to the evaluation process.<br />
1. Introduction<br />
Interaction studies with humans and <strong>in</strong>telligent systems<br />
are ga<strong>in</strong><strong>in</strong>g more and more attention with systems<br />
exhibit<strong>in</strong>g more advanced abilities. This is true <strong>in</strong><br />
various areas such as cognitive robotics, assistance,<br />
<strong>in</strong>teraction analysis and others more. In the <strong>in</strong>teraction <strong>of</strong><br />
systems and humans, a corpus must not only encode the<br />
behavior <strong>of</strong> the participat<strong>in</strong>g humans, but also the<br />
behavior <strong>of</strong> the <strong>in</strong>telligent system to facilitate a manifold<br />
analysis <strong>of</strong> more complex <strong>in</strong>teraction scenarios. Both<br />
need to be brought together <strong>in</strong> order to allow a real<br />
cross-discipl<strong>in</strong>ary analysis. Merg<strong>in</strong>g and temporally<br />
align<strong>in</strong>g the system-focused annotations with manual<br />
annotations that describe the humans’ behavior results <strong>in</strong><br />
a comprehensive and rich representation <strong>of</strong> the<br />
<strong>in</strong>teraction situation. With the help <strong>of</strong> these so-called<br />
systemic corpora we can (i) learn and study patterns <strong>of</strong><br />
deviation or failures <strong>in</strong> <strong>in</strong>teraction and (ii) identify<br />
correlations between system and human behaviors.<br />
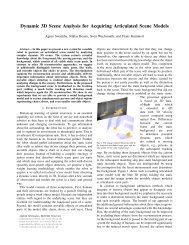
Figure 1 shows an exemplary process <strong>of</strong> creat<strong>in</strong>g a<br />
systemic corpus compris<strong>in</strong>g the record<strong>in</strong>g <strong>of</strong> data,<br />
<strong>in</strong>tegrat<strong>in</strong>g, and f<strong>in</strong>ally analyz<strong>in</strong>g it. The left side<br />
displays the data source. It <strong>in</strong>cludes audio and video data,<br />
as well as system log <strong>files</strong> from the <strong>in</strong>telligent system. In<br />
our work with multiple <strong>in</strong>telligent systems we use<br />
logg<strong>in</strong>g frameworks such as LOG4J 1 or LOG4CXX5 2 to<br />
generate the system log <strong>files</strong>. These frameworks natively<br />
support time-stamped events and can also set the type<br />
(usually correspond<strong>in</strong>g to a logg<strong>in</strong>g level) and the emitter<br />
(e.g., called “logger” <strong>in</strong> log4j). The content <strong>of</strong> these<br />
events is either unstructured text or structured text (if the<br />
developers agree on a cod<strong>in</strong>g scheme <strong>in</strong> advance). It<br />
would also be possible to <strong>in</strong>clude other data sources.<br />
However, s<strong>in</strong>ce our aim is to display these logg<strong>in</strong>g<br />
events as (time-stamped) annotations <strong>in</strong> <strong>Elan</strong>, all sources<br />
need to have an extent <strong>in</strong> time. In the next step <strong>of</strong> the<br />
process<strong>in</strong>g cha<strong>in</strong> all data are aligned and synchronized <strong>in</strong><br />
time. After transformation and synchronization all<br />
recorded data can be displayed and manually revised,<br />
1 http://logg<strong>in</strong>g.apache.org/log4j/<br />
2 http://logg<strong>in</strong>g.apache.org/log4cxx/<br />
e.g., <strong>in</strong> <strong>Elan</strong> 3 which furthermore allows to add manual<br />
annotations (Figure 1 [data display]). Alternatively, other<br />
XML-based annotation tools with more or less similar<br />
abilities could be used (e.g., Anvil 4 , Interact 5 ). With<br />
respect to manual annotations one important step is to<br />
check their correctness for later analysis (e.g., if a cod<strong>in</strong>g<br />
scheme is used, only codes that are def<strong>in</strong>ed <strong>in</strong> the<br />
scheme are allowed; the annotations do not conta<strong>in</strong><br />
misspell<strong>in</strong>gs). Once all the data are represented <strong>in</strong> one<br />
format (here <strong>in</strong> the format <strong>of</strong> the annotation tool) they<br />
can be analyzed automatically. This is where the<br />
<strong>SALEM</strong> (<strong>Statistical</strong> <strong>AnaLysis</strong> <strong>of</strong> <strong>Elan</strong> <strong>files</strong> <strong>in</strong> <strong>Matlab</strong>)<br />
toolbox comes <strong>in</strong>. In the follow<strong>in</strong>g, we will <strong>in</strong>troduce the<br />
basic idea beh<strong>in</strong>d the usage <strong>of</strong> <strong>SALEM</strong>, its<br />
functionalities, and advantages.<br />
2. Basic idea <strong>of</strong> <strong>SALEM</strong><br />
After conduct<strong>in</strong>g <strong>in</strong>teraction studies, every researcher<br />
encounters the question <strong>of</strong> how to analyze data<br />
efficiently and effectively. This question is strongly<br />
<strong>in</strong>fluenced by what and how data are recorded. As has<br />
been <strong>in</strong>troduced <strong>in</strong> Figure 1, we propose to collect the<br />
data <strong>in</strong> annotation tools like <strong>Elan</strong>, because with the help<br />
<strong>of</strong> these tools, multiple data sources can be <strong>in</strong>tegrated<br />
with manual annotations. The annotations are structured<br />
<strong>in</strong> multiple layers, so-called ‘tiers’. For example, <strong>in</strong><br />
human-robot <strong>in</strong>teraction (HRI) one tier may conta<strong>in</strong> the<br />
speech <strong>of</strong> the human that has been manually transcribed<br />
based on the video. Another tier may conta<strong>in</strong> what the<br />
3 http://www.lat-mpi.eu/tools/elan/<br />
4 http://www.anvil-s<strong>of</strong>tware.de/<br />
5 http://www.mangold-<strong>in</strong>ternational.com/en/products/<strong>in</strong>te<br />
ract.html<br />
Figure 1: Data process<strong>in</strong>g cha<strong>in</strong>
obot understood which has been extracted from the log<br />
<strong>files</strong>. This example shows that manual annotation might<br />
have to be <strong>in</strong>tegrated with data from automatic log <strong>files</strong>.<br />
The <strong>in</strong>tegration can easily be achieved with an XML<br />
format as used by <strong>Elan</strong> and other annotation tools such as<br />
Anvil. However, annotation tools usually only <strong>in</strong>clude<br />
limited functionalities for quantitative analysis. Thus, to<br />
analyze the data, one can go through the <strong>files</strong> manually<br />
or, alternatively, use the tools’ export options to acquire<br />
text or XML-based <strong>files</strong>. Thereafter, these <strong>files</strong> have to<br />
be imported <strong>in</strong> another s<strong>of</strong>tware for analysis (for<br />
example, <strong>Matlab</strong> 6 , SPSS 7 ). This approach is rather<br />
laborious because whenever a change is made to the<br />
annotation file, it has to be exported and imported to the<br />
analysis s<strong>of</strong>tware aga<strong>in</strong>. To work around this problem,<br />
the <strong>SALEM</strong> toolbox parses <strong>Elan</strong> <strong>files</strong> directly and <strong>of</strong>fers<br />
advanced and <strong>in</strong>-depth statistical analyses with <strong>Matlab</strong>.<br />
Thus, it closes the cycle <strong>of</strong> import<strong>in</strong>g automatic log <strong>files</strong><br />
<strong>in</strong>to the annotation tool, import<strong>in</strong>g the correspond<strong>in</strong>g<br />
video/audio streams <strong>in</strong>to the annotation tool, annotat<strong>in</strong>g<br />
manually, and analyz<strong>in</strong>g the data <strong>in</strong> an efficient way. In<br />
this process, one ma<strong>in</strong> advantage <strong>of</strong> the <strong>SALEM</strong> toolbox<br />
is that it allows compar<strong>in</strong>g annotations <strong>of</strong> different<br />
modalities, structural features <strong>of</strong> the <strong>in</strong>teraction, or<br />
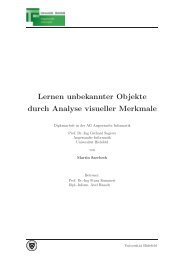
whatever has been annotated <strong>in</strong> the tiers. For example,<br />
the video can be used to manually annotate human<br />
speech which can then be compared to the speech that<br />
the robot understood because they are represented <strong>in</strong> one<br />
file that can be analyzed, <strong>in</strong> our case us<strong>in</strong>g <strong>Matlab</strong> (see<br />
Figure 2). Analyz<strong>in</strong>g the data with the <strong>SALEM</strong> toolbox<br />
does not only alleviate the analysis process, but also<br />
<strong>in</strong>creases the consistency <strong>of</strong> the analysis. This is because<br />
all evaluations are conducted us<strong>in</strong>g the statistical<br />
6 http://www.mathworks.com/products/matlab/<br />
7 http://www.spss.com/s<strong>of</strong>tware/statistics/<br />
Figure 2: Example <strong>of</strong> <strong>Elan</strong> display<br />
functions that are predef<strong>in</strong>ed by the toolbox, for example,<br />
a T-test will always be calculated <strong>in</strong> the same way based<br />
on the same formula.<br />
3. Functionalities <strong>of</strong> <strong>SALEM</strong><br />
Our proposed automatic statistical analysis <strong>of</strong> annotation<br />
<strong>files</strong> consists <strong>of</strong> a number <strong>of</strong> rout<strong>in</strong>es to compute<br />
statistics on the temporal distribution <strong>of</strong> specific<br />
annotations, their correlation to one another, and their<br />
comparison with regard to duration and dedicated values.<br />
A core concept <strong>of</strong> <strong>SALEM</strong> to allow a rich analysis is<br />
“slic<strong>in</strong>g”. It has been <strong>in</strong>troduced to facilitate temporal<br />
correlation between annotations <strong>of</strong> different tiers. The<br />
idea is that we can automatically select subsets <strong>of</strong><br />
annotations for the computation <strong>of</strong> the statistics based on<br />
synchrony or overlaps. Therefore, one tier is chosen as<br />
the master tier and the whole set <strong>of</strong> annotations is sliced<br />
accord<strong>in</strong>g to the existence <strong>of</strong> annotations <strong>in</strong> that master<br />
tier. We also support slic<strong>in</strong>g based on specific values <strong>of</strong><br />
the annotation <strong>in</strong> that master tier. Slic<strong>in</strong>g is based on the<br />
analysis <strong>of</strong> overlaps <strong>of</strong> the master tier annotations with<br />
annotations <strong>in</strong> all other tiers as illustrated <strong>in</strong> Figure 3. If,<br />
for <strong>in</strong>stance, one tier codes all time <strong>in</strong>tervals <strong>in</strong> which the<br />
robot was speak<strong>in</strong>g, slic<strong>in</strong>g allows to compute statistics<br />
only for those annotations that overlap with this<br />
‘speech_robot’ annotation.<br />
Built upon this general slic<strong>in</strong>g concept, <strong>SALEM</strong> to date<br />
has the follow<strong>in</strong>g functionalities which were developed<br />
based on requirements that arose dur<strong>in</strong>g the analysis <strong>of</strong><br />
two corpora <strong>of</strong> HRI data (Lohse, 2010; Lohse,<br />
submitted). Of course these functionalities are currently<br />
limited, however, new ones can be <strong>in</strong>tegrated <strong>in</strong> the<br />
toolbox if needed.
Pars<strong>in</strong>g, display<strong>in</strong>g structure <strong>of</strong> parsed <strong>files</strong>, and<br />
slic<strong>in</strong>g:<br />
• pars<strong>in</strong>g s<strong>in</strong>gle <strong>Elan</strong> <strong>files</strong> or a set <strong>of</strong> <strong>Elan</strong> <strong>files</strong> at once<br />
(which allows for the analysis <strong>of</strong> the data <strong>of</strong> s<strong>in</strong>gle<br />
users, groups <strong>of</strong> users, groups <strong>of</strong> trials that belong to<br />
certa<strong>in</strong> conditions, and all users <strong>of</strong> an experiment)<br />
• plot all annotations <strong>in</strong> the tiers<br />
• slice the <strong>files</strong> with respect to time (specify<strong>in</strong>g one or<br />
more beg<strong>in</strong>n<strong>in</strong>gs and end<strong>in</strong>gs <strong>of</strong> timeslots)<br />
• slice all annotations <strong>of</strong> a s<strong>in</strong>gle tier (for example, if<br />
the file is sliced on the basis <strong>of</strong> the tier<br />
‘speech_human’, then <strong>in</strong> all other tiers only the<br />
annotations that are overlapp<strong>in</strong>g with <strong>in</strong>stances <strong>of</strong><br />
human speech are taken <strong>in</strong>to account)<br />
• slice the <strong>files</strong> with respect to one or more values <strong>of</strong><br />
the annotations <strong>in</strong> a s<strong>in</strong>gle tier (for example, slice all<br />
annotations <strong>of</strong> eye gaze that have the value “1”<br />
which means that the user is look<strong>in</strong>g at the robot)<br />
• exam<strong>in</strong>e one specific annotation <strong>in</strong> a tier (for<br />
example, the 12 th annotation <strong>in</strong> the tier ‘gaze<br />
direction’)<br />
Analyz<strong>in</strong>g:<br />
• descriptive statistics for all data <strong>of</strong> the parsed <strong>files</strong> or<br />
the slices (for each tier):<br />
o count <strong>of</strong> annotations (number <strong>of</strong> occurrences)<br />
o m<strong>in</strong>imum duration <strong>of</strong> the annotations (<strong>in</strong><br />
seconds)<br />
o maximum duration <strong>of</strong> the annotations (<strong>in</strong><br />
seconds)<br />
o mean duration <strong>of</strong> all annotations (<strong>in</strong> seconds)<br />
o median <strong>of</strong> the durations (<strong>in</strong> seconds)<br />
o overall duration <strong>of</strong> all annotations (<strong>in</strong> seconds)<br />
o variance and standard deviation <strong>of</strong> the<br />
duration <strong>of</strong> all annotations<br />
o beg<strong>in</strong>n<strong>in</strong>g <strong>of</strong> first annotation (<strong>in</strong> seconds)<br />
o end <strong>of</strong> last annotation (<strong>in</strong> seconds)<br />
o overall duration <strong>of</strong> all annotations as a<br />
percentage <strong>of</strong> the time between the beg<strong>in</strong>n<strong>in</strong>g<br />
<strong>of</strong> the first annotation and the end <strong>of</strong> the last<br />
annotation<br />
• the descriptive statistics for slices additionally<br />
<strong>in</strong>clude for all tiers<br />
o count and percentage <strong>of</strong> time that the<br />
annotations <strong>in</strong> a tier overlap with the<br />
reference tier for four types <strong>of</strong> overlap: (a)<br />
the annotation extends the annotation <strong>in</strong> the<br />
reference tier (beg<strong>in</strong>s before the annotation<br />
and ends after the annotation <strong>in</strong> the reference<br />
tier), (b) the annotation is <strong>in</strong>cluded <strong>in</strong> the<br />
annotation <strong>in</strong> the reference tier (beg<strong>in</strong>s after<br />
the annotation <strong>in</strong> the reference tier and ends<br />
before the annotation <strong>in</strong> the reference tier), (c)<br />
the annotation beg<strong>in</strong>s before the annotation <strong>in</strong><br />
the reference tier beg<strong>in</strong>s and ends before it<br />
ends, (d) the annotation beg<strong>in</strong>s after the beg<strong>in</strong><br />
<strong>of</strong> the annotation <strong>in</strong> the reference tier and<br />
ends after the end <strong>of</strong> the annotation <strong>in</strong> the<br />
reference tier (see Figure 3)<br />
• statistics for the annotated values <strong>in</strong> a certa<strong>in</strong> tier:<br />
o duration <strong>of</strong> all annotations for all values<br />
o descriptive statistics for all values (see<br />
descriptive statistics for all tiers)<br />
o T-tests for the duration <strong>of</strong> the annotations and<br />
the duration <strong>of</strong> the overlap<br />
o predecessor transition matrix for all values <strong>in</strong><br />
the tier (percentages with which all values<br />
preceded all other values; for example,<br />
annotations with the value ‘1’ are preceded<br />
by annotations with the value ‘2’ <strong>in</strong> 62% <strong>of</strong><br />
the cases)<br />
o successor transition matrix for all values <strong>in</strong> the<br />
tier (percentages with which all values<br />
succeeded all other values; for example,<br />
annotations with the value ‘1’ are succeeded<br />
by annotations with the value ‘2’ <strong>in</strong> 36% <strong>of</strong><br />
the cases)<br />
Figure 3: Overlap types<br />
4. Conclusion<br />
In this paper, we presented a toolbox for the statistical<br />
analysis <strong>of</strong> systemic, and thus <strong>in</strong>herently multi-modal,<br />
corpora. It supports a quantitative analysis <strong>of</strong> <strong>in</strong>teraction<br />
corpora by merg<strong>in</strong>g automatically generated annotations<br />
with manual annotations and subsequently analyz<strong>in</strong>g<br />
them us<strong>in</strong>g functions provided by the <strong>SALEM</strong> toolbox.<br />
We successfully applied the proposed approach <strong>in</strong><br />
several user trials with <strong>in</strong>teractive robots. The universal<br />
concept <strong>of</strong> slic<strong>in</strong>g <strong>in</strong>troduced by <strong>SALEM</strong> allows to<br />
def<strong>in</strong>e subsets <strong>of</strong> annotations to compare different cases<br />
or situations and consequently facilitates the analysis <strong>in</strong> a<br />
context-aware manner. <strong>SALEM</strong> also eases the work flow<br />
by process<strong>in</strong>g the annotations directly without requir<strong>in</strong>g<br />
prior export which is <strong>of</strong>ten error-prone. Moreover, the<br />
toolbox is usable for people with little knowledge about<br />
<strong>Matlab</strong>. It saves them from learn<strong>in</strong>g s<strong>in</strong>gle commands for<br />
the statistical functions and speeds up the analysis. S<strong>in</strong>ce<br />
the same functions are used for all data, the toolbox<br />
supports a consistent analysis. <strong>SALEM</strong> is extendable if<br />
more statistical functions are needed or if it shall be used<br />
with other annotations tools which are based on XML.
The <strong>SALEM</strong> toolbox is available free <strong>of</strong> charge from:<br />
http://aiweb.techfak.uni-bielefeld.de/content/salem-statis<br />
tical-analysis-elan-annotation-us<strong>in</strong>g-matlab<br />
5. Acknowledgments<br />
This work has been supported by the Collaborative<br />
Research Centre 673 Alignment <strong>in</strong> Communication,<br />
founded by the German Research Foundation (DFG),<br />
and the European Community’s Seventh Framework<br />
Programme [FP7/2007- 2013] under grant agreement No.<br />
215181, CogX.<br />
6. References<br />
Lohse, M. (2010). Social, functional, and problem-<br />
related tasks <strong>in</strong> HRI - a comparative analysis <strong>of</strong> body<br />
orientation and gaze. 2nd AISB workshop on New<br />
Frontiers <strong>in</strong> Human-Robot Interaction. Leicester, UK.<br />
Lohse, M. (submitted). Investigat<strong>in</strong>g the <strong>in</strong>fluence <strong>of</strong><br />
situations and expectations on user behavior -<br />
empirical analyses <strong>in</strong> human-robot <strong>in</strong>teraction.<br />
Doctoral Thesis. Bielefeld University, Technical<br />
Faculty, Germany.