Global Lightweight Materials Market Analysis 2017-2023
The increasing demand and the growth rate for lightweight materials in the market is attributed to their increasing usage in end-use industries such as automotive, aerospace & defense, wind energy and others.
The increasing demand and the growth rate for lightweight materials in the market is attributed to their increasing usage in end-use industries such as automotive, aerospace & defense, wind energy and others.
You also want an ePaper? Increase the reach of your titles
YUMPU automatically turns print PDFs into web optimized ePapers that Google loves.
<strong>Global</strong> Quantum Dots <strong>Market</strong>, <strong>Analysis</strong> and Forecast:<br />
<strong>2017</strong>-2022;<strong>Global</strong> <strong>Lightweight</strong> <strong>Materials</strong> <strong>Market</strong><strong>Analysis</strong> and Forecast,<br />
<strong>2017</strong>-<strong>2023</strong><br />
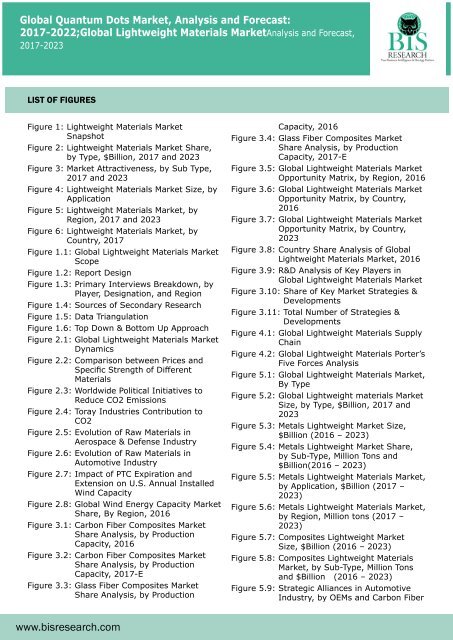
LIST OF FIGURES<br />
Figure 1: <strong>Lightweight</strong> <strong>Materials</strong> <strong>Market</strong><br />
Snapshot<br />
Figure 2: <strong>Lightweight</strong> <strong>Materials</strong> <strong>Market</strong> Share,<br />
by Type, $Billion, <strong>2017</strong> and <strong>2023</strong><br />
Figure 3: <strong>Market</strong> Attractiveness, by Sub Type,<br />
<strong>2017</strong> and <strong>2023</strong><br />
Figure 4: <strong>Lightweight</strong> <strong>Materials</strong> <strong>Market</strong> Size, by<br />
Application<br />
Figure 5: <strong>Lightweight</strong> <strong>Materials</strong> <strong>Market</strong>, by<br />
Region, <strong>2017</strong> and <strong>2023</strong><br />
Figure 6: <strong>Lightweight</strong> <strong>Materials</strong> <strong>Market</strong>, by<br />
Country, <strong>2017</strong><br />
Figure 1.1: <strong>Global</strong> <strong>Lightweight</strong> <strong>Materials</strong> <strong>Market</strong><br />
Scope<br />
Figure 1.2: Report Design<br />
Figure 1.3: Primary Interviews Breakdown, by<br />
Player, Designation, and Region<br />
Figure 1.4: Sources of Secondary Research<br />
Figure 1.5: Data Triangulation<br />
Figure 1.6: Top Down & Bottom Up Approach<br />
Figure 2.1: <strong>Global</strong> <strong>Lightweight</strong> <strong>Materials</strong> <strong>Market</strong><br />
Dynamics<br />
Figure 2.2: Comparison between Prices and<br />
Specific Strength of Different<br />
<strong>Materials</strong><br />
Figure 2.3: Worldwide Political Initiatives to<br />
Reduce CO2 Emissions<br />
Figure 2.4: Toray Industries Contribution to<br />
CO2<br />
Figure 2.5: Evolution of Raw <strong>Materials</strong> in<br />
Aerospace & Defense Industry<br />
Figure 2.6: Evolution of Raw <strong>Materials</strong> in<br />
Automotive Industry<br />
Figure 2.7: Impact of PTC Expiration and<br />
Extension on U.S. Annual Installed<br />
Wind Capacity<br />
Figure 2.8: <strong>Global</strong> Wind Energy Capacity <strong>Market</strong><br />
Share, By Region, 2016<br />
Figure 3.1: Carbon Fiber Composites <strong>Market</strong><br />
Share <strong>Analysis</strong>, by Production<br />
Capacity, 2016<br />
Figure 3.2: Carbon Fiber Composites <strong>Market</strong><br />
Share <strong>Analysis</strong>, by Production<br />
Capacity, <strong>2017</strong>-E<br />
Figure 3.3: Glass Fiber Composites <strong>Market</strong><br />
Share <strong>Analysis</strong>, by Production<br />
Capacity, 2016<br />
Figure 3.4: Glass Fiber Composites <strong>Market</strong><br />
Share <strong>Analysis</strong>, by Production<br />
Capacity, <strong>2017</strong>-E<br />
Figure 3.5: <strong>Global</strong> <strong>Lightweight</strong> <strong>Materials</strong> <strong>Market</strong><br />
Opportunity Matrix, by Region, 2016<br />
Figure 3.6: <strong>Global</strong> <strong>Lightweight</strong> <strong>Materials</strong> <strong>Market</strong><br />
Opportunity Matrix, by Country,<br />
2016<br />
Figure 3.7: <strong>Global</strong> <strong>Lightweight</strong> <strong>Materials</strong> <strong>Market</strong><br />
Opportunity Matrix, by Country,<br />
<strong>2023</strong><br />
Figure 3.8: Country Share <strong>Analysis</strong> of <strong>Global</strong><br />
<strong>Lightweight</strong> <strong>Materials</strong> <strong>Market</strong>, 2016<br />
Figure 3.9: R&D <strong>Analysis</strong> of Key Players in<br />
<strong>Global</strong> <strong>Lightweight</strong> <strong>Materials</strong> <strong>Market</strong><br />
Figure 3.10: Share of Key <strong>Market</strong> Strategies &<br />
Developments<br />
Figure 3.11: Total Number of Strategies &<br />
Developments<br />
Figure 4.1: <strong>Global</strong> <strong>Lightweight</strong> <strong>Materials</strong> Supply<br />
Chain<br />
Figure 4.2: <strong>Global</strong> <strong>Lightweight</strong> <strong>Materials</strong> Porter’s<br />
Five Forces <strong>Analysis</strong><br />
Figure 5.1: <strong>Global</strong> <strong>Lightweight</strong> <strong>Materials</strong> <strong>Market</strong>,<br />
By Type<br />
Figure 5.2: <strong>Global</strong> <strong>Lightweight</strong> materials <strong>Market</strong><br />
Size, by Type, $Billion, <strong>2017</strong> and<br />
<strong>2023</strong><br />
Figure 5.3: Metals <strong>Lightweight</strong> <strong>Market</strong> Size,<br />
$Billion (2016 – <strong>2023</strong>)<br />
Figure 5.4: Metals <strong>Lightweight</strong> <strong>Market</strong> Share,<br />
by Sub-Type, Million Tons and<br />
$Billion(2016 – <strong>2023</strong>)<br />
Figure 5.5: Metals <strong>Lightweight</strong> <strong>Materials</strong> <strong>Market</strong>,<br />
by Application, $Billion (<strong>2017</strong> –<br />
<strong>2023</strong>)<br />
Figure 5.6: Metals <strong>Lightweight</strong> <strong>Materials</strong> <strong>Market</strong>,<br />
by Region, Million tons (<strong>2017</strong> –<br />
<strong>2023</strong>)<br />
Figure 5.7: Composites <strong>Lightweight</strong> <strong>Market</strong><br />
Size, $Billion (2016 – <strong>2023</strong>)<br />
Figure 5.8: Composites <strong>Lightweight</strong> <strong>Materials</strong><br />
<strong>Market</strong>, by Sub-Type, Million Tons<br />
and $Billion (2016 – <strong>2023</strong>)<br />
Figure 5.9: Strategic Alliances in Automotive<br />
Industry, by OEMs and Carbon Fiber<br />
www.bisresearch.com


