Global Lightweight Materials Market Analysis 2017-2023
The increasing demand and the growth rate for lightweight materials in the market is attributed to their increasing usage in end-use industries such as automotive, aerospace & defense, wind energy and others.
The increasing demand and the growth rate for lightweight materials in the market is attributed to their increasing usage in end-use industries such as automotive, aerospace & defense, wind energy and others.

You also want an ePaper? Increase the reach of your titles
YUMPU automatically turns print PDFs into web optimized ePapers that Google loves.
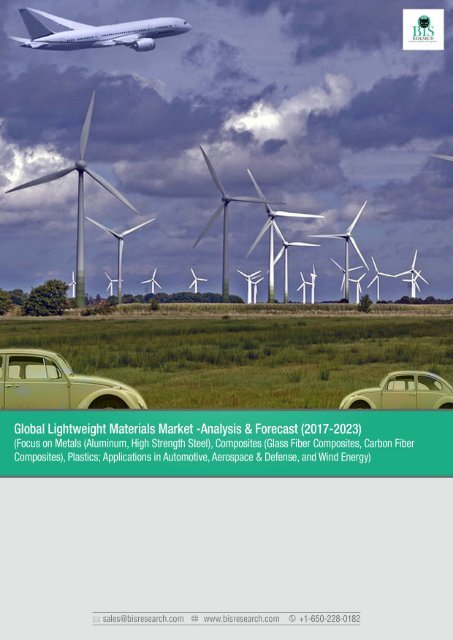
<strong>Global</strong> <strong>Lightweight</strong> <strong>Materials</strong> <strong>Market</strong><br />
<strong>Analysis</strong> and Forecast, <strong>2017</strong>-<strong>2023</strong><br />
The global lightweight materials market in terms of value is estimated to witness a growth<br />
at a CAGR of 7.0% between <strong>2017</strong> and <strong>2023</strong>. The increasing demand and the growth rate for<br />
lightweight materials in the market is attributed to their increasing usage in end-use industries<br />
such as automotive, aerospace & defense, wind energy and others.<br />
The rising demand is in line with the unique properties of lightweight materials. The properties<br />
such as low density, high strength and stiffness, high ductility, temperature and corrosion<br />
resistance make lightweight materials a preferred choice over conventional materials such as<br />
iron and steel. These properties help in weight reduction, leading to increased fuel economy,<br />
reduced CO2 emissions and longer life and low maintenance costs.<br />
The report is a compilation of various segmentations including market breakdown by lightweight<br />
material type, sub-type, end-use applications, and different geographical regions. It also<br />
includes sections on competitive insights and market dynamics. Herein, the revenue generated<br />
from lightweight materials is tracked to calculate the market size.<br />
While highlighting the key driving and restraining forces for this market, the report provides<br />
a comprehensive section of the application areas of the lightweight materials market. It also<br />
examines the role of the leading market players involved in this market. The report addresses<br />
the following key questions about the global lightweight materials market:<br />
• What is the global lightweight materials market size in terms of revenue from 2016-<br />
<strong>2023</strong>?<br />
• Which is the dominant type and sub-type by revenue in the lightweight materials market?<br />
• What is the revenue generated by the different lightweight materials by type and subtype<br />
in the lightweight materials market?<br />
• What is the revenue generated in the different applications of the lightweight materials<br />
market?<br />
• What are the different factors driving the market in the forecast period?<br />
• What are the major factors challenging the growth of global lightweight materials market?<br />
• What are opportunities for the global lightweight materials market?<br />
• What kind of new strategies are being adopted by existing market players to make a<br />
mark in the industry?<br />
• What is the revenue generated by the different geographic regions in the lightweight<br />
materials market?<br />
• Which region will lead to the global lightweight materials market by the end of the<br />
forecast period?<br />
• Which are the existing key market players that have made a mark in the lightweight<br />
materials market?<br />
The report has put special emphasis on the market share and size of metals, composites and<br />
www.bisresearch.com
<strong>Global</strong> <strong>Lightweight</strong> <strong>Materials</strong> <strong>Market</strong><br />
<strong>Analysis</strong> and Forecast, <strong>2017</strong>-<strong>2023</strong><br />
plastics, owing to their high share in the current and upcoming market of lightweight materials.<br />
The industry analysis have also been undertaken in order to examine the impact of various<br />
factors and understand the overall attractiveness of the industry.<br />
The most often used strategy for developing a better hold on to the market has been through<br />
agreements, collaborations, contracts, and partnerships, followed by new product launches. The<br />
company profile section includes highlights of significant information about the key companies<br />
involved, along with their financial summaries and key strategies & developmental activities<br />
of recent years. Some of the key players involved in this market are Toray Industries Inc.,<br />
Teijin Limited, Mitsubishi Rayon Co. Ltd., SGL Group, Hexcel Corporation, Cytec Industries,<br />
Owens Corning Corporation, Jushi Group Co. Ltd, Dead Sea Magnesium Ltd., Titanium Metals<br />
Corporation, Vsmpo-Avisma Corporation, ALCOA Inc., Novelis Inc., Arcelor Mittal S.A., Rio Tinto,<br />
China Hongqiao Group, Thyssenkrup AG, Lyondellbasell Industries N.V., Formosa Plastic, and<br />
SABIC.<br />
Metals dominated the lightweight materials market accounting for a market share of 60% by<br />
value in 2016. Asia Pacific generated the maximum amount of revenue in the year 2016 in<br />
the global lightweight materials market followed by North America and Europe. Additionally,<br />
APAC has the highest potential to grow in the forecast period due to the presence of emerging<br />
economies such as China and India.<br />
<strong>Global</strong> <strong>Lightweight</strong> <strong>Materials</strong> <strong>Market</strong><br />
<strong>Global</strong> <strong>Lightweight</strong> <strong>Materials</strong> <strong>Market</strong>: US$ Billion<br />
<strong>Global</strong> <strong>Lightweight</strong> <strong>Materials</strong> <strong>Market</strong>: Million Tons<br />
Leading Players<br />
• Alcoa Inc.<br />
• Arcelor Mittal S.A.<br />
XX<br />
• China Hongqiao Group<br />
XX<br />
• Formosa Plastics Corporation<br />
XX<br />
XX<br />
CAGR<br />
XX%<br />
• Mitsubishi Rayon Co. Ltd.<br />
• Novelis Inc.<br />
• Jushi Fiber Glass Co. Ltd.<br />
XX<br />
XX<br />
CAGR<br />
XX%<br />
• Owens Corning Corporation<br />
• Rio Tinto Group<br />
• SGL Group<br />
• Toray Industries Inc.<br />
• Trinseo S.A.<br />
2016 <strong>2017</strong> <strong>2023</strong><br />
2016 <strong>2017</strong> <strong>2023</strong><br />
Secondary research, expert interviews, and BIS Research <strong>Analysis</strong><br />
www.bisresearch.com
<strong>Global</strong> <strong>Lightweight</strong> <strong>Materials</strong> <strong>Market</strong><br />
<strong>Analysis</strong> and Forecast, <strong>2017</strong>-<strong>2023</strong><br />
CURRENT MARKET<br />
INFORMATION<br />
INFLUENCING<br />
FACTORS<br />
MARKET SIZE<br />
SUPPLY CHAIN<br />
ANALYSIS<br />
COMPETITOR<br />
ANALYSIS<br />
MARKET SHARE<br />
REGIONAL<br />
ANALYSIS<br />
GOVERNMENT<br />
REGULATIONS<br />
PLAYER SHARE<br />
ANALYSIS<br />
COMPANY<br />
DEVELOPMENTS<br />
COMPETITIVE<br />
LANDSCAPE<br />
RESEARCH &<br />
DEVELOPMENT<br />
ANALYSIS<br />
MARKET DRIVERS<br />
MARKET<br />
OPPORTUNITIES<br />
INDUSTRY<br />
TRENDS<br />
MARKET<br />
RESTRAINTS<br />
MARKET<br />
CHALLENGES<br />
GEOGRAPHIC USAGE<br />
PATTERN<br />
AGREEMENTS,<br />
CONTRACTS<br />
COLLABORATIONS,<br />
JOINT VENTURES,<br />
& PARTNERSHIPS:<br />
More than 50 deals<br />
in the last FOUR years<br />
PARAMETERS FOR MARKET ESTIMATION<br />
By Material Type<br />
By Application<br />
By Region<br />
• Metals<br />
o Aluminum<br />
o High Strength<br />
Steel<br />
• Composites<br />
o Carbon fibers<br />
o Glass fibers<br />
• Plastics<br />
• Automotive<br />
• Aerospace &<br />
Defense<br />
• Wind Energy<br />
• Others<br />
• North America<br />
• Europe<br />
• Asia-Pacific<br />
• Middle East &<br />
Africa<br />
• South America<br />
www.bisresearch.com
<strong>Global</strong> <strong>Lightweight</strong> <strong>Materials</strong> <strong>Market</strong><br />
<strong>Analysis</strong> and Forecast, <strong>2017</strong>-<strong>2023</strong><br />
TABLE OF CONTENTS<br />
Executive Summary<br />
1 Research Scope and Methodology<br />
1.1 Report Scope<br />
1.2 <strong>Global</strong> <strong>Lightweight</strong> <strong>Materials</strong> <strong>Market</strong><br />
Research Methodology<br />
1.2.1 Assumptions and Limitations<br />
1.2.2 Primary Research<br />
1.2.3 Secondary Research<br />
1.2.4 Data Triangulation<br />
1.2.5 Data Analysing & <strong>Market</strong> Estimation<br />
2 <strong>Market</strong> Dynamics<br />
2.1 Introduction<br />
2.2 <strong>Market</strong> Drivers<br />
2.2.1 Superior Properties<br />
2.2.2 Stringent Regulations<br />
2.2.3 Increasing Material Innovation and<br />
Demand in the End-Use Industries<br />
2.3 <strong>Market</strong> Restraints<br />
2.3.1 High Cost of <strong>Lightweight</strong> <strong>Materials</strong> and<br />
Technological Advancements<br />
2.3.2 Uncertainty in Production Tax Credit<br />
(PTC)<br />
2.4 <strong>Market</strong> Opportunities<br />
2.4.1 Growing Demand of Composites in<br />
New <strong>Lightweight</strong> Applications<br />
2.4.2 Rapid Growth in Wind Energy<br />
Installations<br />
2.4.3 Growing demand in Emerging<br />
Economies<br />
3 Competitive Insights<br />
3.1 Player Share <strong>Analysis</strong><br />
3.1.1 Product Segment Share, by Company,<br />
2016 & <strong>2017</strong><br />
3.1.1.1 Carbon Fiber Composites <strong>Market</strong><br />
Share, 2016<br />
3.1.1.2Carbon Fiber Composites <strong>Market</strong><br />
Share, <strong>2017</strong>-Estimated<br />
3.1.1.3 Glass Fiber Composites <strong>Market</strong><br />
Share, 2016<br />
3.1.1.4Glass Fiber Composites <strong>Market</strong><br />
Share, <strong>2017</strong>-Estimated<br />
3.1.1.5 Aluminum Competitive <strong>Analysis</strong>,<br />
2016<br />
3.2 Opportunity Matrix <strong>Analysis</strong><br />
3.3 Country Share <strong>Analysis</strong><br />
3.4 R & D <strong>Analysis</strong> of Key <strong>Market</strong> Players<br />
3.5 Key Strategies and Developments<br />
3.5.1 Agreements, Collaborations, Contracts,<br />
Joint Venture, & Partnerships<br />
3.5.2 Business Expansions<br />
3.5.3 New Product Launches &<br />
Developments<br />
3.5.4 Mergers & Acquisitions<br />
3.5.5 Others<br />
4 Industry <strong>Analysis</strong><br />
4.1 Supply Chain <strong>Analysis</strong><br />
4.2 Porter’s Five Forces <strong>Analysis</strong><br />
4.2.1 Threat of New Entrants<br />
4.2.2 Threat of Substitutes<br />
4.2.3 Bargaining Power of Buyers<br />
4.2.4 Bargaining Power of Suppliers<br />
4.2.5 Intensity of Competitive Rivalry<br />
4.3 Future Trends and Developments in<br />
<strong>Lightweight</strong> materials <strong>Market</strong><br />
5 <strong>Global</strong> <strong>Lightweight</strong> <strong>Materials</strong> <strong>Market</strong>, by Type<br />
5.1 Assumptions for <strong>Analysis</strong> and Forecast of<br />
the <strong>Global</strong> <strong>Lightweight</strong> <strong>Materials</strong> <strong>Market</strong><br />
5.2 Introduction<br />
5.2.1 Metals<br />
5.2.1.1 <strong>Lightweight</strong> Metals <strong>Market</strong>, by<br />
Sub-Type<br />
5.2.1.1.1 Aluminium<br />
5.2.1.1.2 High Strength Steel<br />
5.2.1.1.3 Magnesium<br />
5.2.1.1.4 Titanium<br />
5.2.1.1.5 Beryllium<br />
5.2.1.2 <strong>Lightweight</strong> Metals <strong>Market</strong>, by<br />
Application<br />
5.2.1.3 <strong>Lightweight</strong> Metals <strong>Market</strong>, by<br />
Region<br />
5.2.2 Composites<br />
5.2.2.1 <strong>Lightweight</strong> Composites <strong>Market</strong>,<br />
by Sub-Type<br />
5.2.2.1.1 Glass Fibers<br />
5.2.2.1.2 Carbon Fibers<br />
5.2.2.2 <strong>Lightweight</strong> Composites <strong>Market</strong>,<br />
by Application<br />
5.2.2.3 <strong>Lightweight</strong> Composites <strong>Market</strong>,<br />
by Region<br />
www.bisresearch.com
<strong>Global</strong> <strong>Lightweight</strong> <strong>Materials</strong> <strong>Market</strong><br />
<strong>Analysis</strong> and Forecast, <strong>2017</strong>-<strong>2023</strong><br />
TABLE OF CONTENTS<br />
5.2.3 Plastics<br />
5.2.3.1 <strong>Lightweight</strong> Plastics <strong>Market</strong>, by<br />
Application<br />
5.2.3.2 <strong>Lightweight</strong> Plastics <strong>Market</strong>, by<br />
Region<br />
6 <strong>Global</strong> <strong>Lightweight</strong> <strong>Materials</strong> <strong>Market</strong>, by End-Use<br />
Industry<br />
6.1.1 Automotive<br />
6.1.1.1 Powertrain<br />
6.1.1.2 Structural<br />
6.1.1.3 Interior<br />
6.1.1.4 Exterior<br />
6.1.2 Aerospace & Defense<br />
6.1.3 Wind Energy<br />
6.1.4 Others<br />
7 <strong>Global</strong> <strong>Lightweight</strong> <strong>Materials</strong> <strong>Market</strong>, by Region<br />
7.1 Introduction<br />
7.1.1 Asia-Pacific<br />
7.1.1.1 <strong>Lightweight</strong> <strong>Materials</strong> <strong>Market</strong>, by<br />
Type<br />
7.1.1.2 <strong>Lightweight</strong> <strong>Materials</strong> <strong>Market</strong>, by<br />
Country<br />
7.1.1.3 China<br />
7.1.1.3.1 <strong>Lightweight</strong> <strong>Materials</strong><br />
<strong>Market</strong>, by Type<br />
7.1.1.4 Japan<br />
7.1.1.4.1 <strong>Lightweight</strong> <strong>Materials</strong><br />
<strong>Market</strong>, by Type<br />
7.1.1.5 South Korea<br />
7.1.1.5.1 <strong>Lightweight</strong> <strong>Materials</strong><br />
<strong>Market</strong>, by Type<br />
7.1.1.6 India<br />
7.1.1.6.1 <strong>Lightweight</strong> <strong>Materials</strong><br />
<strong>Market</strong>, by Type<br />
7.1.1.7 Rest of Asia-Pacific<br />
7.1.1.7.1 <strong>Lightweight</strong> <strong>Materials</strong><br />
<strong>Market</strong>, by Type<br />
7.1.2 North America<br />
7.1.2.1 <strong>Lightweight</strong> <strong>Materials</strong> <strong>Market</strong>, by<br />
Type<br />
7.1.2.2 <strong>Lightweight</strong> <strong>Materials</strong> <strong>Market</strong>, by<br />
Country<br />
7.1.2.3 The United States<br />
7.1.2.3.1 <strong>Lightweight</strong> <strong>Materials</strong><br />
<strong>Market</strong>, by Type<br />
7.1.2.4 Canada<br />
7.1.2.4.1 <strong>Lightweight</strong> <strong>Materials</strong><br />
<strong>Market</strong>, by Type<br />
7.1.2.5 Mexico<br />
7.1.2.5.1 <strong>Lightweight</strong> <strong>Materials</strong><br />
<strong>Market</strong>, by Type<br />
7.1.3 Europe<br />
7.1.3.1 <strong>Lightweight</strong> <strong>Materials</strong> <strong>Market</strong>, by<br />
Type<br />
7.1.3.2 <strong>Lightweight</strong> <strong>Materials</strong> <strong>Market</strong>, by<br />
Country<br />
7.1.3.3 Germany<br />
7.1.3.3.1 <strong>Lightweight</strong> <strong>Materials</strong><br />
<strong>Market</strong>, by Type<br />
7.1.3.4 The United Kingdom<br />
7.1.3.4.1 <strong>Lightweight</strong> <strong>Materials</strong><br />
<strong>Market</strong>, by Type<br />
7.1.3.5 France<br />
7.1.3.5.1 <strong>Lightweight</strong> <strong>Materials</strong><br />
<strong>Market</strong>, by Type<br />
7.1.3.6 Italy<br />
7.1.3.6.1 <strong>Lightweight</strong> <strong>Materials</strong><br />
<strong>Market</strong>, by Type<br />
7.1.3.7 Rest of Europe<br />
7.1.3.7.1 <strong>Lightweight</strong> <strong>Materials</strong><br />
<strong>Market</strong>, by Type<br />
7.1.4 Middle East & Africa<br />
7.1.4.1 <strong>Lightweight</strong> <strong>Materials</strong> <strong>Market</strong>, by<br />
Type<br />
7.1.5 South America<br />
7.1.5.1 <strong>Lightweight</strong> <strong>Materials</strong> <strong>Market</strong>, by<br />
Type<br />
8 Company Profiles<br />
8.1 Introduction<br />
8.2 Alcoa Corporation<br />
8.2.1 Company Overview<br />
8.2.2 Financials<br />
8.2.3 Financial Summary<br />
8.2.4 SWOT <strong>Analysis</strong><br />
8.3 Arcelor Mittal S.A.<br />
8.3.1 Company Overview<br />
8.3.2 Product Portfolio<br />
8.3.3 Financials<br />
8.3.3.1 Financial Summary<br />
8.3.4 SWOT <strong>Analysis</strong><br />
8.4 Bayer A.G.<br />
www.bisresearch.com
<strong>Global</strong> <strong>Lightweight</strong> <strong>Materials</strong> <strong>Market</strong><br />
<strong>Analysis</strong> and Forecast, <strong>2017</strong>-<strong>2023</strong><br />
TABLE OF CONTENTS<br />
8.4.1 Company Overview<br />
8.4.2 Financials<br />
8.4.2.1 Financial Summary<br />
8.4.3 SWOT <strong>Analysis</strong><br />
8.5 China Hongqiao Group Limited<br />
8.5.1 Company Overview<br />
8.5.2 Financials<br />
8.5.2.1 Financial Summary<br />
8.5.3 SWOT <strong>Analysis</strong><br />
8.6 Cytec Solvay Group<br />
8.6.1 Company Overview<br />
8.6.2 Financials<br />
8.6.2.1 Financial Summary<br />
8.6.3 SWOT <strong>Analysis</strong><br />
8.7 Dead Sea Magnesium Ltd.<br />
8.7.1 Company Overview<br />
8.7.2 About the Company<br />
8.8 Exxon Mobil Corporation<br />
8.8.1 Company Overview<br />
8.8.2 Financials<br />
8.8.2.1 Financial Summary<br />
8.8.3 SWOT <strong>Analysis</strong><br />
8.9 E. I. Du Pont de Nemours and Company<br />
8.9.1 Company Overview<br />
8.9.2 Product Portfolio<br />
8.9.3 Financials<br />
8.9.3.1 Financial Summary<br />
8.9.4 SWOT <strong>Analysis</strong><br />
8.10 Formosa Plastic Corporation<br />
8.10.1 Company Overview<br />
8.10.2 Product Portfolio<br />
8.10.3 Financials<br />
8.10.3.1 Financial Summary<br />
8.10.4 SWOT <strong>Analysis</strong><br />
8.11 Hexcel Corporation<br />
8.11.1 Company Overview<br />
8.11.2 Product Portfolio<br />
8.11.3 Financials<br />
8.11.3.1 Financial Summary<br />
8.11.4 SWOT <strong>Analysis</strong><br />
8.12 LyondellBasell Industries N.V.<br />
8.12.1 Company Overview<br />
8.12.2 Financials<br />
8.12.2.1 Financial Summary<br />
8.12.3 SWOT <strong>Analysis</strong><br />
8.13 Mitsubishi Rayon Co. Ltd.<br />
8.13.1 Company Overview<br />
8.13.2 Product Portfolio<br />
8.13.3 Financials<br />
8.13.3.1 Financial Summary<br />
8.13.4 SWOT <strong>Analysis</strong><br />
8.14 Novelis Inc.<br />
8.14.1 Company Overview<br />
8.14.2 Financials<br />
8.14.2.1 Financial Summary<br />
8.14.3 SWOT <strong>Analysis</strong><br />
8.15 Owens Corning Corporation<br />
8.15.1 Company Overview<br />
8.15.2 Product Portfolio<br />
8.15.3 Financials<br />
8.15.3.1 Financial Summary<br />
8.15.4 SWOT <strong>Analysis</strong><br />
8.16 PPG Industries Inc.<br />
8.16.1 Company Overview<br />
8.16.2 Product Portfolio<br />
8.16.3 Financials<br />
8.16.3.1 Financial Summary<br />
8.16.4 SWOT <strong>Analysis</strong><br />
8.17 Rio Tinto Group<br />
8.17.1 Company Overview<br />
8.17.2 Product Portfolio<br />
8.17.3 Financials<br />
8.17.3.1 Financial Summary<br />
8.17.4 SWOT <strong>Analysis</strong><br />
8.18 Saudi Basic Industries Corporation<br />
8.18.1 Company Overview<br />
8.18.2 Product Portfolio<br />
8.18.3 Financials<br />
8.18.3.1 Financial Summary<br />
8.18.4 SWOT <strong>Analysis</strong><br />
8.19 Sekisui Jushi Corporation<br />
8.19.1 Company Overview<br />
8.19.2 Product Portfolio<br />
8.19.3 Financials<br />
8.19.3.1 Financial Summary<br />
8.19.4 SWOT <strong>Analysis</strong><br />
www.bisresearch.com
<strong>Global</strong> <strong>Lightweight</strong> <strong>Materials</strong> <strong>Market</strong><br />
<strong>Analysis</strong> and Forecast, <strong>2017</strong>-<strong>2023</strong><br />
TABLE OF CONTENTS<br />
8.20 SGL Group<br />
8.20.1 Company Overview<br />
8.20.2 Product Portfolio<br />
8.20.3 Financials<br />
8.20.3.1 Financial Summary<br />
8.20.4 SWOT <strong>Analysis</strong><br />
8.21 Teijin Limited<br />
8.21.1 Company Overview<br />
8.21.2 Product Portfolio<br />
8.21.3 Financials<br />
8.21.3.1 Financial Summary<br />
8.21.4 SWOT <strong>Analysis</strong><br />
8.22 ThyssenKrupp A.G.<br />
8.22.1 Company Overview<br />
8.22.2 Product Portfolio<br />
8.22.3 Financials<br />
8.22.3.1 Financial Summary<br />
8.22.4 SWOT <strong>Analysis</strong><br />
8.23 Titanium Metals Corporation<br />
8.23.1 Company Overview<br />
8.23.2 About the Company<br />
8.24 Toray Industries Inc.<br />
8.24.1 Company Overview<br />
8.24.2 Product Portfolio<br />
8.24.3 Financials<br />
8.24.3.1 Financial Summary<br />
8.24.4 SWOT <strong>Analysis</strong><br />
8.25 Trinseo S.A.<br />
8.25.1 Company Overview<br />
8.25.2 FINANCIALS<br />
8.25.2.1 Financial Summary<br />
8.25.3 SWOT <strong>Analysis</strong><br />
8.26 U.S. Magnesium LLC<br />
8.26.1 Company Overview<br />
8.26.2 About the Company<br />
8.27 United States Steel Corporation<br />
8.27.1 Company Overview<br />
8.27.2 Financials<br />
8.27.2.1 Financial Summary<br />
8.27.3 SWOT <strong>Analysis</strong><br />
8.28 VerkhneSaldinskoye Metallurgicheskoye<br />
Proizvodstvennoye Ob’yedineniye-<br />
AVIatsionnyye Spetsial’nyye MAterialy<br />
or Aviation Special <strong>Materials</strong> (VSMPO-<br />
AVISMA) CORPORATION<br />
8.28.1 Company Overview<br />
8.28.2 Financials<br />
8.28.2.1 Financial Summary<br />
8.28.3 SWOT <strong>Analysis</strong><br />
www.bisresearch.com
<strong>Global</strong> <strong>Lightweight</strong> <strong>Materials</strong> <strong>Market</strong><br />
<strong>Analysis</strong> and Forecast, <strong>2017</strong>-<strong>2023</strong><br />
LIST OF TABLE<br />
Table 1: <strong>Market</strong> Snapshot: <strong>Global</strong> <strong>Lightweight</strong><br />
<strong>Materials</strong> <strong>Market</strong><br />
Table 2.1: Overview of the <strong>Lightweight</strong> <strong>Materials</strong><br />
and their Applications<br />
Table 3.1: Aluminium Competitive <strong>Analysis</strong>, by<br />
Production Capacity, 2016<br />
Table 3.2: Agreements, Contracts,<br />
Collaborations, Joint Ventures, &<br />
Partnerships<br />
Table 3.3: Key Business Expansion Activities<br />
Table 3.4: Key Product Launches<br />
Table 3.5: Key Mergers & Acquisitions<br />
Table 3.6: Other Developments<br />
Table 4.1: Comparison between <strong>Lightweight</strong><br />
<strong>Materials</strong> w.r.t. Mild Steel<br />
Table 5.1: Comparison of <strong>Lightweight</strong> <strong>Materials</strong><br />
with Steel<br />
Table 5.2: <strong>Global</strong> <strong>Lightweight</strong> materials <strong>Market</strong>,<br />
by Type, Million tons (2016 – <strong>2023</strong>)<br />
Table 5.3: <strong>Global</strong> <strong>Lightweight</strong> <strong>Materials</strong> <strong>Market</strong>,<br />
by Type, $Billion (2016 – <strong>2023</strong>)<br />
Table 5.4: <strong>Global</strong> <strong>Lightweight</strong> Metals <strong>Market</strong>, by<br />
Sub-Type, Million Tons (2016 – <strong>2023</strong>)<br />
Table 5.5: <strong>Global</strong> <strong>Lightweight</strong> Metals <strong>Market</strong>, by<br />
Sub-Type, $Billion (2016 – <strong>2023</strong>)<br />
Table 5.6: Different Types of Aluminum Alloys<br />
used in the Aircraft Manufacturing<br />
Table 5.6: Metals <strong>Lightweight</strong> <strong>Materials</strong> <strong>Market</strong>,<br />
by Application, Million Tons (2016 –<br />
<strong>2023</strong>)<br />
Table 5.7: Metals <strong>Lightweight</strong> <strong>Materials</strong> <strong>Market</strong>,<br />
by Application (by value), $Billion<br />
(2016 – <strong>2023</strong>)<br />
Table 5.8: Metals <strong>Lightweight</strong> <strong>Materials</strong> <strong>Market</strong>,<br />
by Region, Million tons (2016 –<br />
<strong>2023</strong>)<br />
Table 5.9: Metals <strong>Lightweight</strong> <strong>Materials</strong> <strong>Market</strong>,<br />
by Region, $Billion (2016 – <strong>2023</strong>)<br />
Table 5.10: Composites <strong>Lightweight</strong> <strong>Materials</strong><br />
<strong>Market</strong>, by Sub-Type, Million Tons<br />
(2016 – <strong>2023</strong>)<br />
Table 5.11: Composites <strong>Lightweight</strong> <strong>Materials</strong><br />
<strong>Market</strong>, by Sub-Type, $Billion (2016<br />
– <strong>2023</strong>)<br />
Table 5.12: Different Kind of Modulus of Carbon<br />
Fiber (2016 – <strong>2023</strong>)<br />
Table 5.13: Composites <strong>Lightweight</strong> <strong>Materials</strong><br />
<strong>Market</strong>, by Application, Million Tons<br />
(2016 – <strong>2023</strong>)<br />
Table 5.13: Composites <strong>Lightweight</strong> <strong>Materials</strong><br />
<strong>Market</strong>, by Application, $Billion<br />
(2016 – <strong>2023</strong>)<br />
Table 5.14: Composites <strong>Lightweight</strong> <strong>Materials</strong><br />
<strong>Market</strong>, by Region, Million Tons<br />
(2016 – <strong>2023</strong>)<br />
Table 5.15: Composites <strong>Lightweight</strong> <strong>Materials</strong><br />
<strong>Market</strong>, by Region, $Billionn(2016 –<br />
<strong>2023</strong>)<br />
Table 5.16: Different Types of Plastics in<br />
<strong>Lightweight</strong> <strong>Materials</strong> <strong>Market</strong><br />
Table 5.17: Plastics <strong>Lightweight</strong> <strong>Materials</strong><br />
<strong>Market</strong>, by Application, Million Tons<br />
(2016 – <strong>2023</strong>)<br />
Table 5.18: Plastics <strong>Lightweight</strong> <strong>Materials</strong><br />
<strong>Market</strong>, by Application, $Billion<br />
(2016 – <strong>2023</strong>)<br />
Table 5.19: Plastics <strong>Lightweight</strong> <strong>Materials</strong><br />
<strong>Market</strong>, by Region, Million Tons<br />
(2016 – <strong>2023</strong>)<br />
Table 5.20: Plastics <strong>Lightweight</strong> <strong>Materials</strong><br />
<strong>Market</strong>, by Region, $Billion (2016 –<br />
<strong>2023</strong>)<br />
Table 6.1: Application Overview of <strong>Lightweight</strong><br />
<strong>Materials</strong>, by End-Use Industry<br />
Table 6.2: <strong>Global</strong> <strong>Lightweight</strong> <strong>Materials</strong> <strong>Market</strong>,<br />
by Application, Million tons (2016 –<br />
<strong>2023</strong>)<br />
Table 6.3: <strong>Global</strong> <strong>Lightweight</strong> <strong>Materials</strong> <strong>Market</strong>,<br />
by Application, $Billion (2016 –<br />
<strong>2023</strong>)<br />
Table 6.4: Automotive <strong>Lightweight</strong> <strong>Materials</strong><br />
<strong>Market</strong>, by Type, Million tons (2016 –<br />
<strong>2023</strong>)<br />
Table 6.5: Automotive <strong>Lightweight</strong> <strong>Materials</strong><br />
<strong>Market</strong>, by Type, $Billion (2016 –<br />
<strong>2023</strong>)<br />
Table 6.6: Some of the Major Players involved<br />
in Manufacturing Composite based<br />
Automotive Parts<br />
Table 6.7: Volume of carbon Fiber used in the<br />
Aircraft<br />
Table 6.8: Aerospace & Defense <strong>Lightweight</strong><br />
<strong>Materials</strong> <strong>Market</strong>, by Type, Million<br />
www.bisresearch.com
<strong>Global</strong> <strong>Lightweight</strong> <strong>Materials</strong> <strong>Market</strong><br />
<strong>Analysis</strong> and Forecast, <strong>2017</strong>-<strong>2023</strong><br />
LIST OF TABLE<br />
tons (2016 – <strong>2023</strong>)<br />
Table 6.9: Aerospace & Defense <strong>Lightweight</strong><br />
<strong>Materials</strong> <strong>Market</strong>, by Type, $Billion<br />
(2016 – <strong>2023</strong>)<br />
Table 6.10: <strong>Lightweight</strong> <strong>Materials</strong> used by the<br />
Wind Turbine Manufacturers<br />
Table 6.11: Cumulative Wind Energy<br />
Installations/Wind Power capacity,<br />
MW 2011-2016<br />
Table 6.12: Wind Energy <strong>Lightweight</strong> <strong>Materials</strong><br />
<strong>Market</strong>, by Type, Million tons (2016<br />
– <strong>2023</strong>)<br />
Table 6.13: Wind Energy <strong>Lightweight</strong> <strong>Materials</strong><br />
<strong>Market</strong>, by Type, $Billion (2016 –<br />
<strong>2023</strong>)<br />
Table 6.14: Others <strong>Lightweight</strong> <strong>Materials</strong><br />
<strong>Market</strong>, by type, Million tons (2016<br />
– <strong>2023</strong>)<br />
Table 6.15: Other <strong>Lightweight</strong> <strong>Materials</strong> <strong>Market</strong>,<br />
by Type, $Billion (2016 – <strong>2023</strong>)<br />
Table 7.1: <strong>Global</strong> <strong>Lightweight</strong> <strong>Materials</strong> <strong>Market</strong><br />
by Region, by Volume, Million Tons<br />
(2016 – <strong>2023</strong>)<br />
Table 7.2: <strong>Global</strong> <strong>Lightweight</strong> <strong>Materials</strong> <strong>Market</strong><br />
by Region, by Value, $Billion (2016 –<br />
<strong>2023</strong>)<br />
Table 7.3: Asia-Pacific <strong>Lightweight</strong> <strong>Materials</strong><br />
<strong>Market</strong>, by Type, Million Tons (2016<br />
– <strong>2023</strong>)<br />
Table 7.4: Asia-Pacific <strong>Lightweight</strong> <strong>Materials</strong><br />
<strong>Market</strong>, by Type, $Billion (2016 –<br />
<strong>2023</strong>)<br />
Table 7.5: Asia-Pacific <strong>Lightweight</strong> <strong>Materials</strong><br />
<strong>Market</strong> by Country, Million Tons<br />
(2016 – <strong>2023</strong>)<br />
Table 7.6: Asia-Pacific <strong>Lightweight</strong> <strong>Materials</strong><br />
<strong>Market</strong> by Country, $Billion (2016 –<br />
<strong>2023</strong>)<br />
Table 7.7: China: <strong>Lightweight</strong> <strong>Materials</strong> <strong>Market</strong>,<br />
by Type, Million Tons (2016 – <strong>2023</strong>)<br />
Table 7.8: China: <strong>Lightweight</strong> <strong>Materials</strong> <strong>Market</strong>,<br />
by Type, $Billion (2016 – <strong>2023</strong>)<br />
Table 7.9: Japan: <strong>Lightweight</strong> <strong>Materials</strong> <strong>Market</strong>,<br />
by Type, Million Tons (2016 – <strong>2023</strong>)<br />
Table 7.10: Japan: <strong>Lightweight</strong> <strong>Materials</strong><br />
<strong>Market</strong>, by Type, $Billion (2016 –<br />
<strong>2023</strong>)<br />
Table 7.11: South Korea: <strong>Lightweight</strong> <strong>Materials</strong><br />
<strong>Market</strong>, by Type, Million Tons (2016<br />
– <strong>2023</strong>)<br />
Table 7.12: South Korea: <strong>Lightweight</strong> <strong>Materials</strong><br />
<strong>Market</strong>, by Type, $Billion (2016 –<br />
<strong>2023</strong>)<br />
Table 7.13: India: <strong>Lightweight</strong> <strong>Materials</strong> <strong>Market</strong>,<br />
by Type, Million Tons (2016 – <strong>2023</strong>)<br />
Table 7.14: India: <strong>Lightweight</strong> <strong>Materials</strong> <strong>Market</strong>,<br />
by Type, $Billion (2016 – <strong>2023</strong>)<br />
Table 7.15: Rest of Asia-Pacific: <strong>Lightweight</strong><br />
<strong>Materials</strong> <strong>Market</strong>, by Type, Million<br />
Tons (2016 – <strong>2023</strong>)<br />
Table 7.16: Rest of Asia-Pacific: <strong>Lightweight</strong><br />
<strong>Materials</strong> <strong>Market</strong>, by Type, $Billion<br />
(2016 – <strong>2023</strong>)<br />
Table 7.17: North America <strong>Lightweight</strong> <strong>Materials</strong><br />
<strong>Market</strong>, by Type, Million Tons (2016<br />
– <strong>2023</strong>)<br />
Table 7.18: North America <strong>Lightweight</strong> <strong>Materials</strong><br />
<strong>Market</strong>, by Type, $Billion (2016 –<br />
<strong>2023</strong>)<br />
Table 7.19: North America <strong>Lightweight</strong> <strong>Materials</strong><br />
<strong>Market</strong> by Country, Million Tons<br />
(2016 – <strong>2023</strong>)<br />
Table 7.20: North America <strong>Lightweight</strong> <strong>Materials</strong><br />
<strong>Market</strong> by Country, $Billion (2016 –<br />
<strong>2023</strong>)<br />
Table 7.21: U.S. <strong>Lightweight</strong> <strong>Materials</strong> <strong>Market</strong>,<br />
by Type, Million Tons (2016 – <strong>2023</strong>)<br />
Table 7.22: U.S. <strong>Lightweight</strong> <strong>Materials</strong> <strong>Market</strong>,<br />
by Type, $Billion (2016 – <strong>2023</strong>)<br />
Table 7.23: Canada <strong>Lightweight</strong> <strong>Materials</strong><br />
<strong>Market</strong>, by Type, Million Tons (2016<br />
– <strong>2023</strong>)<br />
Table 7.24: Canada: <strong>Lightweight</strong> <strong>Materials</strong><br />
<strong>Market</strong>, by Type, $Billion (2016 –<br />
<strong>2023</strong>)<br />
Table 7.25: Mexico <strong>Lightweight</strong> <strong>Materials</strong><br />
<strong>Market</strong>, by Type, Million Tons (2016<br />
– <strong>2023</strong>)<br />
Table 7.26: Mexico <strong>Lightweight</strong> <strong>Materials</strong><br />
<strong>Market</strong>, by Type, $Billion (2016 –<br />
<strong>2023</strong>)<br />
Table 7.27: Europe <strong>Lightweight</strong> <strong>Materials</strong><br />
<strong>Market</strong>, by Type, Million Tons (2016<br />
– <strong>2023</strong>)<br />
www.bisresearch.com
<strong>Global</strong> <strong>Lightweight</strong> <strong>Materials</strong> <strong>Market</strong><br />
<strong>Analysis</strong> and Forecast, <strong>2017</strong>-<strong>2023</strong><br />
LIST OF TABLE<br />
Table 7.28: Europe <strong>Lightweight</strong> <strong>Materials</strong><br />
<strong>Market</strong>, by Type, $Billion (2016 –<br />
<strong>2023</strong>)<br />
Table 7.29: Europe <strong>Lightweight</strong> <strong>Materials</strong><br />
<strong>Market</strong> by Country, Million Tons<br />
(2016 – <strong>2023</strong>)<br />
Table 7.30: Europe <strong>Lightweight</strong> <strong>Materials</strong> <strong>Market</strong><br />
by Country, $Billion (2016 – <strong>2023</strong>)<br />
Table 7.31: Germany: <strong>Lightweight</strong> <strong>Materials</strong><br />
<strong>Market</strong>, by Type, Million Tons (2016<br />
– <strong>2023</strong>)<br />
Table 7.32: Germany: <strong>Lightweight</strong> <strong>Materials</strong><br />
<strong>Market</strong>, by Type, $Billion (2016 –<br />
<strong>2023</strong>)<br />
Table 7.33: UK: <strong>Lightweight</strong> <strong>Materials</strong> <strong>Market</strong>,<br />
by Type, Million Tons (2016 – <strong>2023</strong>)<br />
Table 7.34: UK: <strong>Lightweight</strong> <strong>Materials</strong> <strong>Market</strong>,<br />
by Type, $Billion (2016 – <strong>2023</strong>)<br />
Table 7.35: France: <strong>Lightweight</strong> <strong>Materials</strong><br />
<strong>Market</strong>, by Type, Million Tons (2016<br />
– <strong>2023</strong>)<br />
Table 7.36: France: <strong>Lightweight</strong> <strong>Materials</strong><br />
<strong>Market</strong>, by Type, $Billion (2016 –<br />
<strong>2023</strong>)<br />
Table 7.37: Italy: <strong>Lightweight</strong> <strong>Materials</strong> <strong>Market</strong>,<br />
by Type, Million Tons (2016 – <strong>2023</strong>)<br />
Table 7.38: Italy: <strong>Lightweight</strong> <strong>Materials</strong> <strong>Market</strong>,<br />
by Type, $Billion (2016 – <strong>2023</strong>)<br />
Table 7.39: ROE: <strong>Lightweight</strong> <strong>Materials</strong> <strong>Market</strong>,<br />
by Type, Million Tons (2016 – <strong>2023</strong>)<br />
Table 7.40: ROE: <strong>Lightweight</strong> <strong>Materials</strong> <strong>Market</strong>,<br />
by Type, $Billion (2016 – <strong>2023</strong>)<br />
Table 7.41: ME&A <strong>Lightweight</strong> <strong>Materials</strong> <strong>Market</strong>,<br />
by Type, Million Tons (2016 – <strong>2023</strong>)<br />
Table 7.42: ME&A <strong>Lightweight</strong> <strong>Materials</strong> <strong>Market</strong>,<br />
by Type, $Billion (2016 – <strong>2023</strong>)<br />
Table 7.43: South America <strong>Lightweight</strong><br />
<strong>Materials</strong> <strong>Market</strong>, by Type, Million<br />
Tons (2016 – <strong>2023</strong>)<br />
Table 7.44: South America <strong>Lightweight</strong><br />
<strong>Materials</strong> <strong>Market</strong>, by Type, $Billion<br />
(2016 – <strong>2023</strong>)<br />
www.bisresearch.com
<strong>Global</strong> Quantum Dots <strong>Market</strong>, <strong>Analysis</strong> and Forecast:<br />
<strong>2017</strong>-2022;<strong>Global</strong> <strong>Lightweight</strong> <strong>Materials</strong> <strong>Market</strong><strong>Analysis</strong> and Forecast,<br />
<strong>2017</strong>-<strong>2023</strong><br />
LIST OF FIGURES<br />
Figure 1: <strong>Lightweight</strong> <strong>Materials</strong> <strong>Market</strong><br />
Snapshot<br />
Figure 2: <strong>Lightweight</strong> <strong>Materials</strong> <strong>Market</strong> Share,<br />
by Type, $Billion, <strong>2017</strong> and <strong>2023</strong><br />
Figure 3: <strong>Market</strong> Attractiveness, by Sub Type,<br />
<strong>2017</strong> and <strong>2023</strong><br />
Figure 4: <strong>Lightweight</strong> <strong>Materials</strong> <strong>Market</strong> Size, by<br />
Application<br />
Figure 5: <strong>Lightweight</strong> <strong>Materials</strong> <strong>Market</strong>, by<br />
Region, <strong>2017</strong> and <strong>2023</strong><br />
Figure 6: <strong>Lightweight</strong> <strong>Materials</strong> <strong>Market</strong>, by<br />
Country, <strong>2017</strong><br />
Figure 1.1: <strong>Global</strong> <strong>Lightweight</strong> <strong>Materials</strong> <strong>Market</strong><br />
Scope<br />
Figure 1.2: Report Design<br />
Figure 1.3: Primary Interviews Breakdown, by<br />
Player, Designation, and Region<br />
Figure 1.4: Sources of Secondary Research<br />
Figure 1.5: Data Triangulation<br />
Figure 1.6: Top Down & Bottom Up Approach<br />
Figure 2.1: <strong>Global</strong> <strong>Lightweight</strong> <strong>Materials</strong> <strong>Market</strong><br />
Dynamics<br />
Figure 2.2: Comparison between Prices and<br />
Specific Strength of Different<br />
<strong>Materials</strong><br />
Figure 2.3: Worldwide Political Initiatives to<br />
Reduce CO2 Emissions<br />
Figure 2.4: Toray Industries Contribution to<br />
CO2<br />
Figure 2.5: Evolution of Raw <strong>Materials</strong> in<br />
Aerospace & Defense Industry<br />
Figure 2.6: Evolution of Raw <strong>Materials</strong> in<br />
Automotive Industry<br />
Figure 2.7: Impact of PTC Expiration and<br />
Extension on U.S. Annual Installed<br />
Wind Capacity<br />
Figure 2.8: <strong>Global</strong> Wind Energy Capacity <strong>Market</strong><br />
Share, By Region, 2016<br />
Figure 3.1: Carbon Fiber Composites <strong>Market</strong><br />
Share <strong>Analysis</strong>, by Production<br />
Capacity, 2016<br />
Figure 3.2: Carbon Fiber Composites <strong>Market</strong><br />
Share <strong>Analysis</strong>, by Production<br />
Capacity, <strong>2017</strong>-E<br />
Figure 3.3: Glass Fiber Composites <strong>Market</strong><br />
Share <strong>Analysis</strong>, by Production<br />
Capacity, 2016<br />
Figure 3.4: Glass Fiber Composites <strong>Market</strong><br />
Share <strong>Analysis</strong>, by Production<br />
Capacity, <strong>2017</strong>-E<br />
Figure 3.5: <strong>Global</strong> <strong>Lightweight</strong> <strong>Materials</strong> <strong>Market</strong><br />
Opportunity Matrix, by Region, 2016<br />
Figure 3.6: <strong>Global</strong> <strong>Lightweight</strong> <strong>Materials</strong> <strong>Market</strong><br />
Opportunity Matrix, by Country,<br />
2016<br />
Figure 3.7: <strong>Global</strong> <strong>Lightweight</strong> <strong>Materials</strong> <strong>Market</strong><br />
Opportunity Matrix, by Country,<br />
<strong>2023</strong><br />
Figure 3.8: Country Share <strong>Analysis</strong> of <strong>Global</strong><br />
<strong>Lightweight</strong> <strong>Materials</strong> <strong>Market</strong>, 2016<br />
Figure 3.9: R&D <strong>Analysis</strong> of Key Players in<br />
<strong>Global</strong> <strong>Lightweight</strong> <strong>Materials</strong> <strong>Market</strong><br />
Figure 3.10: Share of Key <strong>Market</strong> Strategies &<br />
Developments<br />
Figure 3.11: Total Number of Strategies &<br />
Developments<br />
Figure 4.1: <strong>Global</strong> <strong>Lightweight</strong> <strong>Materials</strong> Supply<br />
Chain<br />
Figure 4.2: <strong>Global</strong> <strong>Lightweight</strong> <strong>Materials</strong> Porter’s<br />
Five Forces <strong>Analysis</strong><br />
Figure 5.1: <strong>Global</strong> <strong>Lightweight</strong> <strong>Materials</strong> <strong>Market</strong>,<br />
By Type<br />
Figure 5.2: <strong>Global</strong> <strong>Lightweight</strong> materials <strong>Market</strong><br />
Size, by Type, $Billion, <strong>2017</strong> and<br />
<strong>2023</strong><br />
Figure 5.3: Metals <strong>Lightweight</strong> <strong>Market</strong> Size,<br />
$Billion (2016 – <strong>2023</strong>)<br />
Figure 5.4: Metals <strong>Lightweight</strong> <strong>Market</strong> Share,<br />
by Sub-Type, Million Tons and<br />
$Billion(2016 – <strong>2023</strong>)<br />
Figure 5.5: Metals <strong>Lightweight</strong> <strong>Materials</strong> <strong>Market</strong>,<br />
by Application, $Billion (<strong>2017</strong> –<br />
<strong>2023</strong>)<br />
Figure 5.6: Metals <strong>Lightweight</strong> <strong>Materials</strong> <strong>Market</strong>,<br />
by Region, Million tons (<strong>2017</strong> –<br />
<strong>2023</strong>)<br />
Figure 5.7: Composites <strong>Lightweight</strong> <strong>Market</strong><br />
Size, $Billion (2016 – <strong>2023</strong>)<br />
Figure 5.8: Composites <strong>Lightweight</strong> <strong>Materials</strong><br />
<strong>Market</strong>, by Sub-Type, Million Tons<br />
and $Billion (2016 – <strong>2023</strong>)<br />
Figure 5.9: Strategic Alliances in Automotive<br />
Industry, by OEMs and Carbon Fiber<br />
www.bisresearch.com
<strong>Global</strong> <strong>Lightweight</strong> <strong>Materials</strong> <strong>Market</strong><br />
<strong>Analysis</strong> and Forecast, <strong>2017</strong>-<strong>2023</strong><br />
LIST OF FIGURES<br />
Suppliers<br />
Figure 5.10: Composites <strong>Lightweight</strong> <strong>Materials</strong><br />
<strong>Market</strong>, by Application, $Billion<br />
(<strong>2017</strong> – <strong>2023</strong>)<br />
Figure 5.11: Composites <strong>Lightweight</strong> <strong>Materials</strong><br />
<strong>Market</strong>, by Region, Million Tons<br />
(<strong>2017</strong> – <strong>2023</strong>)<br />
Figure 5.11: Plastics <strong>Lightweight</strong> <strong>Market</strong> Size,<br />
$Billion (2016 – <strong>2023</strong>)<br />
Figure 5.12: Plastics <strong>Lightweight</strong> <strong>Materials</strong><br />
<strong>Market</strong>, by Application, $Billion<br />
(<strong>2017</strong> – <strong>2023</strong>)<br />
Figure 5.13: Plastics <strong>Lightweight</strong> <strong>Materials</strong><br />
<strong>Market</strong>, by Region, Million Tons<br />
(<strong>2017</strong> – <strong>2023</strong>)<br />
Figure 6.1: <strong>Global</strong> <strong>Lightweight</strong> <strong>Materials</strong> <strong>Market</strong>,<br />
by Application, $Billion<br />
Figure 6.2: Automotive <strong>Lightweight</strong> <strong>Materials</strong><br />
<strong>Market</strong>, by Type, $Billion (2016 –<br />
<strong>2023</strong>)<br />
Figure 6.3: Weight Saving in Automotive<br />
Applications by using <strong>Lightweight</strong><br />
<strong>Materials</strong><br />
Figure 6.4: Percent Distribution in Vehicle<br />
Weight, By Type and their<br />
Applications<br />
Figure 6.5: Aerospace & Defense <strong>Lightweight</strong><br />
<strong>Materials</strong> <strong>Market</strong>, by Type, $Billion<br />
(<strong>2017</strong> – <strong>2023</strong>)<br />
Figure 6.6: Aircraft Material Composition of<br />
B767 & B787<br />
Figure 6.7: Aircraft <strong>Market</strong> Share, By Material<br />
Figure 6.8: Airline Passenger Traffic, by Region,<br />
2015-2035<br />
Figure 6.9: New Airplane Demand, By Region,<br />
2016-2035<br />
Figure 6.10: Wind Energy <strong>Lightweight</strong> <strong>Materials</strong><br />
<strong>Market</strong>, by Type, $Billion (<strong>2017</strong> –<br />
<strong>2023</strong>)<br />
Figure 6.11: Annual Wind Energy Installations,<br />
2011-2016<br />
Figure 6 12: Trend Towards the Increase in Size<br />
of Wind Turbines, 1985-2015<br />
Figure 6.13: Others <strong>Lightweight</strong> <strong>Materials</strong><br />
<strong>Market</strong>, by type, $Billion (<strong>2017</strong> –<br />
<strong>2023</strong>)<br />
Figure 7.1: <strong>Lightweight</strong> materials <strong>Market</strong><br />
Growth Rate, by Region, <strong>2017</strong> and<br />
<strong>2023</strong><br />
Figure 7.2: <strong>Lightweight</strong> materials <strong>Market</strong><br />
Growth Rate, by Region, <strong>2017</strong> -<br />
<strong>2023</strong><br />
Figure 7.3: Asia-Pacific <strong>Lightweight</strong> <strong>Materials</strong><br />
<strong>Market</strong>, by Type, $Billion, <strong>2017</strong>-<br />
<strong>2023</strong><br />
Figure 7.4: Asia-Pacific <strong>Lightweight</strong> <strong>Materials</strong><br />
<strong>Market</strong>, by Country, $Billion, <strong>2017</strong>-<br />
<strong>2023</strong><br />
Figure 7.5: North America <strong>Lightweight</strong> <strong>Materials</strong><br />
<strong>Market</strong>, by Type, $Billion, <strong>2017</strong>-<br />
<strong>2023</strong><br />
Figure 7.6: North America <strong>Lightweight</strong> <strong>Materials</strong><br />
<strong>Market</strong>, by Country, $Billion, <strong>2017</strong>-<br />
<strong>2023</strong><br />
Figure 7.7: Europe <strong>Lightweight</strong> <strong>Materials</strong><br />
<strong>Market</strong>, by Type, $Billion, <strong>2017</strong>-<br />
<strong>2023</strong><br />
Figure 7.8: Composites Innovative Cluster in<br />
European <strong>Lightweight</strong> <strong>Materials</strong><br />
<strong>Market</strong><br />
Figure 7.9: Europe <strong>Lightweight</strong> <strong>Materials</strong><br />
<strong>Market</strong>, by Country, $Billion, <strong>2017</strong>-<br />
<strong>2023</strong><br />
Figure 7.10: ME&A <strong>Lightweight</strong> <strong>Materials</strong><br />
<strong>Market</strong>, by Type, $Billion, <strong>2017</strong>-<br />
<strong>2023</strong><br />
Figure 7.11: South America <strong>Lightweight</strong><br />
<strong>Materials</strong> <strong>Market</strong>, by Type, $Billion,<br />
<strong>2017</strong>-<strong>2023</strong><br />
Figure 8.1: Overall Financials, 2014-2016<br />
Figure 8.2: Geographic Revenue Mix, 2014-<br />
2016<br />
Figure 8.3: Business Segment Revenue Mix,<br />
2014-2016<br />
Figure 8.4: Overall Financials, 2014-2016<br />
Figure 8.5: Geographic Revenue Mix, 2014-<br />
2016<br />
Figure 8.6: Business Segment Revenue Mix,<br />
2014-2016<br />
Figure 8.7: Overall Financials, 2014-2016<br />
Figure 8.8: Geographic Revenue Mix, 2014-<br />
2016<br />
www.bisresearch.com
<strong>Global</strong> <strong>Lightweight</strong> <strong>Materials</strong> <strong>Market</strong><br />
<strong>Analysis</strong> and Forecast, <strong>2017</strong>-<strong>2023</strong><br />
LIST OF FIGURES<br />
Figure 8.9: Business Segment Revenue Mix,<br />
2014-2016<br />
Figure 8.10: Overall Financials, 2013-201<br />
Figure 8.11: Geographic Revenue Mix, 2013-<br />
2015<br />
Figure 8.12: Overall Financials, 2013-2015<br />
Figure 8.13: Geographic Revenue Mix, 2013-<br />
2015<br />
Figure 8.14: Segment Revenue Mix, 2013-2015<br />
Figure 8.15: Overall Financials, 2014-2016<br />
Figure 8.16: Geographic Revenue Mix, 2014-<br />
2016<br />
Figure 8.17: Business Segment Revenue Mix,<br />
2014-2016<br />
Figure 8.18: Overall Financials, 2014-2016<br />
Figure 8.19: Geographic Revenue Mix, 2014-<br />
2016<br />
Figure 8.20: Business Segment Revenue Mix,<br />
2014-2016<br />
Figure 8.21: Overall Financials, 2013-2015<br />
Figure 8.22: Overall Financials, 2014-2016<br />
Figure 8.23: Geographic Revenue Mix, 2014-<br />
2016<br />
Figure 8.24: Business Segment Revenue Mix,<br />
2014-2016<br />
Figure 8.25: Overall Financials, 2014-2016<br />
Figure 8.26: Geographic Revenue Mix, 2014-<br />
2016<br />
Figure 8.27: Business Segment Revenue Mix,<br />
2014-2016<br />
Figure 8.27: Overall Financials, 2013-2015<br />
Figure 8.28: Business Segment Revenue Mix,<br />
2013-2015<br />
Figure 8.29: Overall Financials, 2014-2016<br />
Figure 8.30: Geographic Revenue Mix, 2014-<br />
2016<br />
Figure 8.31: Business Segment Revenue Mix,<br />
2014-2016<br />
Figure 8.32: Overall Financials, 2014-2016<br />
Figure 8.33: Geographic Revenue Mix, 2014-<br />
2016<br />
Figure 8.34: Business Segment Revenue Mix,<br />
2014-2016<br />
Figure 8.35: Overall Financials, 2014-2016<br />
Figure 8.36: Geographic Revenue Mix, 2014-<br />
2016<br />
Figure 8.37: Business Segment Revenue Mix,<br />
2014-2016<br />
Figure 8.38: Overall Financials, 2014-2016<br />
Figure 8.39: Geographic Revenue Mix, 2014-<br />
2016<br />
Figure 8.40: Business Segment Revenue Mix,<br />
2014-2016<br />
Figure 8.41: Overall Financials, 2014-2016<br />
Figure 8.42: Business Segment Revenue Mix,<br />
2014-2016<br />
Figure 8.43: Overall Financials, 2014-2016<br />
Figure 8.44: Business Segment Revenue Mix,<br />
2014-2016<br />
Figure 8.45: Overall Financials, 2014-2016<br />
Figure 8.46: Geographic Revenue Mix, 2014-<br />
2016<br />
Figure 8.47: Business Segment Revenue Mix,<br />
2014-2016<br />
Figure 8.48: Overall Financials, 2014-2016<br />
Figure 8.49: Geographic Revenue Mix, 2014-<br />
2016<br />
Figure 8.50: Business Segment Revenue Mix,<br />
2014-2016<br />
Figure 8.51: Overall Financials, 2014-2016<br />
Figure 8.52: Geographic Revenue Mix, 2013-<br />
2015<br />
Figure 8.53: Business Segment Revenue Mix,<br />
2013-2015<br />
Figure 8.54: Overall Financials, 2014-2016<br />
Figure 8.55: Geographic Revenue Mix, 2013-<br />
2015<br />
Figure 8.56: Business Segment Revenue Mix,<br />
2013-2015<br />
Figure 8.57: Overall Financials, 2014-2016<br />
Figure 8.58: Geographic Revenue Mix, 2014-<br />
2016<br />
Figure 8.59: Business Segment Revenue, 2014-<br />
2015<br />
Figure 8.60: Overall Financials, 2014-2016<br />
Figure 8.61: Geographic Revenue Mix, 2014-<br />
2016<br />
Figure 8.63: Business Segment Revenue Mix,<br />
www.bisresearch.com
<strong>Global</strong> <strong>Lightweight</strong> <strong>Materials</strong> <strong>Market</strong><br />
<strong>Analysis</strong> and Forecast, <strong>2017</strong>-<strong>2023</strong><br />
LIST OF FIGURES<br />
2014-2016<br />
Figure 8.64: Overall Financials, 2013-2015<br />
Figure 8.65: Geographic Revenue Mix, 2013-<br />
2015<br />
Figure 8.66: Business Segment Revenue Mix,<br />
2013-2015<br />
www.bisresearch.com
<strong>Global</strong> <strong>Lightweight</strong> <strong>Materials</strong> <strong>Market</strong><br />
<strong>Analysis</strong> and Forecast, <strong>2017</strong>-<strong>2023</strong><br />
DISCLAIMER<br />
BIS Research provides valuable market intelligence to an exclusive group of customers in<br />
response to orders. The report is licensed for the customer’s internal use only and is subject<br />
to restrictions set henceforth. This document and its contents are confidential and may not<br />
be further distributed, published or reproduced, in whole or in part, by any medium or in any<br />
form for any purpose, without the express written consent of BIS Research. Customer will<br />
not disclose the contents of the report, whether directly in any media or indirectly through<br />
incorporation in a database, marketing list, report or otherwise, or use or permit the use of<br />
Information to generate any statistical or other information that is or will be provided to third<br />
parties; or voluntarily produce Information in legal proceedings.<br />
<strong>Market</strong> reports are based on expectations, estimates and projections as of the date such<br />
information is available. Any recommendation contained in this report may not be suitable<br />
for all investors or businesses. The market conclusions drawn are necessarily based upon a<br />
number of estimates and assumptions that, while considered reasonable by BIS Research as<br />
of the date of such statements, are inherently subject to market fluctuations and business,<br />
economic and competitive uncertainties and contingencies.<br />
For more details regarding permission, please contact us:<br />
Email: sales@bisresearch.com<br />
Tel: +1 650 228 0182<br />
www.bisresearch.com