Overview: Returns and Valuation Key return figures (in % of average Fund assets) 1) * I. Properties Gross income 2) 5.7 6.8 6.9 6.2 9.8 9.1 9.6 5.3 6.7 8.9 8.0 7.0 <strong>Management</strong> costs 2) – 1.1 – 1.6 – 0.3 – 0.6 – 0.9 – 1.7 – 5.0 – 0.8 – 1.5 – 1.5 – 1.8 – 1.5 Net income 2) 4.6 5.2 6.6 5.6 8.9 7.4 4.6 4.5 5.2 7.4 6.2 5.5 Changes in value 2) – 1.0 – 6.4 1.6 1.8 1.5 3.1 6.2 – 9.6 0.7 2.4 2.3 0.9 Foreign income taxes 2) 0.0 – 0.4 – 0.7 – 0.3 – 2.3 – 0.5 – 0.3 – 0.4 – 0.3 – 1.1 – 0.7 – 0.4 Foreign deferred taxes 2) 0.0 0.0 – 0.2 – 0.5 0.0 – 0.2 – 1.1 0.3 – 0.2 – 0.5 – 0.5 – 0.3 Income before borrowing costs 2) 3.6 – 1.6 7.3 6.6 8.1 9.8 9.4 – 5.2 5.4 8.2 7.3 5.7 Income after borrowing costs 3) 3.6 – 3.6 10.8 7.2 11.2 15.9 14.7 – 7.5 5.6 11.2 9.5 6.1 Exchange rate differences 3) 4) 0.0 0.0 0.0 0.0 0.0 0.0 – 1.4 0.0 – 0.1 – 0.4 – 0.3 – 0.1 Total income in Fund currency 3) 5) 3.6 – 3.6 10.8 7.2 11.2 15.9 13.3 – 7.5 5.5 10.8 9.2 6.0 II. Liquidity 6) 7) 1.9 III. Total Fund income before Fund costs 8) 4.6 Total Fund income after Fund costs (BVI method) 4.3 Net asset information (weighted average figures in EUR thousand) 1) * Directly held properties 2,028,696 77,540 509,743 514,612 162,<strong>31</strong>2 95,823 577,101 72,307 4,038,134 0 2,009,438 4,038,134 Properties held via equity interests 0 0 0 0 0 0 0 0 0 563,648 563,648 563,648 Total properties 2,028,696 77,540 509,743 514,612 162,<strong>31</strong>2 95,823 577,101 72,307 4,038,134 563,648 2,573,086 4,601,782 of which property assets financed by equity 2,028,696 55,512 269,193 413,392 97,123 50,557 236,440 56,562 3,207,475 297,003 1,475,782 3,504,478 Loan volume 0 22,028 240,550 101,220 65,189 45,266 340,661 15,745 830,659 266,645 1,097,304 1,097,304 Liquid assets 1,754,452 5,220 1,509 11,853 399 400 3,721 <strong>31</strong>7 1,777,871 40,323 63,742 1,818,194 Fund volume 3,783,148 60,732 270,702 425,245 97,522 50,957 240,161 56,879 4,985,346 337,326 1,539,524 5,322,672 Information on changes in value (at the <strong>report</strong>ing date in the Fund currency in EUR thousand) Portfolio market values (expert opinions) 9) 1,939,706 75,155 545,814 460,300 241,370 107,200 622,205 78,160 4,069,910 907,435 3,037,639 4,977,345 Portfolio rental valuations (expert opinions) 10) * 125,494 5,694 37,488 <strong>31</strong>,225 16,501 8,187 75,370 5,142 305,101 81,758 261,365 386,859 Positive changes in value acc. to expert opinions 11) 960 60 7,080 160 1,140 0 34,884 0 44,284 220 43,544 44,504 Other positive changes in value 12) 19,879 0 1,926 9,738 1,335 3,000 4,400 0 40,278 14,093 34,492 54,371 Negative changes in value acc. to expert opinions 11) – 36,365 – 5,030 – 1,050 – 820 0 0 – 3,224 – 840 – 47,329 – 523 – 11,487 – 47,852 Other negative changes in value 12) – 4,541 0 0 0 0 0 – 92 – 6,090 – 10,723 – 262 – 6,444 – 10,985 Addition – capital gains tax 0 0 – 1,024 – 2,298 0 – 202 – 6,213 196 – 9,541 – 3,059 – 12,600 – 12,600 Total changes in value acc. to expert opinions 11) – 35,405 – 4,970 6,030 – 660 1,140 0 <strong>31</strong>,660 – 840 – 3,045 – 303 32,057 – 3,348 Total other changes in value 12) 15,338 0 902 7,440 1,335 2,798 – 1,905 – 5,894 20,014 10,772 15,448 30,786 Total changes in value – 20,067 – 4,970 6,932 6,780 2,475 2,798 29,755 – 6,734 16,969 10,469 47,505 27,438 1) The weighted average figures in the financial year are calculated using 13 month-end values (<strong>31</strong> <strong>Mar</strong>ch 2005 – <strong>31</strong> <strong>Mar</strong>ch <strong>2006</strong>). 2) Based on the Fund’s average property assets in the period under review 3) Based on the Fund’s average property assets financed by equity in the period under review 4) "Exchange rate differences" include both changes in exchange rates and the costs of hedging transactions for the period under review. 5) Total income in Fund currency was generated with an average share of Fund assets invested in property and financed by equity for the period of 65.85%. 6) Based on the Fund’s average liquid assets during the period under review 7) The average share of Fund assets invested in the liquidity portfolio for the period was 34.15%. 16 <strong>SEB</strong> ImmoInvest Germany Germany Germany Belgium Belgium Belgium France France France Italy Italy Italy Netherlands Netherlands Netherlands Spain Spain Spain USA USA USA Rest of World Rest of World Rest of World Total direct investments Total direct investments Total direct investments Total equity interests Total equity interests Total equity interests 8) Based on the average Fund assets during the period under review 9) Properties under construction are included in the amount of their construction costs. Wherever portfolio properties were reclassified as properties under construction, they are included at market value; construction costs are included in the form of provisions for construction costs. 10) Portfolio rental valuations (expert opinions) refer to the gross profits from letting determined by experts. Gross profits in this case equal the net basic rent estimated by the experts as achievable over the long term. 11) Total changes in market values determined by experts 12) Other changes in value comprise changes in carrying amounts such as acquisition costs and purchase price settlements capitalised subsequent to initial recognition. * This table or line was not included in the audit or the Auditors’ Report. Total abroad Total abroad Total abroad Total Total Total
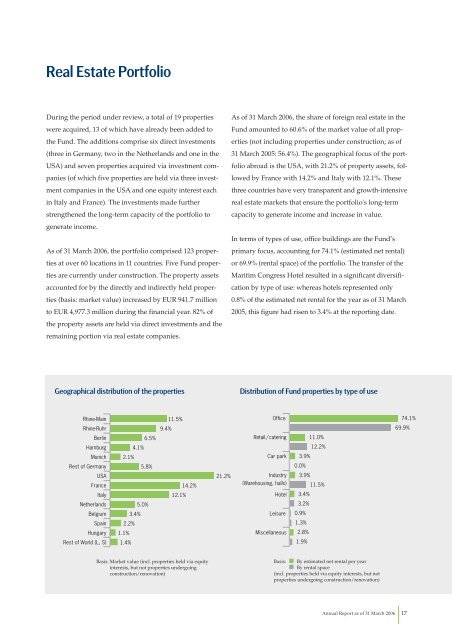
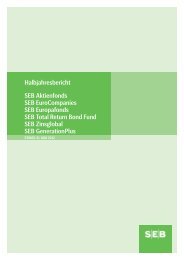
Real Estate Portfolio During the period under review, a total of 19 properties were acquired, 13 of which have already been added to the Fund. The additions comprise six direct investments (three in Germany, two in the Netherlands and one in the USA) and seven properties acquired via investment companies (of which five properties are held via three investment companies in the USA and one equity interest each in Italy and France). The investments made further strengthened the long-term capacity of the portfolio to generate income. As of <strong>31</strong> <strong>Mar</strong>ch <strong>2006</strong>, the portfolio comprised 123 properties at over 60 locations in 11 countries. Five Fund properties are currently under construction. The property assets accounted for by the directly and indirectly held properties (basis: market value) increased by EUR 941.7 million to EUR 4,977.3 million during the financial year. 82% of the property assets are held via direct investments and the remaining portion via real estate companies. Geographical distribution of the properties Rhine-Main Rhine-Ruhr Berlin Hamburg Munich Rest of Germany USA France Italy Netherlands Belgium Spain Hungary Rest of World (L, S) 11.5% 9.4% 6.5% 4.1% 2.1% 5.8% 5.0% 3.4% 2.2% 1.1% 1.4% 14.2% 12.1% Basis: <strong>Mar</strong>ket value (incl. properties held via equity interests, but not properties undergoing construction/renovation) 21.2% As of <strong>31</strong> <strong>Mar</strong>ch <strong>2006</strong>, the share of foreign real estate in the Fund amounted to 60.6% of the market value of all properties (not including properties under construction; as of <strong>31</strong> <strong>Mar</strong>ch 2005: 56.4%). The geographical focus of the portfolio abroad is the USA, with 21.2% of property assets, followed by France with 14.2% and Italy with 12.1%. These three countries have very transparent and growth-intensive real estate markets that ensure the portfolio's long-term capacity to generate income and increase in value. In terms of types of use, office buildings are the Fund’s primary focus, accounting for 74.1% (estimated net rental) or 69.9% (rental space) of the portfolio. The transfer of the <strong>Mar</strong>itim Congress Hotel resulted in a significant diversification by type of use: whereas hotels represented only 0.8% of the estimated net rental for the year as of <strong>31</strong> <strong>Mar</strong>ch 2005, this figure had risen to 3.4% at the <strong>report</strong>ing date. Distribution of Fund properties by type of use Office Retail / catering Car park Industry (Warehousing, halls) Hotel Leisure Miscellaneous 11.0% 12.2% 3.9% 0.0% 3.9% 11.5% 3.4% 3.2% 0.9% 1.3% 2.8% 1.9% Basis: By estimated net rental per year By rental space (incl. properties held via equity interests, but not properties undergoing construction/renovation) 74.1% 69.9% Annual Report as of <strong>31</strong> <strong>Mar</strong>ch <strong>2006</strong> 17