

Natural Gas Market Centers: A 2008 Update - EIA
Natural Gas Market Centers: A 2008 Update - EIA
Natural Gas Market Centers: A 2008 Update - EIA

You also want an ePaper? Increase the reach of your titles
YUMPU automatically turns print PDFs into web optimized ePapers that Google loves.
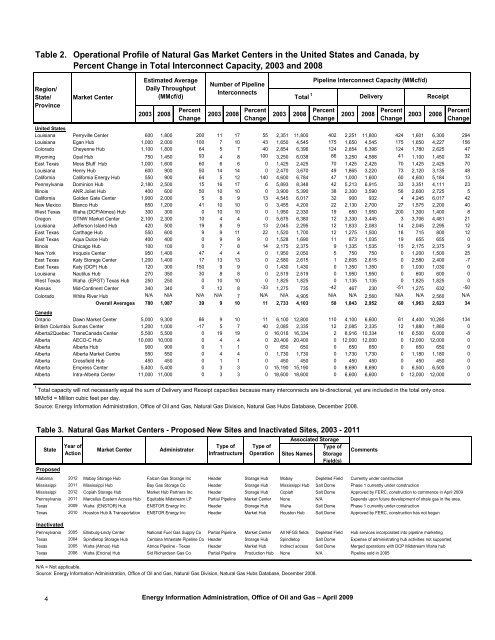
Table 2.<br />
Region/<br />
State/<br />
Province<br />
4<br />
Operational Profile of <strong>Natural</strong> <strong>Gas</strong> <strong>Market</strong> <strong>Centers</strong> in the United States and Canada, by<br />
Percent Change in Total Interconnect Capacity, 2003 and <strong>2008</strong><br />
<strong>Market</strong> Center<br />
Estimated Average<br />
Daily Throughput<br />
(MMcf/d)<br />
2003 <strong>2008</strong><br />
Percent<br />
Change<br />
Number of Pipeline<br />
Interconnects<br />
2003 <strong>2008</strong> Percent<br />
Change<br />
2003 <strong>2008</strong> Percent<br />
Change<br />
Energy Information Administration, Office of Oil and <strong>Gas</strong> – April 2009<br />
2003 <strong>2008</strong> Percent<br />
Change<br />
2003 <strong>2008</strong> Percent<br />
Change<br />
United States<br />
Louisiana Perryville Center 600 1,800 200 11 17 55 2,351 11,800 402 2,251 11,800 424 1,601 6,300 294<br />
Louisiana Egan Hub 1,000 2,000 100 7 10 43 1,650 4,545 175 1,650 4,545 175 1,650 4,227 156<br />
Colorado Cheyenne Hub 1,100 1,800 64 5 7 40 2,854 6,396 124 2,854 6,396 124 1,780 2,625 47<br />
Wyoming Opal Hub 750 1,450 93 4 8 100 3,250 6,038 86 3,250 4,588 41 1,100 1,450 32<br />
East Texas Moss Bluff Hub 1,000 1,600 60 6 6 0 1,425 2,425 70 1,425 2,425 70 1,425 2,425 70<br />
Louisiana Henry Hub 600 900 50 14 14 0 2,470 3,670 49 1,865 3,220 73 2,120 3,135 48<br />
California California Energy Hub 550 900 64 5 12 140 4,600 6,784 47 1,000 1,600 60 4,600 5,184 13<br />
Pennsylvania Dominion Hub 2,180 2,500 15 16 17 6 5,893 8,348 42 5,213 6,915 33 3,351 4,111 23<br />
Illinois ANR Joliet Hub 400 600 50 10 10 0 3,900 5,390 38 2,300 3,590 56 2,600 2,725 5<br />
California Golden Gate Center 1,900 2,000 5 8 9 13 4,545 6,017 32 900 932 4 4,245 6,017 42<br />
New Mexico Blanco Hub 850 1,200 41 10 10 0 3,455 4,200 22 2,130 2,700 27 1,575 2,200 40<br />
West Texas Waha (DCP/Atmos) Hub 300 300 0 10 10 0 1,950 2,330 19 650 1,950 200 1,300 1,400 8<br />
Oregon GTNW <strong>Market</strong> Center 2,100 2,300 10 4 4 0 5,675 6,380 12 3,330 3,445 3 3,706 4,481 21<br />
Louisiana Jefferson Island Hub 420 500 19 8 9 13 2,045 2,295 12 1,833 2,083 14 2,045 2,295 12<br />
East Texas Carthage Hub 550 600 9 9 11 22 1,520 1,700 12 1,275 1,500 18 715 800 12<br />
East Texas Aqua Dulce Hub 400 400 0 9 9 0 1,528 1,690 11 873 1,035 19 655 655 0<br />
Illinois Chicago Hub 100 100 0 7 8 14 2,175 2,375 9 1,335 1,535 15 2,175 2,375 9<br />
New York Iroquois Center 950 1,400 47 4 4 0 1,950 2,050 5 750 750 0 1,200 1,500 25<br />
East Texas Katy Storage Center 1,200 1,400 17 13 13 0 2,580 2,615 1 2,605 2,615 0 2,580 2,400 -7<br />
East Texas Katy (DCP) Hub 120 300 150 9 9 0 1,430 1,430 0 1,350 1,350 0 1,030 1,030 0<br />
Louisiana Nautilus Hub 270 350 30 8 8 0 2,519 2,519 0 1,950 1,950 0 600 600 0<br />
West Texas Waha (EPGT) Texas Hub 250 250 0 10 10 0 1,825 1,825 0 1,135 1,135 0 1,825 1,825 0<br />
Kansas Mid-Continent Center 340 340 0 12 8 -33 1,275 735 -42 467 230 -51 1,275 632 -50<br />
Colorado White River Hub N/A N/A N/A N/A 7 N/A N/A 4,905 N/A N/A 2,560 N/A N/A 2,560 N/A<br />
Canada<br />
Overall Averages 780 1,087 39 9 10 11 2,733 4,103 50 1,843 2,952 60 1,963 2,623 34<br />
Ontario Dawn <strong>Market</strong> Center 5,000 9,300 86 9 10 11 6,100 12,800 110 4,100 6,600 61 4,400 10,280 134<br />
British Columbia Sumas Center 1,200 1,000 -17 5 7 40 2,085 2,335 12 2,085 2,335 12 1,880 1,880 0<br />
Alberta2Quebec TransCanada Center 5,500 5,500 0 19 19 0 16,016 16,334 2 8,916 10,334 16 6,500 6,000 -8<br />
Alberta AECO-C Hub 10,000 10,000 0 4 4 0 20,400 20,400 0 12,000 12,000 0 12,000 12,000 0<br />
Alberta Alberta Hub 900 900 0 1 1 0 650 650 0 650 650 0 650 650 0<br />
Alberta Alberta <strong>Market</strong> Centre 550 550 0 4 4 0 1,730 1,730 0 1,730 1,730 0 1,180 1,180 0<br />
Alberta Crossfield Hub 450 450 0 1 1 0 450 450 0 450 450 0 450 450 0<br />
Alberta Empress Center 5,400 5,400 0 3 3 0 15,190 15,190 0 8,690 8,690 0 6,500 6,500 0<br />
Alberta Intra-Alberta Center 11,000 11,000 0 3 3 0 18,600 18,600 0 6,600 6,600 0 12,000 12,000 0<br />
1 Total capacity will not necessarily equal the sum of Delivery and Receipt capacities because many interconnects are bi-directional, yet are included in the total only once.<br />
MMcf/d = Million cubic feet per day.<br />
Source: Energy Information Administration, Office of Oil and <strong>Gas</strong>, <strong>Natural</strong> <strong>Gas</strong> Division, <strong>Natural</strong> <strong>Gas</strong> Hubs Database, December <strong>2008</strong>.<br />
Table 3. <strong>Natural</strong> <strong>Gas</strong> <strong>Market</strong> <strong>Centers</strong> - Proposed New Sites and Inactivated Sites, 2003 - 2011<br />
Year of<br />
State <strong>Market</strong> Center Administrator<br />
Action<br />
Pipeline Interconnect Capacity (MMcf/d)<br />
Total 1 Delivery Receipt<br />
Associated Storage<br />
Type of<br />
Sites Names Storage<br />
Field(s)<br />
Proposed<br />
Alabama 2012 Mobay Storage Hub Falcon <strong>Gas</strong> Storage Inc Header Storage Hub Mobay Depleted Field Currently under construction<br />
Mississippi 2011 Mississippi Hub Bay <strong>Gas</strong> Storage Co Header Storage Hub Mississippi Hub Salt Dome Phase 1 currently under construction<br />
Mississippi 2012 Copiah Storage Hub <strong>Market</strong> Hub Partners Inc Header Storage Hub Copiah Salt Dome Approved by FERC, construction to commence in April 2009<br />
Pennsylvania 2011 Marcellus Eastern Access Hub Equitable Midstream LP Partial Pipeline <strong>Market</strong> Center None N/A Depends upon future development of shale gas in the area.<br />
Texas 2009 Waha (ENSTOR) Hub ENSTOR Energy Inc Header Storage Hub Waha Salt Dome Phase 1 currently under construction<br />
Texas 2010 Houston Hub & Transportation ENSTOR Energy Inc Header <strong>Market</strong> Hub Houston Hub Salt Dome Approved by FERC, construction has not begun<br />
Inactivated<br />
Type of<br />
Infrastructure<br />
Type of<br />
Operation<br />
Pennsylvania 2005 Ellisburg-Leidy Center National Fuel <strong>Gas</strong> Supply Co Partial Pipeline <strong>Market</strong> Center All NFGS fields Depleted Field Hub services incorporated into pipeline marketing<br />
Texas 2004 Spindletop Storage Hub Centana Intrastate Pipeline Co Header Storage Hub Spindletop Salt Dome Expense of administrating hub activities not supported<br />
Texas 2005 Waha (Atmos) Hub Atmos Pipeline - Texas Header <strong>Market</strong> Hub Indirect access Salt Dome Merged operations with DCP Midstream Waha hub<br />
Texas 2006 Waha (Encina) Hub Sid Richardson <strong>Gas</strong> Co Partial Pipeline Production Hub None N/A Pipeline sold in 2005<br />
N/A = Not applicable.<br />
Source: Energy Information Administration, Office of Oil and <strong>Gas</strong>, <strong>Natural</strong> <strong>Gas</strong> Division, <strong>Natural</strong> <strong>Gas</strong> Hubs Database, December <strong>2008</strong>.<br />
Comments


