

Natural Gas Market Centers: A 2008 Update - EIA
Natural Gas Market Centers: A 2008 Update - EIA
Natural Gas Market Centers: A 2008 Update - EIA

You also want an ePaper? Increase the reach of your titles
YUMPU automatically turns print PDFs into web optimized ePapers that Google loves.
<strong>Natural</strong> <strong>Gas</strong> <strong>Market</strong> <strong>Centers</strong>: A <strong>2008</strong> <strong>Update</strong><br />
This special report looks at the current status of market centers in today=s natural gas marketplace, examining their role<br />
and their importance to natural gas shippers, pipelines, and others involved in the transportation of natural gas over the<br />
North American pipeline network. Questions or comments on the contents of this article should be directed to James<br />
Tobin at james.tobin@eia.doe.gov or (202) 586-4835.<br />
<strong>Natural</strong> gas market centers first began to develop in the late<br />
1980s following the implementation of the initial openaccess<br />
transportation initiative under the Federal Energy<br />
Regulatory Commission’s (FERC) Order 436 (1985). 1<br />
<strong>Market</strong> centers since have become a key component of the<br />
North American natural gas transportation network (see box,<br />
“<strong>Market</strong> Center Development”). Located at strategic points<br />
on the pipeline grid, these centers offer essential<br />
transportation service for shippers between pipeline<br />
interconnections, as well as provide these shippers with<br />
many of the physical and administrative support services<br />
formerly handled by the natural gas pipeline company as<br />
“bundled” sales services. 2<br />
The day-to-day operations of a market center are usually<br />
managed by two separate parties: the center’s administrator,<br />
who provides customer contact and handles administrative<br />
tasks, and a pipeline operator who carries out the physical<br />
operations at the direction of the administrator. Both the<br />
operational infrastructure among market centers and the<br />
services offered vary considerably (see box, “<strong>Market</strong> Center<br />
Configurations”).<br />
The key services offered by most market centers include the<br />
physical coverage of short-term receipt/delivery balancing<br />
needs such as parking and loaning services, compression<br />
services, and pooling (see box, “<strong>Market</strong> Center Services”).<br />
Many of these market centers also provide new and<br />
innovative services that expedite and improve the natural<br />
gas transportation process. For instance, many market<br />
centers include access to internet-based natural gas trading<br />
platforms and capacity release programs, in addition to<br />
interactions that support title transfer services between<br />
parties who buy, sell, or move their natural gas through the<br />
center.<br />
Overview<br />
For a market center to be successful, liquidity is very<br />
important. A market center’s location must be able to sustain<br />
sufficient trading interest among natural gas customers to<br />
1 See Energy Information Administration, <strong>Natural</strong> <strong>Gas</strong>: Major<br />
Legislative and Regulatory Actions (1935 - <strong>2008</strong>)<br />
http://www.eia.doe.gov/oil_gas/natural_gas/analysis_publications/ngmajorl<br />
eg/ferc436.html<br />
2 In 1992, the Federal Energy Regulatory Commission issued its<br />
Order 636, which required interstate natural gas pipeline companies to<br />
transform themselves from buyers and sellers of natural gas (bundlers) to<br />
strictly common-carrier transporters offering unbundled services.<br />
Energy Information Administration, Office of Oil and <strong>Gas</strong> – April 2009<br />
successfully generate enough transportation and other<br />
service revenues to support its business interests. It cannot<br />
remain in business in the long-term if it cannot provide<br />
shippers (buyers/sellers) the opportunity to route their<br />
shipments to alternative destinations with the best price<br />
opportunities and provide basic support services such as title<br />
transfer, parking, and loaning of natural gas on a short-term<br />
basis.<br />
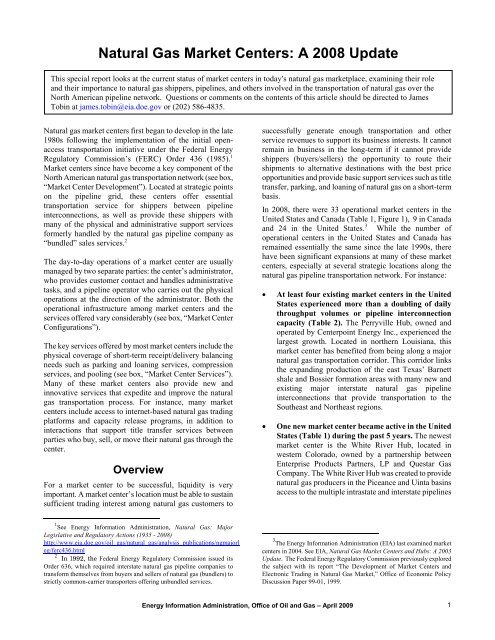
In <strong>2008</strong>, there were 33 operational market centers in the<br />
United States and Canada (Table 1, Figure 1), 9 in Canada<br />
and 24 in the United States. 3 While the number of<br />
operational centers in the United States and Canada has<br />
remained essentially the same since the late 1990s, there<br />
have been significant expansions at many of these market<br />
centers, especially at several strategic locations along the<br />
natural gas pipeline transportation network. For instance:<br />
• At least four existing market centers in the United<br />
States experienced more than a doubling of daily<br />
throughput volumes or pipeline interconnection<br />
capacity (Table 2). The Perryville Hub, owned and<br />
operated by Centerpoint Energy Inc., experienced the<br />
largest growth. Located in northern Louisiana, this<br />
market center has benefited from being along a major<br />
natural gas transportation corridor. This corridor links<br />
the expanding production of the east Texas’ Barnett<br />
shale and Bossier formation areas with many new and<br />
existing major interstate natural gas pipeline<br />
interconnections that provide transportation to the<br />
Southeast and Northeast regions.<br />
• One new market center became active in the United<br />
States (Table 1) during the past 5 years. The newest<br />
market center is the White River Hub, located in<br />
western Colorado, owned by a partnership between<br />
Enterprise Products Partners, LP and Questar <strong>Gas</strong><br />
Company. The White River Hub was created to provide<br />
natural gas producers in the Piceance and Uinta basins<br />
access to the multiple intrastate and interstate pipelines<br />
3 The Energy Information Administration (<strong>EIA</strong>) last examined market<br />
centers in 2004. See <strong>EIA</strong>, <strong>Natural</strong> <strong>Gas</strong> <strong>Market</strong> <strong>Centers</strong> and Hubs: A 2003<br />
<strong>Update</strong>. The Federal Energy Regulatory Commission previously explored<br />
the subject with its report “The Development of <strong>Market</strong> <strong>Centers</strong> and<br />
Electronic Trading in <strong>Natural</strong> <strong>Gas</strong> <strong>Market</strong>,” Office of Economic Policy<br />
Discussion Paper 99-01, 1999.<br />
1
Table 1.<br />
Region/<br />
State/<br />
Province<br />
2<br />
Administrative Profile of Operational <strong>Natural</strong> <strong>Gas</strong> <strong>Market</strong> <strong>Centers</strong> in the United States and Canada, <strong>2008</strong><br />
<strong>Market</strong> Center Administrator<br />
On Line<br />
Customer<br />
Service<br />
System<br />
Type of<br />
Infrastructure<br />
Type of<br />
Operation<br />
<strong>Market</strong> Center Development<br />
The installation of market centers and hubs is a relatively recent development in the natural gas industry. Although the concept first evolved in the<br />
late 1980s, it was fast tracked after the issuance of FERC Order 636 issued in 1992. <strong>Market</strong> centers and hubs quickly became a key element in<br />
providing novice natural gas shippers with many of the physical capabilities and administrative support services formerly handled by the interstate<br />
pipeline company as “bundled” sales services.<br />
As it implemented Order 636 in 1993, FERC promoted the market center concept. It was suggested that such centers could provide the services that<br />
pipeline shipper/customers needed to manage their portfolios of supply, transportation, and storage services previously provided by the merchant<br />
pipeline company. Their facilities also could increase the interchange of natural gas across pipeline systems and permit a market to develop for the<br />
trading of natural gas volumes, storage, and pipeline capacity. Furthermore, because services would be priced separately, it was suggested that<br />
additional efficiencies could develop as competition among centers and pipelines developed over time.<br />
Indeed, the interstate natural gas pipeline system did experience a significant increase in pipeline interconnections after Order 636. Although most<br />
of these connections were developed singly, as individual pipeline companies expanded their transportation services and supply sources, market<br />
center development nevertheless spurred many additional interconnections.<br />
Nevertheless, the market center concept did not resolve all issues, and so in 2000, FERC issued Order 637. Its purpose was to lessen the impact of<br />
imbalance penalties on shippers and the issuance of operational flow orders (OFOs) by interstate pipeline companies. Order 637, in part, required<br />
that the (interstate) pipeline transporter “must provide, to the extent operationally practicable, parking and lending or other services that facilitate the<br />
ability of shippers to manage transportation imbalances.”<br />
By 1998, 36 market centers had been established within the U.S. natural gas pipeline grid. By 2003, however, 13 of these had closed their doors as<br />
the concept matured and those that were unable to develop a trading base were eliminated. Currently, 24 market centers in the United States provide<br />
hub services to customers, the majority of which are located in the States of Texas and Louisiana.<br />
Energy Information Administration, Office of Oil and <strong>Gas</strong> – April 2009<br />
Associated Storage<br />
Type of<br />
Sites Names Storage<br />
Field(s)<br />
Central<br />
Colorado Cheyenne Hub Colorado Interstate <strong>Gas</strong> Co CIG-Xpress Header <strong>Market</strong> Hub 2000 No Young/Ltigo/Huntsman Indirect<br />
Colorado White River Hub White River Hub LLC Questor Header Production Hub <strong>2008</strong> Meeker None N/A<br />
Kansas Mid-Continent Center Oneok <strong>Gas</strong> Transportation LLC Caminus Partial Pipeline <strong>Market</strong> Center 1995 Spivey/Frontier Brehm, Konold Depleted Field<br />
Wyoming Opal Hub Williams Field Services Co <strong>Gas</strong>Kit Header Production Hub 1999 Opal None N/A<br />
Midwest<br />
Illinois ANR Joliet Hub ANR Pipeline Co Gems Partial Pipeline <strong>Market</strong> Center 2003 Aux Sable Linepack & Michigan Sites Various<br />
Illinois Chicago Hub Enerchange Inc "<strong>Gas</strong> Exchange" Partial Pipeline <strong>Market</strong> Center 1993 No Unused WG capacity Mixed<br />
Northeast<br />
New York Iroquois Center Iroquois <strong>Gas</strong> Trans Co Iroquois OnLine Entire Pipeline <strong>Market</strong> Center 1996 No Avg. 200MMcf/d - Linepack Linepack<br />
Pennsylvania Dominion Hub Dominion Transmission Inc EScript Entire Pipeline <strong>Market</strong> Center 1994 No All Dominion Sites Depleted Field<br />
Southwest<br />
Louisiana Egan Hub Egan Hub Partners LP LINK System Header Storage Hub 1995 No Egan storage Salt Dome<br />
Louisiana Henry Hub Sabine Hub Services Inc HubLink Header <strong>Market</strong> Center 1988 No Jefferson Island Salt Dome<br />
Louisiana Jefferson Island Jefferson Island Storage & Hub LLC Latitude Header Storage Hub 1998 No Jefferson Island Salt Dome<br />
Louisiana Nautilus Hub Enbridge Offsore Pipelines Quorum System Header Production Hub 2000 Neptune None N/A<br />
Louisiana Perryville Center Centerpoint Energy <strong>Gas</strong> Trans ServiceLynx Partial Pipeline <strong>Market</strong> Center 1994 No Ruston, Ada, Childes Depleted Field<br />
New Mexico Blanco Hub Transwestern <strong>Gas</strong> Pipeline Co TW Transfer Header Production Hub 1993 Kutz/Milagro System Linepack Linepack<br />
East Texas Aqua Dulce Hub ConocoPhillips Inc Fax-phone only Header Production Hub 1990 King Ranch None N/A<br />
East Texas Carthage Hub DCP Midstream Partners LP Fax-phone only Header Production Hub 1990 Carthage Indirect N/A<br />
East Texas Katy (DCP) Hub DCP Midstream LP Fax-phone only Header Production Hub 1995 Katy None N/A<br />
East Texas Katy Storage Center ENSTOR Energy Inc Latitude Header Storage Hub 1993 No Katy Depleted Field<br />
East Texas Moss Bluff Hub Moss Bluff Hub Partners LP LINK System Header Storage Hub 1994 No Moss Bluff Salt Dome<br />
West Texas Waha (EPGT) Texas Hub Enterprise Products Pipeline LP StarWeb Partial Pipeline Production Hub 1995 Waha Boling Salt Dome<br />
West Texas Waha (DCP/Atmos) Hub DCP Midstream LP CAMINUS Header Production Hub 1995 No None N/A<br />
Western<br />
California California Energy Hub Southern California <strong>Gas</strong> Co ENVOY Entire Pipeline <strong>Market</strong> Center 1994 No All SoCal fields-Interruptible Depleted Field<br />
California Golden Gate Center California <strong>Gas</strong> Transmission Co PipeRanger Entire Pipeline <strong>Market</strong> Center 1996 No All PG&E- Interr & Linepack Depleted Field<br />
Oregon GTNW <strong>Market</strong> Center <strong>Gas</strong> Transmission - NW Pacific Express Entire Pipeline <strong>Market</strong> Center 1994 No System Linepack Only N/A<br />
Canada<br />
Alberta AECO-C Hub Encana Energy Co AECO-LINK Entire Pipeline <strong>Market</strong> Center 1990 No Suffield, Countess Depleted Field<br />
Alberta Alberta Hub ENSTOR Energy Inc Latitude Header Storage Hub 1997 No Alberta Hub Depleted Field<br />
Alberta Alberta <strong>Market</strong> Centre Atco Midstream Ltd Fax-phone only Header Storage Hub 1998 No Carbon Facility Depleted Field<br />
Alberta Crossfield Hub Crossalta <strong>Gas</strong> Storage & Services Fax-phone only Header Storage Hub 1995 No East Crossfield Depleted Field<br />
Alberta Empress Center Transcanada <strong>Gas</strong> Pipelines Ltd NRGhighway Header <strong>Market</strong> Hub 1986 No Linepack Depleted Field<br />
Alberta Intra-Alberta Center Transcanada <strong>Gas</strong> Pipelines Ltd NGX Trading Sys Partial Pipeline <strong>Market</strong> Center 1994 No Indirect Depleted Field<br />
British Columbia Sumas Center Spectra Energy Corp Yes-Non Specific Partial Pipeline <strong>Market</strong> Hub 1994 McMahon,Kwoen Aitken Creek- Indirectly Depleted Field<br />
Alberta2Quebec TransCanada Center Transcanada <strong>Gas</strong> Pipelines Ltd NRGhighway Entire Pipeline <strong>Market</strong> Center 1998 No Indirect only N/A<br />
Ontario Dawn <strong>Market</strong> Center Spectra Energy Corp Unionline Entire Pipeline <strong>Market</strong> Center 1985 No Dawn (18 Pools) Depleted Field<br />
N/A = Not applicable, Interr = interruptible, WG = working gas. See Table 2 and Figure 2 for additional detail.<br />
Source: Energy Information Administration, Office of Oil and <strong>Gas</strong>, <strong>Natural</strong> <strong>Gas</strong> Division, <strong>Natural</strong> <strong>Gas</strong> Hubs Database, December <strong>2008</strong>.<br />
Year<br />
Started<br />
Associated<br />
Processing<br />
Plant
Figure 1. <strong>Natural</strong> <strong>Gas</strong> <strong>Centers</strong>/Hubs Relative to <strong>Natural</strong> <strong>Gas</strong> Transportation Corridors, <strong>2008</strong><br />
Alberta <strong>Market</strong> Centre<br />
Sumas Center<br />
GTNW <strong>Market</strong> Center<br />
Western<br />
Golden Gate Center<br />
California Energy Hub<br />
Alberta Hub<br />
AECO-C Hub<br />
Intra-Alberta Center<br />
Crossfield Hub<br />
Central<br />
Opal Hub<br />
White River Hub<br />
Waha (EPGT) Texas Hub<br />
Empress Center<br />
Blanco Hub<br />
Waha (DCP/Atmos) Hub<br />
Katy Storage Center<br />
Cheyenne Hub<br />
Mid-Continent Center<br />
Southwest<br />
Katy (DCP) Hub<br />
DCP = DCP Midstream Partners LP; EPGT = Enterprise Products Texas Pipeline Company.<br />
Note: The relative widths of the various transportation corridors are based upon the total level of interstate pipeline capacity (<strong>2008</strong>) for the combined<br />
pipelines that operate on the generalized route shown.<br />
Source: Energy Information Administration, <strong>Gas</strong>Tran <strong>Gas</strong> Transportation Information System, <strong>Natural</strong> <strong>Gas</strong> <strong>Market</strong> Hubs Database, December <strong>2008</strong>.<br />
that now serve the expanding production fields located<br />
within the surrounding area.<br />
Carthage Hub<br />
• Currently, there are six proposed market centers<br />
that may be placed in service during the next 4 to 5<br />
years (Table 3). With the exception of the Marcellus<br />
Eastern Access Hub, proposed by Equitable Midstream<br />
LP to serve the western Pennsylvania /West Virginia<br />
production area, these potential market centers are<br />
predicated upon the development of high-deliverability<br />
underground natural gas storage facilities. Of the other<br />
“proposed” market centers/hubs, one is in Alabama,<br />
two in Mississippi, and two are in Texas. All of the<br />
latter five are currently under construction or have been<br />
approved by regulatory authorities.<br />
On the other hand, four market centers in the United States<br />
have also been deactivated since 2003 (Table 3). The<br />
largest of these, the Ellisburg-Leidy Center, served the New<br />
York and Pennsylvania areas and ceased formal operations<br />
in 2005. Its administrator, National Fuel <strong>Gas</strong> Supply<br />
Company, instead opted to provide hub-like services within<br />
its normal system operations instead. Another market center,<br />
the Encina Hub located in the Waha area of west Texas,<br />
Midwest<br />
Perryville Center<br />
Moss Bluff Hub<br />
Canada<br />
TransCanada Center<br />
Chicago Hub<br />
ANR Joliet Hub<br />
Henry Hub<br />
Aqua Dulce Hub<br />
Egan Hub<br />
Jefferson Island Sorage Hub<br />
Nautilus Hub<br />
Dawn <strong>Market</strong> Center<br />
Energy Information Administration, Office of Oil and <strong>Gas</strong> – April 2009<br />
Southeast<br />
Northeast<br />
Iroquois Center<br />
Dominion Hub<br />
Capacity<br />
(million cubic feet per day)<br />
15,000<br />
9,000<br />
3,000<br />
= <strong>Market</strong> Center/Hub<br />
ceased operations in 2006 when its support pipeline was<br />
sold and its operations integrated with other hubs in the<br />
Waha area.<br />
Between 2003 and <strong>2008</strong>, the operational profile of many of<br />
the U.S natural gas market centers changed markedly.<br />
Estimates indicate that transportation activities at U.S.<br />
market centers increased on average about 39 percent, with<br />
at least 16 of the 24 showing an increase in average daily<br />
throughput activity of 10 percent or more (Table 2). 4 In<br />
addition, while the average number of interconnections per<br />
market center increased only slightly, six market centers<br />
added two or more interconnections during the period.<br />
Consequently, total average pipeline interconnect capacity<br />
increased by about 50 percent, with three market centers at<br />
least doubling their interconnect capacity. Three<br />
experienced no growth in interconnect capacity. Only one,<br />
4 Based primarily on anecdotal information received from market center<br />
contacts developed in researching this report. While no specific data were<br />
provided that could validate their performance evaluations, the contacts<br />
offered their best estimates based on a firm working knowledge of<br />
transportation service activities occurring at their center during the past 5<br />
years.<br />
3
Table 2.<br />
Region/<br />
State/<br />
Province<br />
4<br />
Operational Profile of <strong>Natural</strong> <strong>Gas</strong> <strong>Market</strong> <strong>Centers</strong> in the United States and Canada, by<br />
Percent Change in Total Interconnect Capacity, 2003 and <strong>2008</strong><br />
<strong>Market</strong> Center<br />
Estimated Average<br />
Daily Throughput<br />
(MMcf/d)<br />
2003 <strong>2008</strong><br />
Percent<br />
Change<br />
Number of Pipeline<br />
Interconnects<br />
2003 <strong>2008</strong> Percent<br />
Change<br />
2003 <strong>2008</strong> Percent<br />
Change<br />
Energy Information Administration, Office of Oil and <strong>Gas</strong> – April 2009<br />
2003 <strong>2008</strong> Percent<br />
Change<br />
2003 <strong>2008</strong> Percent<br />
Change<br />
United States<br />
Louisiana Perryville Center 600 1,800 200 11 17 55 2,351 11,800 402 2,251 11,800 424 1,601 6,300 294<br />
Louisiana Egan Hub 1,000 2,000 100 7 10 43 1,650 4,545 175 1,650 4,545 175 1,650 4,227 156<br />
Colorado Cheyenne Hub 1,100 1,800 64 5 7 40 2,854 6,396 124 2,854 6,396 124 1,780 2,625 47<br />
Wyoming Opal Hub 750 1,450 93 4 8 100 3,250 6,038 86 3,250 4,588 41 1,100 1,450 32<br />
East Texas Moss Bluff Hub 1,000 1,600 60 6 6 0 1,425 2,425 70 1,425 2,425 70 1,425 2,425 70<br />
Louisiana Henry Hub 600 900 50 14 14 0 2,470 3,670 49 1,865 3,220 73 2,120 3,135 48<br />
California California Energy Hub 550 900 64 5 12 140 4,600 6,784 47 1,000 1,600 60 4,600 5,184 13<br />
Pennsylvania Dominion Hub 2,180 2,500 15 16 17 6 5,893 8,348 42 5,213 6,915 33 3,351 4,111 23<br />
Illinois ANR Joliet Hub 400 600 50 10 10 0 3,900 5,390 38 2,300 3,590 56 2,600 2,725 5<br />
California Golden Gate Center 1,900 2,000 5 8 9 13 4,545 6,017 32 900 932 4 4,245 6,017 42<br />
New Mexico Blanco Hub 850 1,200 41 10 10 0 3,455 4,200 22 2,130 2,700 27 1,575 2,200 40<br />
West Texas Waha (DCP/Atmos) Hub 300 300 0 10 10 0 1,950 2,330 19 650 1,950 200 1,300 1,400 8<br />
Oregon GTNW <strong>Market</strong> Center 2,100 2,300 10 4 4 0 5,675 6,380 12 3,330 3,445 3 3,706 4,481 21<br />
Louisiana Jefferson Island Hub 420 500 19 8 9 13 2,045 2,295 12 1,833 2,083 14 2,045 2,295 12<br />
East Texas Carthage Hub 550 600 9 9 11 22 1,520 1,700 12 1,275 1,500 18 715 800 12<br />
East Texas Aqua Dulce Hub 400 400 0 9 9 0 1,528 1,690 11 873 1,035 19 655 655 0<br />
Illinois Chicago Hub 100 100 0 7 8 14 2,175 2,375 9 1,335 1,535 15 2,175 2,375 9<br />
New York Iroquois Center 950 1,400 47 4 4 0 1,950 2,050 5 750 750 0 1,200 1,500 25<br />
East Texas Katy Storage Center 1,200 1,400 17 13 13 0 2,580 2,615 1 2,605 2,615 0 2,580 2,400 -7<br />
East Texas Katy (DCP) Hub 120 300 150 9 9 0 1,430 1,430 0 1,350 1,350 0 1,030 1,030 0<br />
Louisiana Nautilus Hub 270 350 30 8 8 0 2,519 2,519 0 1,950 1,950 0 600 600 0<br />
West Texas Waha (EPGT) Texas Hub 250 250 0 10 10 0 1,825 1,825 0 1,135 1,135 0 1,825 1,825 0<br />
Kansas Mid-Continent Center 340 340 0 12 8 -33 1,275 735 -42 467 230 -51 1,275 632 -50<br />
Colorado White River Hub N/A N/A N/A N/A 7 N/A N/A 4,905 N/A N/A 2,560 N/A N/A 2,560 N/A<br />
Canada<br />
Overall Averages 780 1,087 39 9 10 11 2,733 4,103 50 1,843 2,952 60 1,963 2,623 34<br />
Ontario Dawn <strong>Market</strong> Center 5,000 9,300 86 9 10 11 6,100 12,800 110 4,100 6,600 61 4,400 10,280 134<br />
British Columbia Sumas Center 1,200 1,000 -17 5 7 40 2,085 2,335 12 2,085 2,335 12 1,880 1,880 0<br />
Alberta2Quebec TransCanada Center 5,500 5,500 0 19 19 0 16,016 16,334 2 8,916 10,334 16 6,500 6,000 -8<br />
Alberta AECO-C Hub 10,000 10,000 0 4 4 0 20,400 20,400 0 12,000 12,000 0 12,000 12,000 0<br />
Alberta Alberta Hub 900 900 0 1 1 0 650 650 0 650 650 0 650 650 0<br />
Alberta Alberta <strong>Market</strong> Centre 550 550 0 4 4 0 1,730 1,730 0 1,730 1,730 0 1,180 1,180 0<br />
Alberta Crossfield Hub 450 450 0 1 1 0 450 450 0 450 450 0 450 450 0<br />
Alberta Empress Center 5,400 5,400 0 3 3 0 15,190 15,190 0 8,690 8,690 0 6,500 6,500 0<br />
Alberta Intra-Alberta Center 11,000 11,000 0 3 3 0 18,600 18,600 0 6,600 6,600 0 12,000 12,000 0<br />
1 Total capacity will not necessarily equal the sum of Delivery and Receipt capacities because many interconnects are bi-directional, yet are included in the total only once.<br />
MMcf/d = Million cubic feet per day.<br />
Source: Energy Information Administration, Office of Oil and <strong>Gas</strong>, <strong>Natural</strong> <strong>Gas</strong> Division, <strong>Natural</strong> <strong>Gas</strong> Hubs Database, December <strong>2008</strong>.<br />
Table 3. <strong>Natural</strong> <strong>Gas</strong> <strong>Market</strong> <strong>Centers</strong> - Proposed New Sites and Inactivated Sites, 2003 - 2011<br />
Year of<br />
State <strong>Market</strong> Center Administrator<br />
Action<br />
Pipeline Interconnect Capacity (MMcf/d)<br />
Total 1 Delivery Receipt<br />
Associated Storage<br />
Type of<br />
Sites Names Storage<br />
Field(s)<br />
Proposed<br />
Alabama 2012 Mobay Storage Hub Falcon <strong>Gas</strong> Storage Inc Header Storage Hub Mobay Depleted Field Currently under construction<br />
Mississippi 2011 Mississippi Hub Bay <strong>Gas</strong> Storage Co Header Storage Hub Mississippi Hub Salt Dome Phase 1 currently under construction<br />
Mississippi 2012 Copiah Storage Hub <strong>Market</strong> Hub Partners Inc Header Storage Hub Copiah Salt Dome Approved by FERC, construction to commence in April 2009<br />
Pennsylvania 2011 Marcellus Eastern Access Hub Equitable Midstream LP Partial Pipeline <strong>Market</strong> Center None N/A Depends upon future development of shale gas in the area.<br />
Texas 2009 Waha (ENSTOR) Hub ENSTOR Energy Inc Header Storage Hub Waha Salt Dome Phase 1 currently under construction<br />
Texas 2010 Houston Hub & Transportation ENSTOR Energy Inc Header <strong>Market</strong> Hub Houston Hub Salt Dome Approved by FERC, construction has not begun<br />
Inactivated<br />
Type of<br />
Infrastructure<br />
Type of<br />
Operation<br />
Pennsylvania 2005 Ellisburg-Leidy Center National Fuel <strong>Gas</strong> Supply Co Partial Pipeline <strong>Market</strong> Center All NFGS fields Depleted Field Hub services incorporated into pipeline marketing<br />
Texas 2004 Spindletop Storage Hub Centana Intrastate Pipeline Co Header Storage Hub Spindletop Salt Dome Expense of administrating hub activities not supported<br />
Texas 2005 Waha (Atmos) Hub Atmos Pipeline - Texas Header <strong>Market</strong> Hub Indirect access Salt Dome Merged operations with DCP Midstream Waha hub<br />
Texas 2006 Waha (Encina) Hub Sid Richardson <strong>Gas</strong> Co Partial Pipeline Production Hub None N/A Pipeline sold in 2005<br />
N/A = Not applicable.<br />
Source: Energy Information Administration, Office of Oil and <strong>Gas</strong>, <strong>Natural</strong> <strong>Gas</strong> Division, <strong>Natural</strong> <strong>Gas</strong> Hubs Database, December <strong>2008</strong>.<br />
Comments
Figure 2.<br />
Billion cubic feet<br />
15,000<br />
14,000<br />
13,000<br />
12,000<br />
11,000<br />
10,000<br />
9,000<br />
8,000<br />
7,000<br />
6,000<br />
5,000<br />
4,000<br />
3,000<br />
2,000<br />
1,000<br />
<strong>Natural</strong> <strong>Gas</strong> Production Growth Areas, 1997, 2002, and 2007<br />
Rocky Mountain States<br />
177<br />
286<br />
365<br />
891<br />
1,388<br />
1,825<br />
562<br />
964<br />
1,326<br />
the Mid-Continent market center located in Kansas, lost<br />
both interconnections and capacity. 5<br />
The percentage of natural gas transported on the national<br />
pipeline grid that goes through a natural gas market center<br />
has also increased. Based on annual natural gas<br />
transportation volume information reported to the FERC by<br />
interstate pipeline companies, the average daily volume of<br />
natural gas transported by individual pipelines on the entire<br />
interstate network in 2007 was about 101 billion cubic feet<br />
per day (Bcf/d). 6 Estimates of average daily volumes<br />
processed through the 24 market centers approximated 25<br />
5 Actually, the Mid-Continent market center lost interconnections, thus<br />
receipt/delivery capacity, when it and its supporting Oneok Pipeline system<br />
were sold to Oneok Partners LP and the relationship was restructured.<br />
6 See Federal Energy Regulatory Commission Form 2/2A, “Major and<br />
Non-major <strong>Natural</strong> <strong>Gas</strong> Pipeline Annual Report,” <strong>Gas</strong> Account data,<br />
“Deliveries of <strong>Gas</strong> to Others for Transportation (Account 858),” 2003 &<br />
2007, http://www.ferc.gov/docs-filing/eforms/form-2/data.asp#skipnavsub.<br />
1,630<br />
2,638<br />
3,516<br />
67<br />
59<br />
139<br />
1997 2002 2007<br />
Northeast Texas<br />
Energy Information Administration, Office of Oil and <strong>Gas</strong> – April 2009<br />
106<br />
258<br />
519<br />
210<br />
377<br />
1,130<br />
624<br />
599<br />
896<br />
percent of that figure, or about 25 Bcf/d. 7 This figure<br />
represents a 4-percent increase over 2003 in the portion of<br />
natural gas transported nationwide that saw some part of its<br />
journey handled by a market center.<br />
Growth Patterns<br />
<strong>Natural</strong> gas market centers located in areas of expanding<br />
natural gas production and along strategic transportation<br />
routes downstream of these areas have experienced the<br />
greatest levels of growth since 2003. These market centers<br />
benefited not only from increased levels of natural gas<br />
transportation flows and new natural gas pipeline capacity,<br />
7 Both this estimate and the 2007 Federal Energy Regulatory<br />
Commission average day transport volume of 101 billion cubic feet per day<br />
includes some double counting of volumes since a shipment of natural gas<br />
may flow through several natural gas pipelines or market centers on its way<br />
to the final consumer. Such double counted volumes cannot be discretely<br />
identified or eliminated.<br />
982<br />
1,318<br />
14,422<br />
2,684<br />
14,627<br />
12,967 12,967<br />
0<br />
Utah Wyoming Colorado Total RRC 7B RRC 9 RRC 5 RRC 6<br />
Total Remaining<br />
Lower 48<br />
RRC = Texas Railroad Commission District.<br />
Source: Energy Information Administration, U.S. Crude Oil and <strong>Natural</strong> <strong>Gas</strong>, and <strong>Natural</strong> <strong>Gas</strong> Liquids Reserves: 1997, 2002, and 2007 Annual Reports.<br />
5
ut they also attracted additional natural gas trading and<br />
new shipper/customers who had a need for the many types<br />
of services that these market centers offered.<br />
Two major regions of the United States, the Southwest and<br />
Central regions (Figure 1) have been most affected. In the<br />
Southwest Region, it has been the areas of northeast Texas<br />
and northern Louisiana, while in the Central Region it has<br />
been the areas of western Colorado and Wyoming that have<br />
seen major production growth and a corresponding increase<br />
in market center expansion.<br />
Southwest Regional <strong>Centers</strong><br />
During the 10-year period between 1997 and 2007, the area<br />
encompassing northeastern Texas experienced more growth<br />
than all others in the United States, with natural gas<br />
production increasing by 173 percent (Figure 2). Since 2003<br />
alone, natural gas production in this part of the State 8 grew<br />
104 percent, increasing from 1.3 billion cubic feet (Bcf) in<br />
2002 to 2.7 Bcf in 2007(this area contains most of the highly<br />
prolific Barnett shale and Bossier formation).<br />
More than half (13) of the currently active U.S. gas market<br />
centers are situated in the Southwest region; all but one of<br />
those 13 being located in Texas and Louisiana (Figure 1). In<br />
addition to being the largest natural gas production area in<br />
North America, where supplies from a large number of<br />
sources are aggregated and traded, the region has a large<br />
number of interstate and intrastate pipeline interconnections<br />
and 64 underground storage facilities, 8 of which are<br />
associated with one or more market centers (Table 1).<br />
The most publicized natural gas market center in North<br />
America, the Henry Hub, is located in southwestern<br />
Louisiana (Figure 1). The Henry Hub has an extensive<br />
receipt and delivery capability with almost 200 customers<br />
regularly conducting business at the site through its 11<br />
interconnecting pipeline systems. 9 The Henry Hub also<br />
provides its customers access to the high-deliverability<br />
Jefferson Island salt storage cavern facility, which itself<br />
operates a separate and distinct market center operation<br />
(Table 1). Since 2003, this hub has increased its<br />
interconnection capacity by about 50 percent, although it did<br />
not add any additional interconnecting pipelines (Table 2).<br />
Seven of its 14 interconnections increased in capacity,<br />
contributing to an estimated average daily throughput<br />
increase of about 50 percent over the period.<br />
8 Includes Texas Railroad Commission (RRC) district 5, 6, 7B, and<br />
9.<br />
9<br />
The Henry Hub is also the specified delivery point for New York<br />
Mercantile Exchange (NYMEX) natural gas futures contracts, although it is<br />
not affiliated with the NYMEX.<br />
6<br />
Energy Information Administration, Office of Oil and <strong>Gas</strong> – April 2009<br />
Two additional market centers operate along the southern<br />
Louisiana coast, the Egan Hub Storage Center and the<br />
Nautilus Hub. Because the Nautilus Hub confines its<br />
operations primarily to supporting the interconnection of<br />
offshore Gulf of Mexico production with eight major<br />
interstate pipelines onshore, its average daily throughput<br />
growth has been relatively small over the past 5 years as<br />
offshore production volumes have declined. The Egan<br />
Storage Hub, on the other hand, located onshore and<br />
benefiting from its location along the route of several<br />
interstate pipeline expansions serving the growing<br />
production from east Texas fields, has more than doubled its<br />
interconnect capacity with the addition of three new<br />
interconnections over the past 5 years (Table 2).<br />
The most significant impact from growing east Texas<br />
natural gas production in the Southeast Region has been the<br />
large-scale development of new natural gas pipelines<br />
extending through northern Louisiana and expansion of<br />
several existing ones. Strategically situated in this area,<br />
Centerpoint Energy Company’s Perryville Hub (Figure 4)<br />
has become one of the largest natural gas market centers in<br />
North America as a result, with access to 17 pipeline<br />
interconnections (15 interstate and 2 intrastate), over 10<br />
Bcf/d of delivery capacity, and more than 6 Bcf/d of receipt<br />
capacity (Table 2).<br />
During the past several years alone, at least 3.3 Bcf/d of new<br />
interstate natural gas pipeline capacity was installed in and<br />
around the Perryville area, much of it with interconnections<br />
at the Perryville Hub. In 2009 and 2010, an additional 5.2<br />
Bcf/d of new pipeline capacity is scheduled to be built,<br />
much of it potentially accessible through the Perryville Hub.<br />
The impetus for this recent and future pipeline construction<br />
has been the rapid and extensive expansion of<br />
unconventional shale natural gas in east Texas and the<br />
anticipated development of similar resources in the<br />
Haynesville Shale Basin of northern Louisiana.<br />
Because most of the natural gas created by the heavy<br />
development of the Barnett Shale and Bossier Trend<br />
formations has moved eastward into Louisiana, the several<br />
market centers located in eastern Texas have not been<br />
affected to any great extent. The Carthage Hub, which sits<br />
directly on the natural gas transportation route directly<br />
linking northeast Texas production and major interstate<br />
pipeline interconnections in Louisiana, Mississippi, and<br />
Alabama, has added a couple of new pipeline<br />
interconnections to its portfolio, but its estimated average<br />
daily throughput rate is only slightly more than it was in<br />
2003. As a plant tailgate hub (Figure 3, box A), the capacity<br />
of its associated natural gas processing plants limits its<br />
throughput. Much of the natural gas flowing along the<br />
corridor at this point has already been processed further
Figure 3. Generalized <strong>Market</strong> Center/Hub Operational Schematic<br />
A<br />
Interconnections<br />
Indirect<br />
Direct<br />
Gathering Lines<br />
<strong>Gas</strong> Processing Plant<br />
Plant<br />
Tailgate<br />
Pipeline’s Mainline<br />
Bi-Directional<br />
Production Area Hubs<br />
Receipt<br />
Only<br />
Delivery<br />
Only<br />
Receipt/<br />
Delivery<br />
Other<br />
Mainline<br />
Pipelines<br />
Header<br />
System<br />
Receipt<br />
Only<br />
Delivery<br />
Only<br />
Header<br />
System<br />
Receipt/<br />
Delivery<br />
Note: Storage, Gathering, and <strong>Gas</strong> Processing Plant facilities are not associated with all market centers/hubs.<br />
Source: Energy Information Administration, Office of Oil and <strong>Gas</strong>, <strong>Natural</strong> <strong>Gas</strong> Division.<br />
Energy Information Administration, Office of Oil and <strong>Gas</strong> – April 2009<br />
B<br />
<strong>Market</strong> Center Configurations<br />
Storage Hubs<br />
Storage<br />
Facilities<br />
Header (or Segment) of Mainline Pipeline<br />
Receipt<br />
Only<br />
Other<br />
Mainline<br />
Pipelines<br />
Essentially, a natural gas market center exists to provide its customers (shippers and gas marketers primarily) with receipt/delivery access to<br />
two or more pipeline systems, provide transportation between these points, and offer administrative services that facilitate that movement<br />
and/or transfer of gas ownership. But the infrastructure associated with the market center itself may be configured in several different ways<br />
(Figure 3). For instance:<br />
Full Pipeline System – Some market centers are associated with and use all, or a sizable portion, of an entire pipeline system to carry out their<br />
operations and provide transportation services to and between all pipeline interconnect points that are part of their system. Its configuration may<br />
encompass all or part of the operations and facilities included on Figure 3.<br />
Header System (non-storage) – This form of market center operates using a short portion of a mainline pipeline, or a stand-alone lateral, where<br />
two or more pipeline interconnections are concentrated within a relatively short distance from each other. (Figure 3, box C)<br />
Storage Header System – The bi-directional laterals that connect the underground storage facility to the mainline intra- or interstate pipelines are<br />
also used to transport a shipper’s natural gas between these interconnects (Figure 3, box B). Depending upon the hub services needed by the<br />
customer, the transported natural gas may or may not move through the associated storage facilities.<br />
Production Area Header Systems – These market center operations dispatch production volumes onto the mainline transmission grid from<br />
interconnections on the header system with other mainline intrastate pipelines, or from the tailgate of a natural gas processing plant (Figure 3, box<br />
A). Such centers confine their activities mostly to providing hub services to natural gas producer clients.<br />
Currently, 18 of the 33 active North American market centers can be categorized as header systems, with relatively short distances between<br />
pipeline transfer points and other facilities such as storage. The remaining 15 natural gas market centers are associated with and use all, or a sizable<br />
portion, of a single pipeline system to carry out their operations and provide transportation services (Table 1).<br />
C<br />
7
upstream, and is flowing on large mainline pipelines leading<br />
out of the State.<br />
Some of the additional flows of growing northeast Texas<br />
production are being transported on a southerly route to<br />
interstate interconnections in south Texas and southern<br />
Louisiana through market centers located in the Katy area of<br />
southeastern Texas (Figure 4). This movement has<br />
contributed to greater throughput at these several market<br />
centers but has not fostered the addition of any new pipeline<br />
interconnections or greater receipt/delivery capacity at<br />
existing interconnections. Nevertheless, these market centers<br />
are attractive to shippers because they provide<br />
interconnections among at least 21 pipelines, including a<br />
number of the major interstate pipelines such as Texas<br />
Eastern Transmission and Tennessee <strong>Gas</strong> Pipeline<br />
companies, major transporters of natural gas to the Midwest<br />
and Northeast markets.<br />
The Carthage area of northeastern Texas, as well as the Katy<br />
area to the south, also receives natural gas flowing from the<br />
west Texas Waha area. Three major Texas intrastate natural<br />
gas pipelines transport natural gas from two market centers<br />
located at Waha to east Texas, EPGT Texas Pipeline,<br />
directed to the Carthage area, and the Guadalupe and the<br />
Oasis pipelines directed to the Katy area.<br />
Central Regional <strong>Centers</strong><br />
A number of new natural gas pipelines have been built in the<br />
Central region over the past 5 years because of the<br />
continuing expansion of natural gas exploration,<br />
development, and production of both conventional and<br />
unconventional resources in Colorado, Utah, and<br />
Wyoming. 10 In addition, several existing natural gas<br />
pipeline systems in the region have expanded as well. In<br />
turn, the existing natural gas market centers located in the<br />
area, specifically the Opal Hub in southwestern Wyoming<br />
and the Cheyenne Hub in northeastern Colorado, have added<br />
major new interconnections and have expanded their receipt<br />
and delivery capabilities during the period (Table 2). In<br />
addition, the White River Hub, placed in service in late<br />
<strong>2008</strong>, addressed the need for market center services for<br />
producers and pipelines located in the Uinta/Piceance Basin<br />
area of western Colorado and eastern Utah.<br />
<strong>Natural</strong> gas production in these three States grew 33 percent<br />
over the past 5 years and by 116 percent since 1997 (Figure<br />
2). In the Green River Basin of western Wyoming, which<br />
accounts for about 90 percent of the State’s current natural<br />
gas production and where natural gas production has<br />
10 Energy Information Administration, <strong>Gas</strong>Tran <strong>Natural</strong> <strong>Gas</strong><br />
Transportation Information System, <strong>Natural</strong> <strong>Gas</strong> Pipeline Projects<br />
Database, <strong>2008</strong>.<br />
8<br />
Energy Information Administration, Office of Oil and <strong>Gas</strong> – April 2009<br />
increased 11 percent since 2003, 11 the Opal Hub has<br />
experienced a 93 percent increase in estimated daily<br />
throughput, added four interconnects, and nearly doubled its<br />
receipt/delivery capability (Table 2). The Opal Hub, located<br />
at the southern end of the Green River Basin, provides more<br />
than 1.45 billion cubic feet (Bcf) of processed natural gas<br />
daily to Northwest Pipeline, Colorado Interstate <strong>Gas</strong>, and<br />
the Kern River Transmission systems among others (Figure<br />
5). 12<br />
The Cheyenne Hub, located in eastern Colorado, has not<br />
only profited from the increased natural gas production in<br />
the Green River Basin that flows eastward, it has been the<br />
destination of a large portion of the natural gas coming out<br />
of the Uinta/Piceance Basin expansion. These new flows<br />
into the Cheyenne Hub have more then compensated for the<br />
one-third decrease in Wyoming’s Powder River Basin<br />
coalbed methane production, much of which is directed<br />
toward the hub. The Cheyenne Hub began operations in<br />
2000 to support the growing need for natural gas<br />
transportation out of the Powder River Basin and to provide<br />
trading services for eastern Wyoming and northern Colorado<br />
area producers and other market makers.<br />
Two new large-capacity pipelines supporting the Cheyenne<br />
Hub expansion, the Cheyenne Plains and the Rockies<br />
Express, have begun operations with interconnections at the<br />
Cheyenne Hub. In addition to these two new pipeline<br />
systems, the Trailblazer Pipeline, which increased its<br />
capacity in 2002 by 56 percent, or 350 million cubic feet per<br />
day, begins at the Cheyenne Hub, also providing customers<br />
with access to the Midwest gas market.<br />
The new White River Hub, a partnership between Enterprise<br />
Products Partners, LP and Questar <strong>Gas</strong> Company, operates<br />
an 11-mile header system pipeline and offers market center<br />
services to producers and pipelines located primarily in the<br />
Piceance Basin area of western Colorado (Table 1). <strong>Natural</strong><br />
gas production in this area of Colorado increased from 14<br />
percent of total Colorado production in 2003 to 28 percent in<br />
2007, supporting development of the White River Hub.<br />
With seven interconnections among area pipelines and<br />
gathering operations and a natural gas processing plant, the<br />
White River Hub operation essentially formalizes business<br />
services that previously had developed among area pipeline<br />
interconnection operators. As reference points these<br />
11 Based on data for Wyoming, Colorado, and Utah, contained in a<br />
presentation of the Wyoming Pipeline Authority, Rockies <strong>Natural</strong> <strong>Gas</strong><br />
Resources, “Wyoming - Top Five Producing Counties”<br />
http://www.wyopipeline.com/information/presentations/<strong>2008</strong>/May/Final<br />
%20Seattle%20Presentation%20May%2013%20<strong>2008</strong>.pdf.<br />
12 In May 2003, the Kern River Transmission System doubled its<br />
pipeline capacity between Wyoming and California.
<strong>Market</strong> Center Services<br />
The types of services offered by market centers vary significantly. No two operations are identical in the services offered, and in fact, the features<br />
of similarly named services often differ in meaning and inclusions. The list below describes most of the broad types of services offered.<br />
Transportation/Wheeling - Transfer of natural gas from one interconnected pipeline to another through a header (hub), by<br />
displacement (including exchanges), or by physical transfer over the transmission of a market center pipeline.<br />
Parking - A short-term transaction in which the market center holds the shipper's natural gas for redelivery at a later date. Often uses<br />
storage facilities, but may also use displacement or variations in linepack.<br />
Loaning - A short-term advance of natural gas to a shipper by a market center that is repaid in kind by the shipper a short time later.<br />
Also referred to as advancing, drafting, reverse parking, and imbalance resolution.<br />
Storage – Holding natural gas longer than parking, such as seasonal storage. Most often confined to available interruptible storage<br />
capacity only.<br />
Peaking - Short-term (usually less than a day and perhaps hourly) sales of natural gas to meet unanticipated increases in demand or<br />
shortages of natural gas experienced by the buyer.<br />
Balancing - A short-term interruptible arrangement to cover a temporary imbalance situation. The service is often provided in<br />
conjunction with parking and loaning.<br />
Pooling/Volume Aggregation - A pooling transportation service that allows customers to aggregate natural gas from various points<br />
within a supply area and have it delivered into downstream firm or interruptible transportation contracts at designated delivery point<br />
pooling stations.<br />
Title Transfer - A service in which changes in ownership of a specific natural gas package are recorded by the market center. Title may<br />
transfer several times for some natural gas before it leaves the center. The service is an accounting or documentation of title transfers<br />
that may be done electronically, by hard copy, or both.<br />
Electronic Nomination – Customers may connect with the market center electronically to enter natural gas transportation nominations,<br />
examine their account position, and access bulletin board services. Such systems may also facilitate trading among buyers and sellers<br />
and support direct negotiation among parties.<br />
Administration - Assistance to shippers with aspects of natural gas transfers, such as nominations and confirmations.<br />
Compression – Provide compression needed to increase pressure of natural gas received off of a lower pressure system so that it can be<br />
transferred to a pipeline operating at a higher pressure. If needed additional compression is bundled with transportation, it is not a<br />
separate service.<br />
Hub-to-Hub Transfers - Arranging simultaneous receipt of a customer’s natural gas into a connection associated with one center and<br />
simultaneous delivery at a distant connection associated with another center.<br />
Transportation and title transfer remain the most important market center operations and services provided the customer. For instance, when a<br />
shipper with contracted capacity on one pipeline wants to deliver natural gas to an end user located off another pipeline, the shipper can make<br />
arrangements to transport the natural gas on the other pipeline through the market center administrator. If two parties consummate a trade<br />
through the market center, the administrator will handle the title transfer and other administrative details, including providing the operator of the<br />
center’s pipeline facilities with the physical flow details involved in the deal.<br />
Needed capacity on the receiving pipeline may be acquired at the center if trading services (or traders) are available. Similarly, the shipper can<br />
use the center’s services to revise its nominations (or temporarily release some capacity) on either pipeline, with the center handling the<br />
administrative requirements, including confirmations, associated with the transactions. To cover any imbalances that might occur when the<br />
receipt/delivery volume exceeds nominated capacity on either pipeline, the shipper can execute an operational balancing agreement with the<br />
center.<br />
When the shipper experiences a sudden increase in demand, the center may also provide the necessary incremental support from storage. If the<br />
shipper temporarily exceeds its storage allotment at the center, the center can offer natural gas loaning, with the shipper responsible for its<br />
replacement within a specified period. Similarly, storage withdrawal and loaning by the center can also be used to cover shortfalls when<br />
purchased production flowing into the downstream pipeline does not equal transportation nominations. Most centers provide a real-time tracking<br />
service to notify shippers immediately when such imbalances are imminent.<br />
<strong>Market</strong> centers require pre-approved credit and/or proven creditworthiness of their potential customers and normally operate under standardized<br />
contract provisions. The advantage of a standardized contract is that it is well understood and so minimizes transaction costs and provides a<br />
clear understanding of legal responsibilities. Pre-approved credit and/or creditworthiness support the ease of trading and finalization of<br />
contracts.<br />
Energy Information Administration, Office of Oil and <strong>Gas</strong> – April 2009<br />
9
Figure 4. Concentrations of <strong>Natural</strong> <strong>Gas</strong> <strong>Market</strong> Center Activities in Texas and Louisiana, <strong>2008</strong><br />
To Western<br />
<strong>Market</strong>s<br />
LA<br />
To Northeast<br />
and Southeast<br />
<strong>Market</strong>s<br />
Waha Area Hubs<br />
(Permian Basin Production)<br />
EPGT Hub<br />
DCP/Atmos Hub<br />
See Note 1<br />
= Key <strong>Gas</strong> Shale<br />
Production Area<br />
Southeast Texas Hubs<br />
Henry Hub<br />
Other South Louisiana Hubs<br />
Egan Center<br />
Nautilus Hub<br />
= Area of Major market<br />
center activity<br />
Katy (DEFS) Hub<br />
Katy Storage Hub<br />
Moss Bluff<br />
Jefferson Island Hub<br />
= Flow Direction<br />
= <strong>Market</strong> Center/Hub<br />
Agua Dulce Hub<br />
DCP = DCP Midstream LP; EPGT = Enterprise Products Texas Pipeline Company.<br />
Note 1: Corridors shown are illustrative only and are not intended to reflect actual pipeline capacity or flow levels.<br />
Note 2: Some flows out of the San Juan Basin, destined for California, Arizona, and north and east Texas, are directed through the Waha area hubs.<br />
Source: Energy Information Administration, Office of Oil and <strong>Gas</strong>, <strong>Natural</strong> <strong>Gas</strong> Division, <strong>Natural</strong> <strong>Gas</strong> <strong>Market</strong> Hubs Database, December <strong>2008</strong>.<br />
informal operations were often referred to as the<br />
Greasewood Hub and the Meeker Hub, but they were not<br />
market centers (see box, “Trading and Price Reporting”).<br />
Although its business location is in northern New Mexico,<br />
the Blanco Hub, operated by Transwestern <strong>Gas</strong> Pipeline<br />
Company, is a primary provider of market center services to<br />
pipelines and producers flowing natural gas production from<br />
the portion of San Juan Basin located in southwestern<br />
Colorado. While natural gas production in southwest<br />
Colorado decreased 11 percent between 2003 and 2007, the<br />
area still represents more than 30 percent of the State’s<br />
overall annual natural gas production. 13 <strong>Natural</strong> gas<br />
production in the New Mexico portion of the San Juan Basin<br />
also decreased 11 percent during that period.<br />
Despite this decrease in production in the area and no<br />
additional interconnections being installed, activity at the<br />
Blanco Hub grew during the period, with estimated daily<br />
throughput showing a 41-percent increase and<br />
receipt/delivery capability growing 22 percent (Table 2).<br />
13<br />
Based on data in “Colorado - Top Five Producing Counties.” See<br />
footnote 11.<br />
10<br />
See Note 2<br />
TX<br />
To Midwest <strong>Market</strong>s<br />
Fayetteville/<br />
Greenville/<br />
Woodford<br />
Shale Production<br />
Barnett Shale/<br />
Bossier Formation<br />
Production<br />
OK<br />
AR<br />
Northeast Texas Area<br />
Carthage Hub<br />
To Midwest <strong>Market</strong>s<br />
Energy Information Administration, Office of Oil and <strong>Gas</strong> – April 2009<br />
One reason for this increase in market center activity is that<br />
the Blanco Hub is a destination point for the TransColorado<br />
<strong>Gas</strong> Transmission pipeline system. This pipeline extends<br />
300 miles from the Greasewood area (White River Hub) of<br />
northwest Colorado (Piceance Basin) to a point of<br />
interconnection with El Paso <strong>Natural</strong> <strong>Gas</strong>, Transwestern,<br />
and Southern Trails interstate pipelines at the Blanco Hub.<br />
Western Regional <strong>Centers</strong><br />
North Louisiana Area<br />
(Haynesville Shale Production)<br />
Perryville Hub<br />
In the Western Region, activities at the three existing market<br />
centers grew primarily because of increases in interconnect<br />
capacity and number (Figure 1). The California Energy Hub,<br />
operated by Southern California <strong>Gas</strong> Company, was the only<br />
market center in the region to see a significant increase in<br />
estimated daily throughput volume, up 64 percent (Table 2).<br />
The California Energy Hub also experienced a major<br />
increase (47 percent) in interconnect capability as two new<br />
interstate pipelines became associated with the market<br />
center: the North Baja Pipeline system and Questar’s<br />
Southern Trails Pipeline system. Several additional<br />
interconnection locations along the existing interstate system
Figure 5. Rocky Mountain <strong>Natural</strong> <strong>Gas</strong> Hubs and Target <strong>Market</strong>s, <strong>2008</strong><br />
To Western <strong>Market</strong>s<br />
Northwest Pipeline<br />
Kern River Transmission Pipeline<br />
White River Hub<br />
Capacity<br />
(million cubic feet per day)<br />
5,000<br />
3,000<br />
1,000<br />
0<br />
= <strong>Market</strong> Center/Hub<br />
Opal Hub<br />
as well as several new intrastate production receipt points<br />
also were added to its venue. In addition, between 2003 and<br />
2007 natural gas deliveries into southern California<br />
increased by at least 6 percent, 14 providing support for<br />
expansion of the California Energy Hub.<br />
The other two market centers in the Western region, the <strong>Gas</strong><br />
Transmission Northwest (GTNW) <strong>Market</strong> Center and the<br />
PG&E Golden Gate <strong>Market</strong> Center, saw only limited growth<br />
during the period (Table 2). This minimal growth reflects<br />
the stabilization of natural gas pipeline capacity originating<br />
in western Canada, which serves the west coast of the<br />
United States, primarily California. Since 2003, the decrease<br />
in natural gas shipments along this route has negated the<br />
need for new pipeline capacity. Indeed, over the 5-year<br />
period, deliveries of natural gas into northern California<br />
were between 545 and 600 Bcf per year, whereas in the<br />
prior 5 years, annual flows were in the range of 640 to 680<br />
Bcf. Nonetheless, the two market centers did manage to<br />
14 Energy Information Administration, <strong>Natural</strong> <strong>Gas</strong> Annual(s),<br />
2007- January 2009, DOE/<strong>EIA</strong>-0131 (Washington, DC),<br />
http://www.eia.doe.gov/oil_gas/natural_gas/data_publications/<br />
natural_gas_annual/nga.html.<br />
Regional Transporters<br />
Colorado Interstate Pipeline<br />
Wyoming Interstate Pipeline<br />
Questar Overthrust Pipeline<br />
Questar Pipeline<br />
TransColorado Pipeline<br />
Cheyenne Hub<br />
Source: Energy Information Administration, Office of Oil and <strong>Gas</strong>, <strong>Natural</strong> <strong>Gas</strong> Division, <strong>Natural</strong> <strong>Gas</strong> <strong>Market</strong> Hubs Database, December <strong>2008</strong>.<br />
Energy Information Administration, Office of Oil and <strong>Gas</strong> – April 2009<br />
experience a small increase in average daily throughput<br />
volumes.<br />
The Sumas Center primarily supports the western U.S.<br />
natural gas market although its operational center is actually<br />
located in Canada near the British Columbia/Washington<br />
State border. It is a principal source for trading and<br />
transportation of Canadian natural gas flowing on the<br />
Northwest Pipeline Company system destined for the States<br />
of Washington, Oregon, and Idaho. The Sumas Center was<br />
the only market center that reported a decrease in average<br />
daily throughput volume over the period. However, it did<br />
experience a 10-percent increase in its customer base with<br />
two new pipeline interconnects and a 12-percent increase in<br />
interconnect capacity.<br />
Midwest Regional <strong>Centers</strong><br />
To Midwest <strong>Market</strong>s<br />
Rockies Express Pipeline<br />
Trailblazer Pipeline<br />
Cheyenne Plains Pipeline<br />
KM Interstate Pipeline<br />
The ANR Joliet Hub, located in northern Illinois, was the<br />
only one of the two market centers found in the Midwest<br />
Region that experienced any significant growth in its<br />
operations and transactions (Figure 1). Its average daily<br />
11
throughput volume increased by one-half while its total<br />
interconnection capacity grew by 38 percent (Table 2).<br />
Four of the 10 natural gas pipelines that interconnect at the<br />
Joliet Hub, Alliance Pipeline, <strong>Natural</strong> <strong>Gas</strong> Pipeline<br />
Company of America (NGPL), NICOR (Northern Illinois<br />
<strong>Gas</strong> Company), and NIPSCO (Northern Indiana <strong>Gas</strong><br />
Company) increased their access capacity. Though the<br />
NICOR Chicago Hub, the remaining market center in the<br />
region, added one more interconnection, its size was<br />
relatively small, and the reported average daily throughput<br />
volume since 2003 did not noticeably change.<br />
Neither the Joliet nor the Chicago hubs currently provide<br />
their customers access to the newest large capacity pipeline<br />
traversing the Midwest region, the Rockies Express Pipeline<br />
system (REX). The REX system crosses the State of Illinois<br />
well to the south of these two centers. If and when either of<br />
the two centers provides access to REX it will be indirectly,<br />
perhaps through the NGPL Pipeline, which interconnects<br />
with the REX in northeast Nebraska and interconnects with<br />
both centers in northern Illinois.<br />
12<br />
Trading and Price Reporting<br />
While many of the market centers referred to in this report have names similar to a number of natural gas trading points reported on in the<br />
trade press or posted on electronic future or spot market boards, they are not related operations. <strong>Market</strong> centers themselves are not the<br />
source of the price or volumetric information reported by these entities, although they do not prohibit their customers from reporting their<br />
trading volumes and prices to the public. In many cases, they welcome such reporting since it publicizes the liquidity of the trading area or<br />
of the market center itself.<br />
The volumes and prices publically quoted in the trade press are usually a compilation of trading activities carried out and reported by<br />
energy marketers, traders, and pipeline customers who agree to report any transactions they perform within a defined common trading area,<br />
to the publishers on a regular basis. Their incentive for doing so is that they recognize that this reporting by them and others helps to<br />
provide price transparency to the market and thereby a basis for future price setting. Spot and futures prices and volumes reported by the<br />
electronic trading platforms such as New York Mercantile Exchange (NYMEX), Intercontinental Exchange (ICE) or TradeSpark, among<br />
others, are based on trading activities held specifically on their platforms by their customers.<br />
Because the trading volumes reported by non-market center parties include trading areas beyond the market center, even though the<br />
“center/hub” labels are the same or similar, the estimated average daily volume (Table 2) provided through the actual market center does<br />
not agree with that reported in the trade press or electronic platform. For instance, the daily trading volume for the “Henry Hub” reported in<br />
the trade press often currently exceeds 1,600 million cubic feet per day (MMcf/d) while that reported by the center’s administrator as<br />
running through the hub on a daily basis in <strong>2008</strong> was only about 900 MMcf/d.<br />
While the primary business of a market center is the administrative processing and transporting of natural gas between interconnecting<br />
pipelines on behalf of traders and shippers, many market centers also provide their customers access to a proprietary Internet-based natural<br />
gas trading and nominations platform (Table 1). This service gives their customers the capability to transact much of their business with the<br />
market center online with relative ease. For instance, with it a shipper may quickly determine the amount of firm or interruptible capacity<br />
currently available through the center, submit nominations for available capacity, and then arrange for transportation of the gas.<br />
In addition, many of these market center online platforms also offer anonymous natural gas trading support services. Customers are<br />
provided details of the transaction, bid and ask prices are communicated between parties, and when a deal is consummated, the market<br />
center administrator handles the title transfer and other administrative details, including providing the operator of the center’s pipeline<br />
facilities with the physical flow details involved in the deal.<br />
Northeast Regional <strong>Centers</strong><br />
Energy Information Administration, Office of Oil and <strong>Gas</strong> – April 2009<br />
Only two market centers within the Northeast Region are<br />
currently operational, down from three in 2003. In 2005, the<br />
Ellisburg-Leidy Center, which served natural gas shippers<br />
delivering to markets in the New York and Pennsylvania<br />
areas, ended its operations. The National Fuel <strong>Gas</strong> Supply<br />
Company, a major regional interstate pipeline company and<br />
the administrator/operator of the Ellisburg-Leidy Center,<br />
cited a lack of trading activity and customers as the reasons<br />
for closing down the market center operation. Nonetheless,<br />
it continues to provide hub services within its normal<br />
pipeline system operations.<br />
The Dominion Hub is the larger of the two remaining<br />
market centers in the region (Figure 1). It provides<br />
interconnections with 15 intrastate and interstate pipelines as<br />
well as two pooling points (Table 2), an addition of one<br />
interconnection since 2003. The market center uses the<br />
entire Dominion Transmission Company pipeline grid,<br />
which has operations in Pennsylvania, New York, and Ohio,<br />
to serve its customers. It also has access to the 15 storage<br />
fields located on the Dominion system.
A major operational area of the Dominion <strong>Market</strong> Center is<br />
the Leidy area of north central Pennsylvania, a region of<br />
major pipeline connectivity in the Northeast Region. A<br />
number of major interstate pipelines traverse the general<br />
area including the Tennessee <strong>Gas</strong> Pipeline, Texas Eastern<br />
Transmission Pipeline, and Transcontinental <strong>Gas</strong> Pipeline,<br />
all of which are interconnected through the Dominion<br />
<strong>Market</strong> Center. In fact, these three systems, which have<br />
undergone expansions in the region since 2003, account for<br />
three of the six interconnections at the Dominion <strong>Market</strong><br />
Center that have increased in capacity between 2003 and<br />
<strong>2008</strong>. Although seven of the interconnections at the<br />
Dominion <strong>Market</strong> Center were downsized during the period<br />
for various reasons, the net additions to interconnection<br />
capacity produced a 42-percent increase over the 5-year<br />
span (Table 2).<br />
The other remaining market center in the Northeast region,<br />
the Iroquois <strong>Market</strong> Center provides shippers of primarily<br />
western Canadian natural gas with transportation and hub<br />
services between the New York/Canadian border and the<br />
New York metropolitan area (Figure 1). Between 2003 and<br />
2007, it experienced a 47-percent growth in estimated<br />
average daily throughput volume, although the supporting<br />
pipeline system itself did not undergo any significant<br />
expansion during the period. A large user of line-packing to<br />
maximize its daily throughput, the Iroquois Pipeline system<br />
provides the market center operations with available space<br />
to support its parking, loaning, and operational balancing<br />
services.<br />
The Iroquois <strong>Market</strong> Center provides access to only four<br />
interconnections besides its own supporting pipeline system.<br />
Since 2003, the only increase in interconnection capacity<br />
has been to add receipt capacity at one of the existing<br />
interconnects (Algonquin Pipeline).<br />
Canadian <strong>Market</strong> <strong>Centers</strong><br />
Of the nine market centers currently operating in Canada,<br />
six are located in the Province of Alberta, which is the<br />
dominant gas production area in Canada (Figure 1). These<br />
centers, which provide Alberta natural gas producers and<br />
shippers with trading opportunities and interhub<br />
transportation between the TransCanada (Nova) Pipeline<br />
system and the rest of Canada, all indicated that there were<br />
no appreciable changes in operational capabilities or their<br />
status since 2003 (Table 2). One of the principal reasons for<br />
this static condition was that the TransCanada Pipeline’s<br />
mainline system, which is the primary delivery<br />
interconnection, has actually decreased its overall system<br />
capacity between the Alberta border and eastern Canada<br />
because of lower shipper demand.<br />
Energy Information Administration, Office of Oil and <strong>Gas</strong> – April 2009<br />
The TransCanada (<strong>Market</strong>) Center, which administers the<br />
hub services provided on the TransCanada Pipeline System<br />
between Alberta and eastern Canada, itself reported only a<br />
2-percent change in its overall interconnect capacity,<br />
brought about by increases at several border points<br />
interconnecting with expanded U.S. pipeline systems.<br />
Only the Dawn <strong>Market</strong> Center, located in eastern Ontario,<br />
Canada (Figure 1), reported a significant change in its<br />
operational status, with its estimated average daily<br />
throughput increasing more than 85 percent since 2003.<br />
Moreover, total interconnect capacity more than doubled at<br />
the Dawn facility (Table 2) though it only added one new<br />
interconnection in the past 5 years. Of the nine existing<br />
interconnecting pipelines at the Dawn Center, only one did<br />
not add interconnect capacity during the same period.<br />
A major attraction of the Dawn Center has been its<br />
expanding underground storage base. Currently, the center<br />
has access to more than 150 Bcf of high-deliverability<br />
working gas storage capacity and 2 Bcf/d of storage<br />
withdrawal capability from its 18 storage pools, to serve its<br />
customers. And its location and interconnections along the<br />
TransCanada mainline, as well as its access to several major<br />
U.S. pipelines via Michigan, have made the Dawn Center<br />
convenient to both U.S. and Canadian natural gas shippers,<br />
contributing to its steady growth.<br />
Over the past 5 years one of the major contributors to the<br />
growth of the Dawn Center has been the expanding use of<br />
the Vector Pipeline system. The Vector Pipeline system<br />
serves as a conduit for western Canadian natural gas that has<br />
been processed at the Aux Sable plant in Illinois and<br />
destined for eastern Canada via the Dawn Center. The Dawn<br />
Center also provides customers shipping natural gas through<br />
the Empress Hub, located at the Alberta border, with<br />
interhub transfer services between Alberta (production) and<br />
Ontario (storage), arranging transportation on the<br />
TransCanada Pipeline system (see box, “<strong>Market</strong> Center<br />
Services”).<br />
Outlook<br />
While the number of market centers has not expanded<br />
significantly during the past 10 years, several new ones have<br />
been put in service located at strategic points on the pipeline<br />
grid. The latest, the White River hub located in western<br />
Colorado, can provide up to 2.6 Bcf/d of transportation<br />
service to producers, marketers, and shippers who need<br />
access to downstream markets for natural-gas volumes<br />
produced in the Piceance Basin.<br />
Besides the six proposed natural gas market centers listed on<br />
Table 3, there are several areas of the country that have the<br />
13
potential to accommodate new market center operations. For<br />
instance, with the expansion of the Rockies Express Pipeline<br />
through the Midwest, several major natural gas pipelines<br />
serving the northeast have made proposals to build new<br />
interconnections with the Rockies Express Pipeline, which<br />
is currently slated to end in the vicinity of Lebanon, in<br />
eastern Ohio. 15<br />
At least six major natural gas pipeline systems currently<br />
traverse the area around Lebanon, Ohio. Indeed, prior to<br />
1998 the East Ohio Pipeline Company operated a natural gas<br />
market center, which accommodated interconnects with<br />
many of these pipeline systems. However, because of a lack<br />
of trading interest at the site, it was closed in the late 1990s.<br />
Nevertheless, with the development of the large capacity<br />
Rockies Express Pipeline, with its flow of Rocky Mountain<br />
and other new Central Region sourced natural gas, there is a<br />
good possibility a new market center could develop in the<br />
area.<br />
Another area of potential market center development is in<br />
northern Louisiana. Currently, the Perryville Hub,<br />
15 The sponsors of the Rockies Express Pipeline have proposed<br />
extending the system as far east as New Jersey by 2010.<br />
14<br />
Energy Information Administration, Office of Oil and <strong>Gas</strong> – April 2009<br />
administered and operated by Centerpoint Energy Inc. is the<br />
only market center in the area (Figure 4). In 2007, an<br />
alternative to the Perryville Hub, the “Eagle Hub” was<br />
proposed by Lehman Brothers Partners Inc. However,<br />
because of the collapse of Lehman Brothers in <strong>2008</strong>, and the<br />
sale of its natural gas assets to EDF Development Inc, the<br />
project has been put on hold. The original proposal<br />
recognized the potential need for another market center in<br />
the northern Louisiana area, which could be acted on by<br />
another party in the future, especially if natural gas<br />
production in the Barnett shale area of east Texas continues<br />
to expand and development of shale gas in the Haynesville<br />
formation in northern Louisiana takes place as anticipated.<br />
Lastly, Enbridge Energy Partners LP, among others, has<br />
sought interest from area shippers in the possibility of<br />
creating additional market centers in the Carthage area of<br />
northeast Texas and in the Orange County area of southeast<br />
Texas, to accommodate production expansions. To date,<br />
however, not enough interest to open these new market<br />
centers has been found, but that may change in the future.


