


Create successful ePaper yourself
Turn your PDF publications into a flip-book with our unique Google optimized e-Paper software.
Testing and Debugging<br />
<strong>JavaScript</strong> debugging<br />
If you are not a completely new programmer, I am sure you must have spent some<br />
amount of time debugging your or someone else's code. Debugging is almost like an<br />
art form. Every language has different methods and challenges around debugging.<br />
<strong>JavaScript</strong> has traditionally been a difficult language to debug. I have personally<br />
spent days and nights of misery trying to debug badly-written <strong>JavaScript</strong> code<br />
using alert() functions. Fortunately, modern browsers such as Mozilla Firefox<br />
and Google Chrome have excellent developer tools to help debug <strong>JavaScript</strong> in<br />
the browser. There are IDEs like IntelliJ WebStorm with great debugging support<br />
for <strong>JavaScript</strong> and Node.js. In this chapter, we will focus primarily on Google<br />
Chrome's built-in developer tool. Firefox also supports the Firebug extension and<br />
has excellent built-in developer tools, but as they behave more or less the same as<br />
Google Chrome's Developer Tools (DevTools), we will discuss common debugging<br />
approaches that work in both of these tools.<br />
Before we talk about the specific debugging techniques, let's understand the type of<br />
errors that we would be interested in while we try to debug our code.<br />
Syntax errors<br />
When your code has something that does not confirm to the <strong>JavaScript</strong> language<br />
grammar, the interpreter rejects this piece of code. These are easy to catch if your<br />
IDE is helping you with syntax checking. Most modern IDEs help with these errors.<br />
Earlier, we discussed the usefulness of the tools such as JSLint and JSHint around<br />
catching syntax issues with your code. They analyze the code and flag errors in the<br />
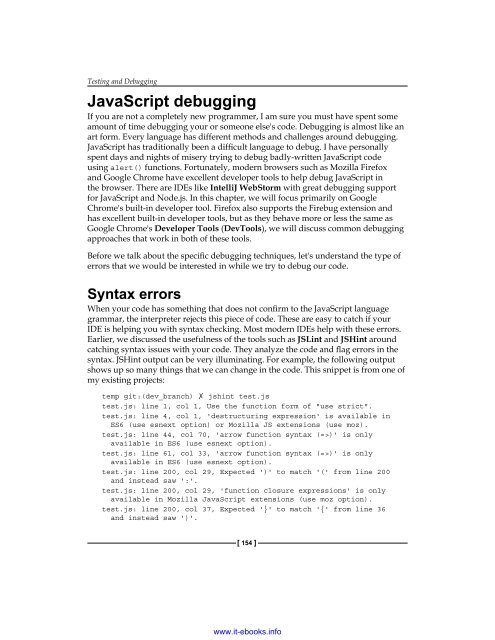
syntax. JSHint output can be very illuminating. For example, the following output<br />
shows up so many things that we can change in the code. This snippet is from one of<br />
my existing projects:<br />
temp git:(dev_branch) ✗ jshint test.js<br />
test.js: line 1, col 1, Use the function form of "use strict".<br />
test.js: line 4, col 1, 'destructuring expression' is available in<br />
ES6 (use esnext option) or Mozilla JS extensions (use moz).<br />
test.js: line 44, col 70, 'arrow function syntax (=>)' is only<br />
available in ES6 (use esnext option).<br />
test.js: line 61, col 33, 'arrow function syntax (=>)' is only<br />
available in ES6 (use esnext option).<br />
test.js: line 200, col 29, Expected ')' to match '(' from line 200<br />
and instead saw ':'.<br />
test.js: line 200, col 29, 'function closure expressions' is only<br />
available in Mozilla <strong>JavaScript</strong> extensions (use moz option).<br />
test.js: line 200, col 37, Expected '}' to match '{' from line 36<br />
and instead saw ')'.<br />
[ 154 ]<br />
www.it-ebooks.info