Uso de aguas residuales provenientes de una planta ... - UPRM
Uso de aguas residuales provenientes de una planta ... - UPRM
Uso de aguas residuales provenientes de una planta ... - UPRM

Create successful ePaper yourself
Turn your PDF publications into a flip-book with our unique Google optimized e-Paper software.
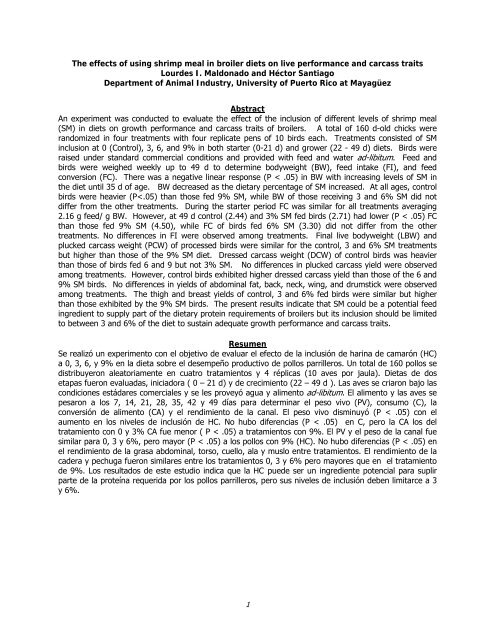
The effects of using shrimp meal in broiler diets on live performance and carcass traits<br />
Lour<strong>de</strong>s I. Maldonado and Héctor Santiago<br />
Department of Animal Industry, University of Puerto Rico at Mayagüez<br />
Abstract<br />
An experiment was conducted to evaluate the effect of the inclusion of different levels of shrimp meal<br />
(SM) in diets on growth performance and carcass traits of broilers. A total of 160 d-old chicks were<br />
randomized in four treatments with four replicate pens of 10 birds each. Treatments consisted of SM<br />
inclusion at 0 (Control), 3, 6, and 9% in both starter (0-21 d) and grower (22 - 49 d) diets. Birds were<br />
raised un<strong>de</strong>r standard commercial conditions and provi<strong>de</strong>d with feed and water ad-libitum. Feed and<br />
birds were weighed weekly up to 49 d to <strong>de</strong>termine bodyweight (BW), feed intake (FI), and feed<br />
conversion (FC). There was a negative linear response (P < .05) in BW with increasing levels of SM in<br />
the diet until 35 d of age. BW <strong>de</strong>creased as the dietary percentage of SM increased. At all ages, control<br />
birds were heavier (P
Introduction<br />
The broiler industry is the second largest agricultural sector of Puerto Rico. Broiler production<br />
costs here are higher than in other countries due to the fact that there is no local production of<br />
grains and most feed ingredients used in poultry diets are imported. Therefore, to reduce feed<br />
costs it is crucial to find novel feedstuffs that are feasible, available, economical, and of<br />
a<strong>de</strong>quate nutritional value, that can substitute for at least part of the imported ingredients<br />
conventionally used in broiler diets.<br />
A local aquaculture company produces annually some 1,800 tons of salt water shrimp. Since<br />
the heads comprise about 44% of whole raw shrimp (Meyers and Rutledge, 1971) we estimate<br />
that this company alone generates on the or<strong>de</strong>r of 800 tons of waste that is sent to land fills for<br />
disposal. Shrimp meal (SM), the dried waste of the shrimp industry, is comprised of heads,<br />
hulls, shrimp not suitable for market, and fish acci<strong>de</strong>ntally caught with shrimp during harvest.<br />
SM contains approximately 50% cru<strong>de</strong> protein on a dry matter basis (Rosenfeld et al., 1997 and<br />
Gernat, 2001) and could be a valuable feed ingredient to partially or totally replace soybean<br />
meal in broiler diets. Shrimp meal has been used successfully as a feed ingredient in diets of<br />
laying hens (Rosenfeld et al., 1997) and broilers (Singletary et al, 1935; Ewing, 1963; Damron<br />
et al., 1964; Ilian et al., 1985, and Islam et al., 1994; Gernat, 2001). In these studies the use<br />
of shrimp meal in broiler diets had no <strong>de</strong>trimental effect on performance and organoleptic<br />
properties of breast meat. However, no studies could be found evaluating the effects of the<br />
use of shrimp meal on other carcass traits.<br />
Materials and Methods<br />
Shrimp wastes were collected from the processing facilities of Eureka Marine Products in<br />
Dorado. Wastes were transferred to an 8’ x 8’ air steam dryer and dried at 65° C for 72 h. The<br />
dried wastes were groun<strong>de</strong>d to a particle size of 1.0 mm. A proximate analysis and amino acid<br />
profile were performed on the final product prior to diet formulation according to methods of<br />
AOAC (1990). A two phase feeding regime consisting of starter (0 to 21 d) and grower (22 to<br />
49 d) was used in the experiment. Diets were corn and soybean meal based and formulated to<br />
meet or exceed the NRC recommendation for broilers (NRC, 1994). The treatments consisted<br />
on inclusion of SM at 0 (control), 3, 6, and 9% of the diet to partially substitute the cru<strong>de</strong><br />
protein contributed by soybean meal.<br />
2
A total of 160 broiler chicks were raised un<strong>de</strong>r standard commercial conditions in an open-si<strong>de</strong>d<br />
poultry house at the Small Animal Research Farm in Lajas of the Department of Animal<br />
Industry. Birds were randomly assigned to 16 floor pens with four replicate pens per treatment.<br />
Chicks were raised un<strong>de</strong>r a 24 h of light photo regimen and provi<strong>de</strong>d with sufficient feed and<br />
water for ad-libitum consumption. Birds and feed were weighed at 7, 14, 21, 28, 35, 42, and 49<br />
d of age to <strong>de</strong>termine bodyweight (BW), feed intake (FI), and feed conversion (FC).<br />
At 49 d, four birds per replicate pen for a total of 16 per treatment were randomly selected,<br />
wing ban<strong>de</strong>d and kept 12 h prior to slaughter without access to feed. After feed withdrawal<br />
birds were weighed, exanguinated, scal<strong>de</strong>d, mechanically plucked, and manually eviscerated.<br />
Carcasses were chilled overnight in an ice-slush tank maintained at 0 °C. After chilling,<br />
carcasses were drained, reweighed, and cut into the following portions: wings, drumsticks,<br />
thighs, breast with ribs, back, and neck. Carcass parts and abdominal fats were weighted and<br />
the yield expressed as percentage of live bodyweight (LBW).<br />
Data were analyzed according to a Completely Randomized <strong>de</strong>sign by ANOVA using the GLM<br />
procedures of SAS ® (SAS Institute, 1990). The Tukey multiple comparison test was used to<br />
separate treatment means. All statements of significance are based on a probability of P< 0.05.<br />
Results and Discussion<br />
As shown in Table 1, growth performance of control birds was superior to that of those fed 9%<br />
SM diets. At all ages, control birds were significantly heavier than those fed 9% SM, while BW<br />
of those receiving 3 and 6% SM were intermediate; 3 % SM differed from the control at 7 d<br />
and again at 35 d, while at 42 d both 3 and 6% SM were superior to 9% SM. There was a<br />
significant negative linear response in BW with increasing levels of SM in the diet at all ages.<br />
BW <strong>de</strong>creased as the percentage of SM increased in the diet. No significant differences in FI<br />
were observed in either the starter or grower periods (Table 1). During the starter period FC<br />
was similar for all treatments averaging 2.16 overall and ranging from 1.94 to 2.33 (g feed/ g<br />
BW). At 49 d, control (2.44) and birds fed 3% SM (2.71) had significantly lower FC than those<br />
fed 9% SM (4.50), while FC of birds fed 6% SM (3.30) did not differ from the other treatments.<br />
Cunha et al. (2003a) found that 0, 3, 9 and 12% of SM inclusion in broiler diets resulted in no<br />
significant differences in FI or FC. Thus there is agreement with results of the present study in<br />
FI, but disagreement in the effects of higher levels of SM inclusion on FC. Those researchers<br />
3
observed a quadratic effect between BW and SM level wherein the best levels of inclusion were<br />
5.46, 5.87, and 6.16%.<br />
Table 1. The effect of SM inclu<strong>de</strong>d at different levels in broiler diets on body weight and feed conversion<br />
0% SM 3% SM 6% SM 9% SM<br />
Age (d) Body weight (g)<br />
1 42 a<br />
42 a<br />
42 a<br />
42 a<br />
7 139 a<br />
131 ab<br />
125 b<br />
125 b<br />
14 320 a<br />
285 ab<br />
296 ab<br />
261 b<br />
21 527 a<br />
479 ab<br />
459 ab<br />
430 b<br />
28 959 a<br />
852 ab<br />
840 ab<br />
761 b<br />
35 1,428 a<br />
1,305 ab<br />
1,261 b<br />
1,061 c<br />
42 1,860 a<br />
1,739 a<br />
1,669 a<br />
1,400 b<br />
49 2,365 a<br />
2,242 ab<br />
2,241 ab<br />
1,941 b<br />
Feed Convertion (g feed / g body weight)<br />
Starter (1 – 21 d) 1.94 a<br />
Grower (22 – 49 d) 2.44 a<br />
2.16 a<br />
2.33 a<br />
2.71 a<br />
3.30 ab<br />
a-b<br />
Means in a given row bearing different superscripts differ significantly at P < 0.05.<br />
2.20 a<br />
4.50 b<br />
The LBW and plucked carcass weight (PCW) of processed birds were similar for control, 3 and<br />
6%, but significantly higher than for those fed 9% SM (Table 2). Control dressed carcass<br />
weight (DCW) was significantly heavier than those of birds fed 6 and 9% SM. LBW, PCW, and<br />
DCW ten<strong>de</strong>d to <strong>de</strong>crease as the percentage inclusion of SM increased in the diet. No<br />
differences in plucked carcass yield were observed among treatments, values ranging from 88.7<br />
to 89.7 %. However, a higher dressed carcass yield was observed for the control birds than for<br />
those of 6 and 9% SM. As shown in Table 3, no significant differences in yields of abdominal<br />
fat, back, neck, wing, and drumsticks were observed among treatments. The breast yield of<br />
control, 3% and 6% fed birds were similar but significantly higher than that of 9% SM birds.<br />
The same was true of thigh yield except that the difference between the control and 9% SM<br />
was not significant. In a similar experiment, Cunha et al. (2003b) reported no significant<br />
differences in breast, thigh, and drumstick yields of broilers feed 0, 3, 6, 9 and 12% SM.<br />
Conclusion<br />
The results of this study indicate that SM shows promise as a potential feed ingredient to supply<br />
part of the dietary protein requirements of broilers, but its inclusion should be limited to<br />
between 3 and 6% of the diet in or<strong>de</strong>r not to sacrifice growth performance and <strong>de</strong>sirable<br />
carcass traits.<br />
4
Table 2. The effect of SM inclu<strong>de</strong>d at different levels in broiler diets on live body weight, lucked<br />
weight, hot dressed weight, cold dressed weight and percentage plucked, hot and cold<br />
dressed yield 1, 2 .<br />
Trait 0% SM 3% SM 6% SM 9% SM<br />
Live body weight 3 (g)<br />
Plucked weight 4 (g)<br />
Hot dressed weight 5 (g)<br />
Cold dressed weight 6 (g)<br />
2,548 a<br />
2,285 a<br />
1,771 a<br />
1,887 a<br />
2,365 a<br />
2,179 a<br />
1,639 ab<br />
1,747 ab<br />
2,319 a<br />
2,063 a<br />
1,546 b<br />
1,649 b<br />
1,884 b<br />
1,683 b<br />
1,236 c<br />
1,331 c<br />
Plucked carcass yield (%) 7 89.7 89.5 88.8 88.7<br />
Hot dressed yield 8 (%)<br />
Cold dressed yield 9 (%)<br />
69.5 a<br />
74.0 a<br />
67.1 ab<br />
71.6 ab<br />
66.5 ab<br />
70.9 b<br />
a-b<br />
Means in a given row bearing different superscripts differ significantly at P < 0.05.<br />
1<br />
Values given in this table correspond to least-squares means obtained from ANOVA and their pooled SEM.<br />
2<br />
n = 17 birds per mean<br />
3<br />
Body weight prior to slaughter following feed and water <strong>de</strong>privation for 10h<br />
4<br />
Carcass weight after exanguination prior to evisceration with legs and neck left in the carcass.<br />
5<br />
Without giblets but with abdominal fat pad left in the carcass.<br />
6<br />
Without giblets after chilled in an ice-slush tank for 24 h<br />
7<br />
Plucked carcass weight / live BW after feed and water <strong>de</strong>privation x 100.<br />
8<br />
Hot carcass weight / live BW after feed and water <strong>de</strong>privation x 100.<br />
9<br />
Cold carcass weight / live BW after feed and water <strong>de</strong>privation x 100.<br />
Table 3. The effect of SM inclu<strong>de</strong>d at different levels in broiler diets on carcass cuts and<br />
abdominal fat yields as percentage of live weight 1, 2 .<br />
Carcass Cut 0% SM 3% SM 6% SM 9% SM<br />
Neck 4.1 4.4 4.2 4.1<br />
Feet 20.2 b 22.4 a 22.3 a 22.6 a<br />
Back 15.2 13.7 13.7 14.5<br />
Wing 16.7 16.5 15.8 16.9<br />
Thigh 23.4 ab 24.8 a 24.7 a 21.3 b<br />
Drumstick 22.5 22.3 22.4 24.2<br />
Breast 52.2 a 49.3 a 48.2 a 40.3 b<br />
Abdominal fats 0.53 0.43 0.45 0.55<br />
a-b Means in a given row bearing different superscripts differ significantly at P < 0.05.<br />
1 Values given in this table correspond to least-squares means obtained from ANOVA and their pooled SEM.<br />
2 n = 10 birds per mean<br />
5<br />
64.9 b<br />
70.2 b
Shrimp Industry Organic Wastes<br />
14 d - old broiler chicks<br />
6
Literature Cited<br />
Association of Official Analytical Chemists. AOAC. 1990. Official Methods of Analysis. Williams, J.<br />
(ed). Arlington, VA.<br />
Cunha, F. S., C. B. V. Rabello, M. C. M. M. Ludke, W. M. Dutra, R. R. S. Loureiro, R. C. Lucas, L.<br />
Piaggio, and E. R. Prates. 2003a. Use of shrimp meal in the feeding of broiler chickens. IX<br />
World Conference on Animal Production. Porto Alegre, Brasil.<br />
Cunha, F. S., C. B. V. Rabello, M. C. M. M. Ludke, W. M. Dutra, V. R. B. A. Rocha, C. R. G. <strong>de</strong><br />
Freitas, and F. B. Lima. 2003b. Effect of shrimp meal on carcass yield in broiler chickens. IX<br />
World Conference on Animal Production. Porto Alegre, Brasil.<br />
Damron, B.L., P.W. Waldrup, and R.H. Harms. 1964. Evaluation of shrimp meal in broiler diets.<br />
Poultry Science Mimeograph Series No. PY65-1. University of Florida, Gainesville, Fl.<br />
Ewing, R., 1963. Handbook of Poultry Nutrition. J.J. Little and Ives Co. South Pasa<strong>de</strong>na, CA.<br />
Gernat, A.G. 2001. The effect of using different levels of shrimp meal in laying hen diets.<br />
Poultry Sci. 80: 633-636.<br />
Ilian, M.A., C.A. Bond, A.J. Salam, and S. Al-Hooti. 1985. Evaluation of shrimp by-catch meal as<br />
broiler feedstuff. Nutr. Rep. Int. 31: 487-492.<br />
Islam, M.A., M.D. Hossian, S. M. Baibul, and M.A.R. Howli<strong>de</strong>r. 1994 Unconventional feed for<br />
broilers. Indian Vet. J. 74: 775-780.<br />
Meyers, S.P. and J.E. Rutledge, 1971. Shrimp meal – A new look at an old product. Feedstuffs<br />
43 (49):31.<br />
National Research Council (NRC), 1994. Nutrient Requirements of Poultry. 9 th rev. ed.<br />
National Aca<strong>de</strong>my Press, Washington, D.C.<br />
Rosenfeld, D.J., A.G. Gernat, J.D. Marcano, J.G. Murillo, G.H. Lopez, and J.A. Flores. 1997. The<br />
effect of using different levels of shrimp meal in broiler diets. Poultry Sci. 76: 581-587.<br />
SAS Institute, 1990. SAS ® / STAT gui<strong>de</strong> for personal computers. Version 6.12 edition. SAS<br />
Institute Inc. Cary, NC.<br />
Singletary, J. R., D.J. Bray, and H.J. Davis. 1935. Shrimp meal as a protein supplement for<br />
chickens. Page 31 in: Bulletin 262. Louisiana State University, Baton Rouge, LA.<br />
7
Viability of poultry litter compost on growth of Brachiaria brizantha cv. Mulato and pollutant<br />
effects in the soil<br />
Emérita García Pizarro and Eli<strong>de</strong> Valencia<br />
Department of Agronomy and Soils, University of Puerto Rico, Mayagüez<br />
Abstract<br />
Composted poultry litter (CPL) applied to field crops can be an important source of nutrients and organic<br />
matter to improve soil quality. However, little is known on the effects of CPL on tiller dynamics and<br />
forage yield of the tropical grass Brachiaria brizantha cv. mulatto. A study was conducted in the fall of<br />
2003 and spring of 2004 to evaluate four CPL rates and their influence on number of tillers, herbage<br />
mass and cru<strong>de</strong> protein (CP) concentration of cv. Mulato at three successive harvests at 30-d intervals.<br />
Treatments inclu<strong>de</strong>d 0 (Control; C), 16 (low; L), 31 (Medium, M), and 62 kg/ha of N (High; H) CPL rates.<br />
Grass seedlings (6-wk old) were established in pots (1-gl) filled with soil of the Consumo type (Fine,<br />
mixed, semi-active, isohyperthermic Typic Haplohumults). Composted poultry litter was broadcastapplied<br />
and incorporated into the first 2-cm of the soil in the pots. Plants were irrigated as nee<strong>de</strong>d. From<br />
first to third harvest, there was a minimal increase in tiller count (8.4 to 11) for the control.<br />
Corresponding increases observed for the L and M CPL rates were 14 to 28 and 21 to 28 tillers/plant.<br />
However, the magnitu<strong>de</strong> of change in tiller counts at the H CPL rate was much greater (21, 23, and 44)<br />
at first, second and third harvest, respectively. There was also a linear effect (P
Introduction<br />
The local livestock industries are <strong>de</strong>pen<strong>de</strong>nt on tropical pastures to meet their nutritional<br />
<strong>de</strong>mand. Nitrogen is the most limiting nutrient for pasture production in Puerto Rico. Most of<br />
the soils used for pastures are mainly acidic (Oxisols and Ultisols). These soils have low organic<br />
matter content, and are prone to erosion. Grass production relies on inorganic fertilizers, thus<br />
increasing cost of production. Nitrate leaching and subsurface lateral flow toward streams and<br />
rivers is a major cause of contamination of groundwater and other water resources. Phosphorus<br />
is also a major concern (Havlin et al., 1990). According to Hornik, (1992), the quality of soil<br />
has traditionally been associated mainly with its productivity. This <strong>de</strong>finition has now been<br />
expan<strong>de</strong>d to inclu<strong>de</strong> the capacity of a soil to function within ecosystem boundaries to sustain<br />
biological productivity, maintain environmental quality, and promote plant and animal health.<br />
An alternative for improving soil quality is the use of compost.<br />
Poultry litter (PL) is generated in large quantities on the island. The Department of Agriculture<br />
of Puerto Rico reports an average yearly population of 8.2 million chickens which yield<br />
approximately 71,500 metric tons of manure (Muñoz et al., 1990) which represent an<br />
alternative to use for organic matter maintenance of low fertility soils. According to Martinez<br />
and Guzman (1999), composting is a cost effective and environmentally sound alternative for PL<br />
recycling. On clay soils, good quality compost can improve soil structure, reduce surface<br />
crusting and compaction, promote drainage, and provi<strong>de</strong> much nee<strong>de</strong>d nutrients. In sandy soils,<br />
compost increases water and nutrient retention, supplies nutrients, and increases microbial<br />
activity.<br />
In an evaluation of time and mo<strong>de</strong> of application of chicken manure for <strong>planta</strong>in production, an<br />
adverse effect was observed during germination with the application of 7.26 kg manure per<br />
plant at planting (Muñoz and Martínez, 1991). In other studies PL was shown to promote faster<br />
turf establishment, improve turf <strong>de</strong>nsity and color, increase root growth, and lower the<br />
requirements of inorganic fertilizer and irrigation (Landschoot, 1996). Composts can supply all<br />
or most of the turf’s nutrient requirement (i.e. N, P, S, K, Fe, Zn, Cu, and Mg). Studies with<br />
biosolids show that only about 10 percent of the N is available to plants during the first growing<br />
season. Certain types of compost have a high concentration of soluble salts, such as those<br />
ma<strong>de</strong> with spent animal manures. Those salts increase the electrical conductivity of the soil with<br />
compost additions, sometimes approaching limits consi<strong>de</strong>red <strong>de</strong>trimental to crop growth<br />
(Martínez and Guzmán, 1999; Landschoot, 1996). Another problem is its variable pH as very<br />
9
high (>8.5) or very low (
Results and Discussion<br />
Table 1. Composition of soil analyzed at two <strong>de</strong>pths (Fine, mixed, semiactive, isohyperthermic<br />
Typic Haplohumults) and of composted poultry litter (CPL).<br />
Sample Organic Matter * K * Mg * Ca * N * P ** CEC *** pH<br />
Soil<br />
0-4” <strong>de</strong>pth 2.1 3.1 21.1 49.6 .2 3 21.4 5.5<br />
4-6” <strong>de</strong>pth 2.6 6.7 25.2 57.7 .2 21 22.2 6.3<br />
Poultry Litter 9.9 65.1 14.8 20.1 2 238 46.3 9.1<br />
* Values are in percent<br />
** P values are in ppm<br />
*** Values are in meq/100g<br />
Table 2. Micro-nutrients and sulfur composition of soil at two <strong>de</strong>pths and of composted poultry<br />
litter (CPL).<br />
Metal (ppm) 0-4Ӡ 4-6Ӡ<br />
Soil CPL<br />
Sulfur 139 322 964<br />
Zinc 2.4 5.4 58.9<br />
Manganese 55 84 126<br />
Iron 31 39 60<br />
Copper 3.9 4.5 4.9<br />
Boron 0.3 0.8 3.8<br />
† Soil <strong>de</strong>pth<br />
There were significant (P
was minimal increase in number of tillers (8.4 to 11) in the control treatment without CPL.<br />
Similar increases were observed for the L and M rates. Major changes, however, were noted<br />
for the H rate (21, 23, and 44 tillers per plant) at first, second and third harvest, respectively<br />
(Figure 1).<br />
Figure 1. Number of tillers per plant for four CPL treatments at 30 (A), 60 (B) and 90-d (C)<br />
Treatments<br />
High<br />
Medium<br />
Low<br />
Control<br />
harvests.<br />
0 20 40 60 80 100<br />
Yield gram/plot<br />
A B C<br />
Figure. 2. Dry matter yield (g/plot) for four CPL treatments at 30 (A), 60 (B) and 90-d (C)<br />
harvest..<br />
12
There was also a linear effect of CPL rates on dry matter (DM) yield (g/plant). For the control,<br />
there were no changes in DM yield from first to last harvest (average of 16 g per plant). For<br />
the L and M rates of CPL minimal changes in dry weight of plants were observed from the first<br />
to third harvest. However, at the H rate of CPL, there were major changes in dry matter yield.<br />
Yields per plant of 31, 56, 81 g at first, second, and third harvest, respectively were recor<strong>de</strong>d<br />
(Figure 2). The increase in DM at third harvest is highly correlated to number of tillers (44<br />
tillers/plant). There were differences in CP concentration of cv. Mulato with increasing<br />
application of CPL. Cru<strong>de</strong> protein averaged 7.2, 6.6, 7.2, and 9.1% for the C, L, M, and H rates,<br />
respectively. Thus there was nearly a 2 percentage units increase in CP with the H rate of CPL<br />
over C.<br />
Conclusions<br />
Our results show positive linear responses for both number of tiller and DM yield of cv. Mulato<br />
to the high rate of CPL (62 kg/ha N). The increased DM yield due to the H CPL rate compared<br />
to that of the control at the third harvest may indicate mineralization of N and more N available<br />
for plant use. This gives CPL the quality of a slow release fertilizer. The two percentage units<br />
increase observed in CP with addition of the H rate of CPL indicates that CPL could serve to<br />
increase the nutritive value of cv. Mulato. Soil analysis is nee<strong>de</strong>d to <strong>de</strong>termine the<br />
corresponding changes in soil pH, and P and other mineral accumulations in the soil. Because<br />
of the slow release of N from CPL, there would be less leachate of N in the system. An<br />
important aspect of this study is that cv. Mulato or other tropical grasses can serve as a sink for<br />
this nutrient-rich compost and also provi<strong>de</strong> an environmentally acceptable and hopefully use of<br />
poultry litter compost.<br />
13
Brachiaria brizantha cv. Mulato Mulato grass seedling (6 -wks old).<br />
Brachiaria brizantha first day of experiment Brachiaria brizantha on the 30 th day.<br />
Plant appearance after each treatments, Control, Medium, Low and High rates<br />
14
Literature Cited<br />
AOAC. 1990. Official Methods of Analysis. 15 th Ed. Association of Official Analytical Chemist.<br />
Arlington, VA.<br />
Havlin JL, D.E. kissel DE, and L.D Maddux. 1990. Crop rotation and tillage effects on soil organic<br />
carbon and nitrogen. Soil Sci. Soc.Am. J. 54: 448-452.<br />
Hornik SB (1992) Factor affecting the nutritional quality of crops. Am. J. Altern. Agric 7:63-68<br />
Landschoot, P. 1996. Using compost to improve turf performance. Pennsylvania State<br />
University. Technical Bulletin. College of Agricultural Sciences Cooperative Extension Services.<br />
Martinez, G. and J.L. Guzman. 1999. Chemical and physical properties of two tropical soils<br />
treated with sewage sludge compost. J. Agric. Univ. PR. 83:103-121.<br />
Muñoz, M. A., and G. Martinez, 1991. Chicken, manure: An organic fertilizer for <strong>planta</strong>ins ( Musa<br />
accuminata x M. balbisiana AAB). Proc. Caribbean Food Crops Society 27:225-233, Roseau,<br />
Dominica.<br />
Muñoz, M., O. Colberg and J.A. Dumas. 1990. Chicken Manure as an Organic<br />
Fertilizer.J. Agric. Univ. P.R. 74: 139-145.<br />
SAS Institute. 1990. SAS/STAT® User’s Gui<strong>de</strong> (Release 8.1). SAS Inst. Inc., Cary, N.C. 1686<br />
pp.<br />
15
Fermentation characteristics and aerobic stability of orange pulp silage treated with urea<br />
Jonael Bosques Mén<strong>de</strong>z, Abner A. Rodríguez and Danilo Cianzio<br />
Department of Animal Industry, University of Puerto Rico, Mayagüez Campus<br />
Abstract<br />
The objective of this study was to <strong>de</strong>termine the fermentation characteristics of orange pulp (OP) treated<br />
with urea. The aerobic stability of fresh and fermented OP was also evaluated. The four treatments<br />
tested were OP without urea and with 1, 3, and 5% urea (w/w). Mixtures were fermented (N=3) in<br />
micro-silos for 30 and 60 d. Samples from each treatment were collected at 0, 30 and 60 d to <strong>de</strong>termine<br />
pH, chemical composition and fermentation products. Results showed that it is possible to ferment OP<br />
for 30 or 60 d without affecting the original chemical composition of the fresh residue. After 30 and 60 d<br />
of ensiling, acetic acid content was similar (P
Introduction<br />
Orange pulp (OP) is an organic waste resulting from the operation of a juice processing plant.<br />
In Puerto Rico, this by-product has been partially used in direct feeding to dairy cows, or<br />
otherwise disposed of in landfills, a practice that represents increased operational costs for the<br />
industry and a source of environmental pollution for the island. The orange juice plant<br />
“Productores <strong>de</strong> Citrícos <strong>de</strong> la Montaña”, located in the center of the island, produces in a<br />
normal day of operation 25m 3 of wet citrus pulp. Therefore, alternatives for the disposal of this<br />
by-product need to be evaluated. Silage production has been i<strong>de</strong>ntified as one such possible<br />
alternative. However, the combined effect of high water soluble carbohydrates content of the<br />
citrus pulp and the high temperatures of the local tropical environment could lead to rapid<br />
<strong>de</strong>terioration of the fresh material, an un<strong>de</strong>sirable type of fermentation (alcoholic), and poor<br />
aerobic stability of the fermented waste. The practice of adding a non-protein nitrogen source<br />
has been reported to improve the fermentation characteristics and aerobic stability of grass<br />
silage (Woolford, 1990), but there is limited information regarding the use of urea as an<br />
additive on the ensiling characteristics of OP. The objective of this study was to <strong>de</strong>termine the<br />
fermentation characteristics of OP silage treated with 3 levels of urea. The aerobic stability of<br />
fresh and fermented OP was also <strong>de</strong>termined.<br />
Materials and Methods<br />
The study was conducted in the Animal Nutrition Laboratory, University of Puerto Rico,<br />
Mayagüez Campus. The organic waste was obtained from the “Productores <strong>de</strong> Cítricos <strong>de</strong> la<br />
Montaña” processing plant. For the fermentation studies, OP was fermented alone or mixed<br />
with urea (non-protein nitrogen source) at three different levels; 1, 3, and 5 % (w/w). Mixtures<br />
were allowed to ferment in PVC lab micro-silo (1.2 kg capacity) for 30 and 60 days (Fig. 1).<br />
Triplicate samples from each treatment and length of fermentation were analyzed to <strong>de</strong>termine<br />
pH, chemical composition (AOAC, 1991), and fermentation end-products. Data were analyzed<br />
as a completely random <strong>de</strong>sign with a 4 (levels of urea, 0, 1, 3, and 5 %) by 3 (length of<br />
fermentation, 0, 30, and 60 d) factorial arrangement of treatments (Steel and Torrie, 1980)<br />
using the General Lineal Mo<strong>de</strong>l subroutine of SAS (1990). The Bonferroni t-test was used for<br />
separation of means. To <strong>de</strong>termine the aerobic stability of the fresh residue and fermented<br />
product treated with or without urea, triplicate samples (2 kg) of fresh or fermented OP were<br />
place into styrofoam containers lined with plastic and exposed to air for 6 days (Fig. 2).<br />
Samples were collected at 0, 1, 3, 6 (fermented) and 9 (fresh material only) d to <strong>de</strong>termine pH,<br />
17
and yeast and mold (YM) populations. Temperature was monitored daily. Fresh and fermented<br />
material recovery percentage was calculated form each time of exposure. Statistical analysis of<br />
the pH and YM populations data was performed as a completely randomized <strong>de</strong>sign with a 4<br />
(levels of urea) by 4 or 5 (periods of aerobic exposure) factorial arrangement of treatments<br />
(Steel and Torrie, 1980) using the General Lineal Mo<strong>de</strong>l subroutine of SAS (1990). The mo<strong>de</strong>ls<br />
for temperature and OP recovery percentage were similar except that 7 (temperature) and 3 (<br />
fermented) or 4 (fresh) periods of aerobic exposure were utilized, respectively. For all mo<strong>de</strong>ls,<br />
mean separation was performed by Bonferroni t-test.<br />
Fermentation Characteristics Results and Discussion<br />
For both lengths of fermentation pH was lower (P
During the whole aerobic exposure period pH was lower (P
Fresh Orange Pulp<br />
Anaerobic Fermentation (30 and 60 days)<br />
Orange Pulp Silage<br />
Figure 1. Orange pulp ensiling process<br />
20
Table 2. Stability of fresh and fermented orange pulp treated with urea exposed to aerobic<br />
conditions during 6 days.<br />
Component Aerobic exposure (d) Fresh Orange Pulp<br />
pH 0 3.76<br />
1 3.74<br />
3 3.71<br />
6 3.38<br />
9 3.23<br />
Temperature, °C 0 25.53 d<br />
1 38.88 a<br />
3 37.40 b<br />
6 30.37 c<br />
9 32.59 c<br />
Yeast and Molds (ufc/g) 0 4.39 c<br />
1 6.15 b<br />
3 7.71 a<br />
6 6.52 b<br />
9 7.68 a<br />
Organic Pulp Recovery (%) 1 95.83 a<br />
3 87.30 b<br />
6 82.00 bc<br />
9 77.93 c<br />
Urea (%)<br />
Control 1 3 5<br />
pH 0 3.36 c 3.78 b 4.05 ab 4.15 a<br />
1 3.33 c 3.75 c 4.00 c 3.92 c<br />
3 4.00 b 4.34 a 4.30 a 4.38 a<br />
6 3.44 c 4.63 b 4.67 b 5.28 a<br />
Temperature, °C 0 22.00 22.16 22.01 22.37<br />
1 27.04 27.22 26.50 26.50<br />
3 32.22 a 32.38 a 30.42 b 27.43 b<br />
6 29.66 a 31.67 a,b 30.19 a 28.75 b,c<br />
Yeast and Molds (ufc/g) 0 3.05 a 3.83 a 2.57 b 1.45 c<br />
1 5.67 a 3.99 b 2.17 c 1.82 d<br />
3 8.25 a 5.53 c 6.63 b 5.78 c<br />
6 7.16 c 8.83 b 9.58 a 9.16 a<br />
Organic Pulp Recovery (%) 1 88.56 90.00 86.43 89.86<br />
3 87.76 88.09 88.42 89.42<br />
6 85.21 84.44 87.04 86.25<br />
a,b,c, Means in the same row differ (P
Day 0<br />
Day 3<br />
Day 9<br />
Day 1<br />
Day 6<br />
Figure 2. Deterioration of fresh orange pulp exposed to air during 9 days<br />
22
Conclusions<br />
It is possible to ferment OP during 30 or 60 d without greatly affecting the nutritive profile of<br />
the fresh product. Deterioration of fresh OP increased directly with length of aerobic exposure.<br />
Addition of urea improved the quality of the silage and its aerobic.<br />
Literature Cited<br />
AOAC. 1991. Official Methods of Analysis. Association of Official Analytical Chemist, Washington,<br />
D.C.<br />
Crawshaw, R. 2001. Co-product Feeds. Animal feeds from the food and drinks industries.<br />
Nottingham University Press. Nottingham, NG11 OAX, UK.<br />
SAS (1990). SAS User’s Gui<strong>de</strong>: Statistics. SAS Inst., Cary, N.C.<br />
Ting, S.V. and J.A. Attaway. 1971. Citurs fruits. In: The biochemistry of Fruits and their<br />
Products. Vol-2, ED. A.C. Hulme, Aca<strong>de</strong>mic Press.<br />
Woolford, M.K. 1990. The <strong>de</strong>trimental effect of air on silage. J. Appl. Bact. 68:101.<br />
23
Fermentation and aerobic stability of silages ma<strong>de</strong> of rice hulls hydrated with milk<br />
Maritere Crespo, Angel A. Custodio and Abner A. Rodríguez<br />
Department of Animal Industry, University of Puerto Rico, Mayagüez<br />
Abstract<br />
In Puerto Rico, milk (M) that does not meet minimum standards for human consumption is rejected and<br />
dumped in the waste lagoons of dairy farms, which contributes to pollution and constitutes a loss of<br />
unutilized nutrients. Rice hulls (RH), although of low nutritional value, are in abundant supply and<br />
accessible especially in the most intensive dairy farming zone of the island and may be used to recycle<br />
the milk as silage. The purpose of the present study was to evaluate the quality and aerobic stability of<br />
silages ma<strong>de</strong> from rice hulls hydrated with different levels of milk. The experiment was performed with<br />
seven treatments: 1) Control (39%water 61% rice hulls w/w), 2) 35M:65RH, 3) 42M:58RH, 4)<br />
45M:55RH, 5) 50M:50RH 6) 60M:40RH and 7) 70M:30RH w/w, ensiled in micro-silos of PVC pipes in<br />
triplicate. Silos were opened after 14 and 28 days. To evaluate quality, pH and fermentation products<br />
were measured in three samples from each treatment, at 0, 14 and 28d. For the aerobic stability<br />
<strong>de</strong>termination, pH and temperature were measured the day the silo was opened and for the next three<br />
days. An analysis of variance was performed with treatment and days of fermentation as in<strong>de</strong>pen<strong>de</strong>nt<br />
variables. Results showed a pH level of about 3.8 at 14d and 3.9 at 28d for all treatments with 50%M<br />
or more. Major fermentation product was lactic acid in all treatments except the control, in which<br />
butyric acid was more abundant. Lactic acid concentration was highest (P
los 14 días. Las concentraciones <strong>de</strong> los ácidos butírico, propiónico, acético e isobutírico permanecieron<br />
por <strong>de</strong>bajo <strong>de</strong> 0.5% en todos los tratamientos. A las 24 horas <strong>de</strong> exposición al aire la temperatura<br />
aumentó <strong>de</strong> 6 a 17°C (P
ambient temperature that ranged from 27 to 30 °C. Triplicates were prepared for each<br />
treatment and sampled at 0, 14 and 28 days of fermentation. Samples were analyzed for pH<br />
immediately after opening each silo (Figure 3) and frozen to be sent later to Dairy One Forage<br />
Lab in Ithaca, New York, for <strong>de</strong>termination of fermentation end-products.<br />
To <strong>de</strong>termine the stability of fermented rice hulls to aerobic exposure, 500g samples of silage<br />
were placed in styrofoam containers lined with plastic bags (Figure 4) and exposed to air for 3<br />
days. Temperature of the silage was measured at days 0, 1, 2, and 3 while pH was measured<br />
at days 0, 1, and 3 of aerobic exposure. Dry matter recovery at days 1 and 3 of aerobic<br />
exposition was calculated as the difference in total dry matter relative to the initial quantity.<br />
Analyses of variance with treatment and days of fermentation as in<strong>de</strong>pen<strong>de</strong>nt variables were<br />
performed using SAS GLM procedure (SAS, 1990). Differences among means were evaluated<br />
using Bonferroni comparisons.<br />
Fermentation Characteristics Results and Discussion<br />
The high pH and very low acetic acid content (Table 1) of the control silage <strong>de</strong>monstrate that it<br />
did not ferment well. Relatively high butyric acid of this silage is indicative of protein<br />
<strong>de</strong>gradation due to lack of available carbohydrates in rice hulls. For all treatments with 50% of<br />
milk or more, average pH level was about 3.8 at 14d and 3.9 at 28d. Major fermentation<br />
product was lactic acid in all silages except the control, in which butyric acid although in low<br />
concentration, was the most abundant. Lactic acid concentration was highest (P
emained high at days two and three. The increment of temperature upon aerobic exposure<br />
was directly related to the level of milk ad<strong>de</strong>d, with the highest increase observed in silage<br />
with 70%M. After three days of aerobic exposure silages that contained milk were badly<br />
damaged. Thus, mixtures of rice hulls and milk in proportions ranging from 65:35 to 40:60<br />
showed a good fermentation, but the resulting silages <strong>de</strong>teriorated in less than 3 days upon<br />
aerobic exposure.<br />
Table 1. Chemical analysis at 14 and 28 days of fermentation of silages from rice hulls hydrated<br />
with varying proportions of milk<br />
Organic 2<br />
Inorganic 2 Lactic 2 Acetic 2 Butyric 2<br />
Treatments 1 DM (%) pH matter matter acid acid acid<br />
Fermentation Length (14 d)<br />
Control 56.64 5.17 84.30 15.64 0.02 0.00 0.20<br />
2 59.49 3.84 85.05 14.94 1.26 0.14 0.00<br />
3 59.55 4.02 85.56 14.43 1.32 0.14 0.02<br />
4 56.07 3.97 85.16 14.83 1.38 0.14 0.02<br />
5 54.91 3.80 85.90 14.10 2.16 0.15 0.02<br />
6 48.67 3.78 84.91 15.08 1.91 0.10 0.02<br />
7 34.91 3.68 85.94 14.06 1.76 0.09 0.01<br />
Fermentation Length (28 d)<br />
Control 51.13 4.97 83.66 16.33 0.00 0.16 0.32<br />
2 61.89 4.06 84.81 15.19 1.34 0.09 0.02<br />
3 59.57 4.04 85.97 14.69 1.47 0.13 0.08<br />
4 56.62 4.02 85.09 14.91 1.47 0.15 0.02<br />
5 56.85 3.75 85.27 14.72 2.11 0.18 0.04<br />
6 51.03 3.93 84.14 15.85 1.99 0.10 0.03<br />
7 46.23 3.74 84.71 15.28 1.56 0.09 0.01<br />
1 Control had 39% water and 61% rice hulls, treatments 2,3,4,5,6, and 7 had 35,42,45,50,60, and 70% milk (w/w), respectively.<br />
2 Dry matter basis<br />
Table 2. Change in pH over three days of aerobic exposure of silages ma<strong>de</strong> of rice hulls<br />
hydrated with varying proportions of milk<br />
Days of air Treatments<br />
exposure Control 2 3 4 5 6 7<br />
Fermentation Length (14 d)<br />
0 5.17 3.84 4.02 3.97 3.80 3.78 3.68<br />
1 5.19 4.77 4.10 4.05 3.92 5.75 5.95<br />
3 6.69 6.34 6.52 6.61 6.26 8.05 7.69<br />
Fermentation Length (28 d)<br />
0 4.97 4.06 4.04 4.02 3.75 3.93 3.74<br />
1 4.78 4.12 4.08 3.97 3.83 3.81 5.53<br />
3 6.76 6.21 5.48 6.42 4.66 6.68 7.84<br />
1 Control had 39% water and 61% rice hulls, treatments 2,3,4,5,6, and 7 had 35,42,45,50,60, and 70% milk (w/w), respectively<br />
27
Table 3 Temperature (°C) change from day 0 to day 3 of aerobic exposure silages ma<strong>de</strong> of rice<br />
hulls hydrated with varying proportions of milk<br />
Days of air Treatments<br />
exposure Control 2 3 4 5 6 7<br />
Fermentation Length (14 d)<br />
0 25.40 25.76 25.93 25.26 25.55 25.92 25.55<br />
1 26.66 37.40 32.23 30.76 37.40 41.10 39.99<br />
2 30.00 28.51 34.06 34.03 28.51 38.88 44.07<br />
3 30.36 29.25 30.76 33.13 29.25 37.58 36.66<br />
Fermentation Length (28 d)<br />
0 24.03 25.40 25.60 25.36 24.74 24.25 24.81<br />
1 26.50 32.20 32.23 26.33 28.15 32.40 45.18<br />
2 33.30 34.23 33.53 33.86 28.88 32.40 44.62<br />
3 29.43 31.10 35.16 32.20 37.03 43.51 42.03<br />
1 Control had 39% water and 61% rice hulls, treatments 2,3,4,5,6, and 7 had 35,42,45,50,60, and 70% milk (w/w), respectively<br />
Fig. 1. Rice Hulls Fig. 2. Micro silos ma<strong>de</strong> of PVC pipes<br />
Fig. 3. Opening silos after 14 and 28 days of Fig. 4. Sample of silage (500 g) placed<br />
Fermentation in Styrofoam containers lined with plastic<br />
bags for the aerobic exposure period<br />
28
Conclusions<br />
The mixture of milk to rice hulls in nearly equal proportions is conducive to a good<br />
fermentation, but the resulting silage <strong>de</strong>teriorates rapidly upon aerobic exposure. Ensiling milk<br />
with other more nutritive materials, such as straw or hay, should be even more successful as a<br />
method of preserving the nutrients of discar<strong>de</strong>d milk for animal feeding and thus contributing<br />
to reducing soil and water contamination<br />
Literature Cited<br />
Wienberg Z.G., G. Ashbell, and Y. Chen. 2003. Stabilization or returned dairy products by<br />
ensiling with straw and molasses for animal feeding. J. Dairy Sci. 86:1325-1329.<br />
González G. and A. A. Rodríguez. 2003. Effect of storage method on fermentation characteristic,<br />
aerobic stability, and forage intake of tropical grasses ensiled in round bales. J. Dairy Sci. 86:<br />
926-933.<br />
Rodríguez A. A., J. A. Acevedo, and E. O. Riquelme. 1997. Aerobic Stability of Native Tropical<br />
Grass Silage. Effect of propionic acid and length of aerobic exposure. Arch. Latinoam. Prod.<br />
Anim. 5(Supl. 1): 83-85.<br />
SAS Institute. 1990. SAS User’s Gui<strong>de</strong>: Statistics. SAS, Inst., Cary, N.C.<br />
Oficina <strong>de</strong> la Reglamentación <strong>de</strong> la Industria Lechera. 2002. Informe Anual Año Fiscal 2001-<br />
2002. ORIL, Hato Rey, P.R.<br />
29
Development of Fermented Liquid Diet Using Organic Wastes For Early Weaned Pigs<br />
Dianne Hernán<strong>de</strong>z, Paul F. Ran<strong>de</strong>l, and Abner A. Rodríguez-Carías<br />
Department of Animal Industry, University of Puerto Rico, Mayagüez Campus<br />
Abstract<br />
An experiment was conducted to <strong>de</strong>termine the fermentation characteristics of a commercial weaning pig<br />
concentrate (CPC) mixed with liquid organic wastes from the pharmaceutical (SynerMax, SM), beverages<br />
(wastewater from a caramel processing plant; WWCP) and food industries (milk whey, MW and discar<strong>de</strong>d<br />
milk, DM). The CPC physical form (pelleted, CPCP or groun<strong>de</strong>d, CPCG) and the addition of a lactic acidproducing<br />
bacterial inoculant (LAPBI) were also evaluated. The experiment consisted of mixing the CPC<br />
(P or G) with the liquid wastes in a 2:1 (w/w) proportion and with (LAPBI) or without the bacterial<br />
inoculum (NLAPBI). Deionized water (DW) was used as control. Mixtures evaluated were SM-CPCP-<br />
NLAPBI, WWCP-CPCP-NLAPBI, MW-CPCP-NLABPI, DW-CPCP-NLAPBI, DW-CPCG-NLAPBI, DW-CPCG-<br />
LABPI, DM-CPCG-NLAPBI, and DM-CPCG-LABPI. To <strong>de</strong>termine the fermentation characteristics triplicate<br />
samples from each mixture were placed in hermetic anaerobic digestors (1000 mL capacity) during 96<br />
hours. Samples (50 g) from each mixture were taken at 0, 12, 24, 48, 72, and 96 h to <strong>de</strong>termine pH and<br />
fermentation products (organic acids). During the entire fermentation period and for all mixtures,<br />
production of propionic, and butyric acid was minimal, reaching concentrations lower than 0.02%. After<br />
96 h, mixtures containing SM, WWCP, and MW did not ferment satisfactorily. Fermenting DW with CPCG<br />
resulted in lower (P
Introduction<br />
Disposal of liquid by-products generated during manufacturing processes in the pharmaceutical<br />
and food industries represents an increase in operating costs and environmental pollution for<br />
the island. SynerMax or Streptomyces soluble concentrate is an enzyme-treated, nutrient rich,<br />
liquid, co-product from Abbott Laboratories’ fermentation manufacturing which uses stringently<br />
pre-tested edible–gra<strong>de</strong> soy-based ingredients. When blen<strong>de</strong>d into livestock diets, it provi<strong>de</strong>s a<br />
unique source of digestible proteins, lipids, carbohydrates, minerals, vitamins and uni<strong>de</strong>ntified<br />
response factors. However, more research is nee<strong>de</strong>d to prove its potential use in livestock diets.<br />
Waste water resulting from the caramel production is another industrial by-product that has<br />
been ad<strong>de</strong>d in growing pigs’ diets as an energy source without affecting animal performance<br />
(León, 2002; Jiménez, 2003). However, and similar to Synermax, more experimental data are<br />
nee<strong>de</strong>d for its optimal inclusion in animal diets. Milk whey is a liquid by-product of cheese<br />
production consisting mostly of water, lactose, minerals and a small amount of the more soluble<br />
protein fractions that has been used in animal diets with variable success; but similar to<br />
discar<strong>de</strong>d milk (milk that does not meet minimum standards form human consumption) it is<br />
presently dumped in wastes lagoons. Recycling of nutrients form these liquid organic wastes<br />
into animal diets represents an alternative to reduce costs of production and environmental<br />
pollution. In the feeding management of postweaning pigs, the use of fermented liquid diets<br />
utilizing certain agro-industrial by-products has been evaluated with great success, increasing<br />
animal performance and health (Scholter, 2001). However, there is little information regarding<br />
the use of local liquid agro-industrial by-products to <strong>de</strong>velop a liquid diet for pigs.<br />
Objective<br />
To <strong>de</strong>termine the fermentation characteristics of a commercial weaning pig concentrate mixed<br />
with liquid organic wastes resulting from the pharmaceutical, beverages, and food producing<br />
industries.<br />
Materials and Methods<br />
The study was conducted in the Animal Nutrition Laboratory, University of Puerto Rico,<br />
Mayagüez Campus. A commercial pig concentrate (CPC) was mixed with each of four liquid<br />
industrial organic wastes. By-products evaluated were SynerMax (SM), waste water from a<br />
caramel plant (WW), milk whey (MW) and discar<strong>de</strong>d milk (DM). A mixture of <strong>de</strong>ionized water<br />
(DW) CPC was used as a control treatment. The physical form of the CPC (pelleted, CPCP or<br />
31
ground, CPCG; 1 mm screen) and the use of a lactic acid-producing bacterial inoculant (LAPBI)<br />
as microbial starter applied at 10 6 cfu/g or not (NLAPRB) were also evaluated. Mixtures<br />
evaluated inclu<strong>de</strong> 1) SM-CPCP-NLAPBI, 2) WWCP-CPCP-NLAPBI, 3) MW-CPCP-NLAPBI, 4) DW-<br />
CPCP-NLAPBI, 5) DW-CPCG-NLAPBI, 6) DW-CPCG-LAPBI, 7) DM-CPCG-NLAPBI, and 8) DM-<br />
CPCG-LAPBI. The CPC was mixed with the liquid wastes in 2:1 proportions (w/w). To<br />
<strong>de</strong>termine the fermentability of the different mixtures, triplicate samples from each treatment<br />
were placed into six hermetic digesters (1,000 ml capacity), shown in Fig. 1, and kept at<br />
ambient temperature (27-30°C). Samples (50 g) were taken from each digester at 0, 12, 24,<br />
48, 72 and 96 hours and analyzed for pH and organic acids. For pH <strong>de</strong>termination, 50 g of the<br />
mixture were placed into 450 ml of distilled water (w/v) and homogenized for 5 min with a<br />
stomacher apparatus. Homogenates were strained through eight layers of cheesecloth and<br />
analyzed with a pH meter fitted with a combination electro<strong>de</strong> that was standardized from pH 4<br />
to 7 using commercial buffers. Fermentation products (lactic, acetic, propionic, and butyric<br />
acids) were quantified in a commercial certified laboratory. Data were analyzed as a completely<br />
randomized <strong>de</strong>sign with a 8 (mixtures) by 6 (fermentation periods 0, 12, 24, 48, 72, and 96 h)<br />
factorial arrangement of treatments using the General Lineal Mo<strong>de</strong>l subroutine of SAS (1990).<br />
The Bonferroni t-test was be use for separation of means.<br />
Results and Discussion<br />
Information regarding the initial chemical composition of the liquid organic wastes tested in this<br />
experiment obtained from various sources is presented in Table 1. An acid pH and a lactic acid<br />
content greater than 2%, is characteristics of the by-product from the pharmaceutical industry<br />
(SynerMax). The waste water from the caramel processing plant is less acidic than SM, but also<br />
has a greater lactic acid content (1.4 %) than typical liquid organic wastes from the food<br />
industry.<br />
During the fermentation for all mixtures production of propionic, and butyric acids was minimal,<br />
reaching concentrations lower than 0.02%. Likewise, during 96 hours of fermentation no<br />
changes (P
liquid <strong>de</strong>nsity, high concentration of minerals (e.g. S, Na), and organic acids affect the activity<br />
of <strong>de</strong>sirable bacteria associated with the fermentation process.<br />
Table 1. Chemical composition of liquid organic wastes evaluated<br />
Item (%) SynerMax Wastewater from a caramel plant Milk Whey 1 Discarted Milk 1<br />
Dry Matter 48.7 12.7 4.01 13.20<br />
Organic Matter 2 91.6 75.6 99.0 99.0<br />
Inorganic Matter 2 8.4 24.4 .05 1.0<br />
Cru<strong>de</strong> Protein 2 14.5 5.90 1.02 3.80<br />
Cru<strong>de</strong> Fat 2 8.4 2.70 1.45 2.90<br />
Lactose ND ND 2.45 4.50<br />
pH 3.81 5.27 6.52 6.40<br />
Lactic acid 2.04 1.41 ND ND<br />
Acetic acid 1.00 0.00 ND ND<br />
Propionic acid 0.27 0.00 ND ND<br />
Butyric acid 0.00 0.00 ND ND<br />
1 As fed, ND = Not <strong>de</strong>termined<br />
In CPC pelleted and fermented with milk whey (mixture 3, table 2) the pH <strong>de</strong>creased (P< .05)<br />
and lactic acid and acetic acid contents increased (P < .05) as length of fermentation increased.<br />
However, final pH was higher and lactate concentration of the mixture was lower than the<br />
expected values indicative of well fermented feedstuffs. Grinding of the CPC seemed to<br />
influence positively the fermentation process. Groun<strong>de</strong>d CPC mixed with <strong>de</strong>ionized water<br />
(mixture 5) had lower (P
Table 2. Characteristics of liquid organic wastes fermented with a commercial pig concentrate during 96 hours<br />
Fermentation Product (g/100g)<br />
Mixture Components Physical Form 1 LAPBI 2 Period (h) pH Lactic Acetic<br />
1 SM:CC P No 0 5.38 1.36 0.21<br />
12 5.67 1.30 0.19<br />
24 5.73 1.51 0.23<br />
48 5.77 1.44 0.32<br />
72 5.71 1.39 0.29<br />
96 5.77 1.50 0.33<br />
2 WW:CC P No 0 4.46 0.43 0.06<br />
12 4.50 0.59 0.09<br />
24 4.50 0.56 0.08<br />
48 4.45 0.44 0.06<br />
72 4.40 0.73 0.11<br />
96 4.42 0.52 0.11<br />
3 MW:CC P No 0 6.16 a 0.05 c 0.01 b<br />
12 6.17 a 0.10 c 0.01 b<br />
24 6.14 a 0.13 bc 0.02 b<br />
48 5.94 b 0.10 c 0.09 a<br />
72 5.73 c 0.17 b 0.12 a<br />
96 5.30 d 0.27 a 0.09 a<br />
4 DW:CC P No 0 6.35 a 0.07 c 0.00<br />
12 6.13 b 0.18 c 0.00<br />
24 6.14 b 0.07c 0.01<br />
48 5.77 c 0.19 c 0.01<br />
72 5.33 c 0.32 b 0.09<br />
96 4.77 d 0.70 a 0.12<br />
5 DW:CC G No 0 6.19 a 0.08 c 0.05 c<br />
12 6.25 a 0.15 c 0.06 c<br />
24 6.15 ab 0.17 c 0.19 a<br />
48 6.10 b 0.21 bc 0.26 a<br />
72 5.69 c 0.35 bc 0.11 b<br />
96 4.61 d 0.92 a 0.14 b<br />
6 DW:CC G Yes 0 6.39 a 0.08 d 0.01<br />
12 6.31 a 0.29 c 0.01<br />
24 6.34 a 0.38 c 0.01<br />
48 5.90 b 0.60 b 0.02<br />
72 5.49 d 1.02 a 0.06<br />
96 4.57 e 1.08 a 0.09<br />
7 DM:CC G No 0 6.44 a 0.09 d 0.01 b<br />
12 6.30 b 0.11 d 0.01 b<br />
24 6.24 b 0.66 c 0.02 b<br />
48 5.61 c 0.72 c 0.16 a<br />
72 4.70 d 1.22 b 0.20 a<br />
96 4.44 e 2.89 a 0.23 a<br />
8 DM:CC G Yes 0 6.45 a 0.09 d 0.01 b<br />
12 6.28 b 0.10 d 0.01 b<br />
24 6.24 b 0.09 d 0.01 b<br />
48 5.47 c 0.73 c 0.03 b<br />
72 4.79 d 2.10 b 0.18 a<br />
96 4.42 e 3.03 a 0.23 a<br />
Expected Final Value < 4.5 < 1.5 >.80<br />
1 P = Pelleted; G = Groun<strong>de</strong>d<br />
2 LABPI = Lactic acid-producing bacterial inoculant<br />
a,b,c,d,e Means with unlike within mixture superscripts differ (P < .05)<br />
34
Fig. 1. Anaerobic digestors fermenting liquid organic wastes with a commercial early pig concentrate<br />
Literatured Cited<br />
Jiménez, E. 2003. Use of Waste Waters from a Caramel Producing Plant as a Supplement in the<br />
Diet of Early Weaning and Finishing Pigs. M.S., Department of Animal Industry, University of<br />
Puerto Rico, Mayagüez Campus. 57 pp.<br />
León, F.J., R. Sánchez, C.S. Santana and A. Rodríguez. 2003. Waste Water from a Caramel<br />
Industry as a Partial Substitute in Diets for Pigs. Journal of Agriculture of the Unversity of<br />
Puerto Rico. 87 (1-2): 87-90.<br />
SAS/STAT. 1990. SAS User’s Gui<strong>de</strong> (Release 6.12). SAS Inst., Inc., Cary, NC.<br />
Scholten, R.H.J. 2001. Fermentation of liquid diets for pigs. Ph.D. Dissertation, Wageningen<br />
Institute of Animal Science, Department of Animal Nutrition. Wageningen University, The<br />
Netherlands.<br />
35
Fermentation characteristics and dry matter disappearance of grass hay, rhizome peanut<br />
and by products silages<br />
Karla M. Tous, Teodoro Ruiz and Héctor L. Díaz<br />
University of Puerto Rico, Mayagüez Campus, Mayagüez, Puerto Rico 00680<br />
Abstract<br />
In situ dry matter disappearance (ISDMD) was <strong>de</strong>termined on four feeds in both the fermented and<br />
unfermented state: residues of tilapia (Oreochromis niloticus) fillet production, pineapple processing<br />
residues (Ananas camosus), rhizome perennial peanut hay (Arachis glabra a) t and stargrass (Cynodon<br />
nlemfuensis) hay, for which two fistulated Holstein cows fed grass hay were used. Triplicate samples<br />
from each feed, in Dacron bags were intraruminally incubated for 48 hrs, and then analyzed for DM<br />
disappearance. Data were analyzed using the general linear mo<strong>de</strong>l of SAS® and Bonferroni test for<br />
separation of means. Results showed significant differences in dry matter content of the fermented<br />
feeds, rhizome peanut being highest (35.61%) and pineapple residue lowest (10.35%), (P
Introduction<br />
One of the most important and limiting aspects to consi<strong>de</strong>r in ruminant livestock production is<br />
the type and quality of feed provi<strong>de</strong>d. Use of high quality feeds can translate into higher<br />
productions of milk and meat. This is especially important in the tropics, were ruminants<br />
experience environmental conditions that limit their abilities for feed consumption and growth.<br />
The <strong>de</strong>pen<strong>de</strong>nce on low quality tropical forages as ruminant feeds makes it difficult to achieve<br />
the genetic potential of high producing animals. Silages from legume forages like rhizome<br />
perennial peanut, constitute a viable alternative to provi<strong>de</strong> animals the high quality feeds they<br />
require. These forages are characterized by lower concentrations of fiber, and higher<br />
concentrations of <strong>de</strong>gradable nutrients, particularly in cru<strong>de</strong> protein (CP), relative to grass hay.<br />
Grass hay tends to present higher concentrations of fiber and lower rates of digestibility.<br />
Perennial peanut is a high quality, persistent legume that adapts easily to tropical and sub-<br />
tropical environments (Staples et al., 1997). Silages ma<strong>de</strong> from organic residues, such as those<br />
resulting from processing of tilapia, are quite high in protein content, which makes them a<br />
better carrier of this nutrient than forage silages. Fish silages can be an important protein<br />
supplement, but their efficiency <strong>de</strong>pends on the durability of their nutritional value, after<br />
conservation by anaerobic fermentation, and the freshness of the fish byproducts used (Hussein<br />
et al., 1991). When working with organic wastes from tilapia and other types of fish it, is of<br />
great importance to preserve the protein, as these products are mainly suppliers there of. The<br />
in situ method has had great acceptance among investigators and is commonly used to<br />
estimate the <strong>de</strong>gradability of feed components, like dry matter (DM) and CP (Olaisen et al.,<br />
2003). Values <strong>de</strong>termined in situ are generally good indicators of the nutritional value of feeds<br />
preserved by anaerobic fermentation.<br />
Objectives<br />
Evaluate the effects of anaerobic fermentation of organic wastes from tilapia, pineapple<br />
processing and two tropical forages; one grass and one legume, on chemical composition,<br />
recovery of ensiled matter and DM and CP <strong>de</strong>gradability.<br />
Materials and Methods<br />
Stargrass hay (Cynodon nlemfluensis), residues from processed pineapple (Ananas camosus),<br />
wastes from tilapia (Oreochromis niloticus) fillet production and rhizome perennial peanut hay<br />
(Arachis glabrata) where cut into 5.08 cm. pieces. The tilapia waste only was mixed with 30%<br />
37
molasses. The feeds were subjected to anaerobic fermentation for a minimum of 21 days, in<br />
PVC silos in the laboratory. Two samples of each fresh material and three samples of each<br />
resulting silage were analyzed. The in situ method was used to <strong>de</strong>termine DM and CP<br />
<strong>de</strong>gradability. Two fistulated Holstein cows, fed a grass hay diet were used. The <strong>de</strong>termination<br />
involved placing 2g of stargrass hay, pineapple organic wastes and peanut or 5g of tilapia<br />
organic wastes in nylon bags (Dacron). Triplicate samples from each feed were incubated<br />
intraruminally (Fig. 1,2 and 3) for 0, 3, 6, 12, 24 y 48 h, and then analyzed for DM<br />
disappearance. After the incubation time lapsed, the bags were removed from the rumen,<br />
rinsed in water (Fig. 4) and placed on ice for 15 min. to stop further bacterial fermentation (Fig.<br />
5). The bags were placed in a washing machine, during one washing cycle (Fig. 6). Then the<br />
bags were placed in a convection oven, at 65˚C for 48h to dry. Dry bags were weighed, to<br />
<strong>de</strong>termine DM disappearance. CP content from the residues at each incubation time was<br />
<strong>de</strong>termined using the Kheldajl method. This final step was nee<strong>de</strong>d to <strong>de</strong>termine CP<br />
<strong>de</strong>gradability. Data were analyzed using the general lineal mo<strong>de</strong>l of SAS® and Bonferroni test<br />
of mean separation.<br />
Results and Discussion<br />
Table 1 presents means of DM and CP content, proportion of humid matter recovery and in situ<br />
DM <strong>de</strong>gradability of the silages. Processed pineapple silage was the lowest in DM content,<br />
resulting from its high proportion of residual juice. Tilapia silage showed the second highest DM<br />
content, which resulted from mixing the fish residue with sugarcane molasses. Proportion of<br />
humid matter recovered as silage was high for all feeds, indicating a good fermentation.<br />
CP content on processed pineapple residue was similar to that of the two tropical forage<br />
silages. Atypically the perennial peanut was lower in CP than stargrass in this study. Tilapia<br />
silage showed the highest CP content by a wi<strong>de</strong> margen, establishing it as a potential protein<br />
supplement in ruminant diets. Pineapple residue silage was outstanding in ruminal<br />
<strong>de</strong>gradability; tilapia silage in second place, was higher than the two tropical forages, but not<br />
significantly so relative to perennial peanut, which had a higher DM <strong>de</strong>gradability than<br />
stargrass. Silages from these two organic wastes clearly shows a higher nutritional value in<br />
terms of digestibility than tropical forages, which establishes them, especially processed<br />
pineapple, as possible energy supplements in ruminant diets, whereas tilapia silage is superior<br />
as a protein supplement.<br />
38
Fig.1) Preparation for sample placement<br />
Fig.2) Samples for one incubation time to be placed intraruminally<br />
Fig.3) Intraruminal sample placement<br />
39
Fig.4) Rinsing of all incubated samples after removal from the rumen<br />
Fig.5) Ice bath to stop further bacterial fermentation<br />
Fig.6) Samples in washing machine during 1 washing cycle<br />
40
Table 1. Dry matter content (DM), recovered humid matter (RM) and ruminal<br />
<strong>de</strong>gradability of DM of two tropical forage silages and two fermented<br />
organic wastes.<br />
Silage DM (%) RM (%)<br />
Cru<strong>de</strong><br />
Protein on<br />
dry base<br />
(%)<br />
Degradability<br />
of DM at<br />
48h (%)<br />
Stargrass 24.285 c 97.85 ab 12.58 50.314 c<br />
Rhizome perennial<br />
peanut 36.11 a 99.51 a<br />
10.41<br />
58.383 b<br />
Pineapple 11.181 d 96.21 bc 10.71 74.533 a<br />
Tilapia 30.162 b 95.12 c 39.3 64.066 b<br />
EE 1.466 1.431 14.07 0.233<br />
Means with the same letter on the same column do not present significant differences.<br />
DM- Dry matter<br />
RM- Recovered matter<br />
EE-error mean square<br />
Fermentation characteristics of these silages are shown in Table 2. Pineapple waste silage had<br />
the lowest pH, while tilapia silage showed a small but significant difference, relative to the two<br />
forage silages, as did peanut silage, relative to stargrass. The higher quality of tilapia and<br />
processed pineapple silage is indicated by their lactic acid content and also acetic acid content<br />
in the case of pineapple silage, when compared to the legume and grass silages. Even though<br />
there were differences in DM ruminal <strong>de</strong>gradability for the various silages, no significant<br />
difference was established between the fresh and corresponding ensiled feeds. Mean values<br />
were 60.7% and 62.5%, respectively (Figure 7). Thus the ensiled materials mantained the<br />
digestibilty level that were present in the fresh state.<br />
Table 2. Fermentation characteristics of organic waste silages and silage from tropical<br />
forages evaluated.<br />
Sample pH Lactic acid (%)<br />
Acetic acid<br />
(%)<br />
Propionic acid<br />
(%)<br />
Iso-butyric<br />
Acid (%)<br />
StargrassEstrella 5.608 a 0.59 b 0.632 ab 0.013 a 0.0008 b<br />
Rhizome perennial<br />
peanut 5.465 b 0.55 b 0.402 b 0 b 0 b<br />
Pineapple 4.118 d 1.55 ab 1.334 a 0.114 b 0.021 a<br />
Tilapia 5.306 c 2.34 a 0.366 b 0.026 b 0.006 ab<br />
EE 0.00433 0.355 0.164 0.00102 0.000072<br />
Means with the same letter on the same column do not present significant differences.<br />
EE-error mean square<br />
41
Figure 7. Effect of ensiling on the 48 hr. in situ <strong>de</strong>gradability of pineapple, tilapia,<br />
perennial peanut and stargrass.<br />
Degradability<br />
48h (%)<br />
0.625<br />
0.62<br />
0.615<br />
0.61<br />
0.605<br />
0.6<br />
0.595<br />
0.625<br />
Forage Type<br />
0.607<br />
Fermented<br />
Unfermented<br />
As a result of fermentation, peanut, stragrass and tilapia increased their ruminal protein<br />
digestibility level at 24 hr of incubation and their proportion of soluble protein (Table 3),<br />
contrasting with pineapple, which showed opposite ten<strong>de</strong>ncies. The fermentation process<br />
resulted in a reduction in the proportion of ruminal non <strong>de</strong>gradable protein (RUP), in stragrass<br />
and tilapia wastes, which were the only two feeds from which data were obtained on this<br />
criterion.<br />
Table 3. Determination of soluble CP fraction (CP), in situ CP digestibility at 24 hours of incubation and<br />
ruminally un-<strong>de</strong>gradable protein (RUP), of organic wastes from tilapia, pineapple and tropical forages, fresh<br />
and ensiled.<br />
Sample<br />
Soluble Fraction<br />
(%CP)<br />
24h Digestible<br />
incubation (%CP)<br />
Rhizome perennial peanut<br />
Fresh, 14.0 56.7 -<br />
Ensiled, 46.6 63.0 -<br />
Stargrass<br />
Fresh, 36.3 57.8 45.6<br />
Ensiled, 56.0 69.9 33.1<br />
Tilapia wastes<br />
Fresh, 21.8 52.8 54.3<br />
Ensiled, 28.6 66.1 39.9<br />
Pineapple waste<br />
Fresh, 70.4 84.5 -<br />
Ensiled, 56.7 70.6 -<br />
42<br />
RUP
These experimental results indicate that anaerobic fermentation is an effective method of<br />
preserving some organic wastes, and of improving their nutritive value and ruminal digestibility.<br />
The biggest negative effect occurred in the increase in ruminal CP <strong>de</strong>gradability of silages of the<br />
two forages and tilapia. BY contrast the CP solubility and ruminal <strong>de</strong>gradability of the pineapple,<br />
waste were higher in the fresh material than in the ensiled product. A high ruminal<br />
<strong>de</strong>gradability of protein is un<strong>de</strong>sirable in feeds with a potential to supply high quality protein at<br />
the intestinal level, as in the case of tilapia waste.<br />
Literature Cited<br />
Hussein,H.S and R.M. Jordan, 1991. Fish meal as a protein supplement in ruminant diets: a<br />
review. J. Anim. Sci. 69:2147-2156.<br />
Olaisen,V., T. Medjell, H. Vol<strong>de</strong>n and N. Nesse, 2003. Simplified in situ method for estimating<br />
ruminal dry matter and protein <strong>de</strong>gradability of concentrates. J. Anim. Sci. 81:520-528.<br />
Staples,C.R., S.M. Emanuele and G.M. Prine, 1997. Intake and nutritive value of florigraze<br />
rhizoma peanut silage for lactating dairy cows. J. Anim. Sci. 80:541-549.<br />
43
Use of Waste Water from a Caramel Producing Plant as a Supplement in Diets of<br />
Weaning Pigs<br />
María <strong>de</strong>l Pilar Díaz Cabán, Carmen S. Santana Nieves and Abner A. Rodríguez<br />
Department of Animal Industry, University of Puerto Rico, Mayagϋez Campus<br />
Abstract<br />
Disposal of waste water represents an increase in operational costs for the caramel producing operation<br />
in Puerto Rico and environmental pollution for the Island. Previous studies showed that it is possible to<br />
improve weaning pigs’ performance by the addition of this waste water to the diet (Jiménez, 2003). In<br />
this experiment, a four week trial was conducted to evaluate the addition to the diet of 0% (control) and<br />
10% waste water from a caramel producing plant (WWCPP) on swine performance at weaning. Sixteen<br />
Landrace shoats of 21 + 2 days of age with an average live weight of 6 kg were used in a completely<br />
randomized <strong>de</strong>sign (n=4) with a boar and a gilt per pen. Feeding was on an 8% of bodyweight daily<br />
basis. Feed intake, weight gain and feed efficiency were not affected (P>0.05) by the addition of 10%<br />
WWCPP to the diet. Animal health status was not affected either. In the present case performance at<br />
weaning was not improved by the dietary addition of 10% of WWCPP, as occurred in previous studies<br />
with levels up to 7.5% WWCPP.<br />
Resumen<br />
Las <strong>aguas</strong> <strong>residuales</strong> <strong>de</strong> <strong>una</strong> <strong>planta</strong> productora <strong>de</strong> caramelo (ARPPC) requieren un gasto para su<br />
disposición y son consi<strong>de</strong>radas un contaminante ambiental para la Isla. Estudios previos han <strong>de</strong>mostrado<br />
que añadir estas <strong>aguas</strong> en la dieta <strong>de</strong> cerdos al <strong>de</strong>stete en niveles <strong>de</strong> hasta 7.5%, mejora el consumo <strong>de</strong><br />
alimento, la ganancia en peso y la eficiencia <strong>de</strong> estos animales (Jiménez, 2003). En el presente estudio<br />
dieciséis cerdos Landrace <strong>de</strong> 21±2 días <strong>de</strong> edad, con un peso vivo promedio <strong>de</strong> 6 kg, fueron distribuidos<br />
al azar a 8 jaulas (un macho y <strong>una</strong> hembra por jaula) para evaluar su <strong>de</strong>sempeño al añadir a la dieta 0 ó<br />
10% <strong>de</strong> estas <strong>aguas</strong> durante cuatro semanas. Los cerdos fueron alimentados en base al 8% <strong>de</strong> su peso<br />
vivo. El consumo <strong>de</strong> alimento, la ganancia en peso y la eficiencia alimenticia no fueron afectadas<br />
significativamente con la adición <strong>de</strong> 10% <strong>de</strong> ARPPC (P>0.05). Tampoco se observaron efectos negativos<br />
sobre la salud <strong>de</strong> los animales. Basándonos en los resultados obtenidos en este estudio po<strong>de</strong>mos inferir<br />
que la adición <strong>de</strong> 10% <strong>de</strong> ARPPC no mejoró el <strong>de</strong>sempeño <strong>de</strong> cerdos al <strong>de</strong>stete, diferencia <strong>de</strong> los<br />
resultados <strong>de</strong> estudios previos con niveles menores <strong>de</strong> ARPPC.<br />
44
Introduction<br />
Swine producers have <strong>de</strong>creased the age at weaning in or<strong>de</strong>r to increase the number of pigs<br />
weaned per sow annually and thus improve profitability (Kerr et al. 1998). The early weaned<br />
pigs require highly digestible diets, including high quality protein ingredients, which makes the<br />
diets more expensive (Richert et al. 1996).<br />
In PR swine producers do not follow proper management practices for successful early weaning.<br />
This is, in part, because of the lack of proper physical facilities and feed. The acquisition of<br />
complex diets (for pigs un<strong>de</strong>r 21 days of age) represents a problem in PR because there is no<br />
local production of this kind of diet and the only ones available are too expensive, to be<br />
attractive to swine producers. Therefore, there is a need to i<strong>de</strong>ntify other low-cost ingredients,<br />
which can be easily ad<strong>de</strong>d to the diets without compromising animal performance, and help to<br />
reduce production costs.<br />
On the other hand, in PR there is an environmental pollution problem due to waste disposal that<br />
has been increasing over the years. This has stimulated interest in searching for new<br />
alternatives that might reduce the problem. The waste waters from a caramel producing plant<br />
(WWCPP) are consi<strong>de</strong>red environmental pollutants. Recent studies with the use of different<br />
percentages of these waste waters (Léon et al., 2003; Jiménez, 2003) in the diets of weaning<br />
pigs, have reported improved performance at the levels evaluated (up to 7.5% addition).<br />
These previous results suggested evaluating higher levels of WWCPP in the diets of early<br />
weaned pigs.<br />
Objective<br />
To evaluate the performance of weaning pigs receiving a diet containing 10% of waste water<br />
from a caramel producing plant.<br />
Materials and Methods<br />
Sixteen Landrace shoats from two different litters, averaging 21±2 days of age, and 6kg body<br />
weight, were distributed among eight pens (one male and one female per pen) at the<br />
Department of Animal Industry Swine Farm located in Lajas, PR. Pigs were fed a commercial<br />
weaning diet, at the rate of 8% of their bodyweight daily, with the addition of 0 or 10% of<br />
WWCPP. These residual waters were obtained from the Coca-Cola Company plant located in<br />
Gurabo, PR and were mixed together with the dry feed.<br />
The pigs were weighted once a week and their feed intake was registered. The animals were<br />
observed periodically for the presence of diarrhea or any visible change in their health status.<br />
45
Kg<br />
The variables feed intake, weight gain and feed efficiency were analyzed as a completely<br />
randomized <strong>de</strong>sign using a lineal mo<strong>de</strong>l by SAS statistical package (1990) with the initial<br />
bodyweight per pen as a covariable.<br />
Results and Discussion<br />
The addition of 10% of WWCPP did not significantly affect (P>0.05) productive performance in<br />
this trial (Figures 1 and 2). Feed intake and weight gain were similar between the control (0%<br />
of WWCPP) and the supplemented (10% of WWCPP) group. The control group showed an<br />
advantage in feed efficiency by a margen of 0.08 kg weight gain/kg intake (Figure 3), but this<br />
difference was not significant (P>0.05). These results differ from those obtained by Jiménez<br />
(2003), in which the WWCPP supplemented pigs showed greater feed intake, weight gain, and<br />
feed efficiency compared with the control group (P≤0.05). However, the levels of WWCPP<br />
evaluated in that study were lower than the level evaluated in the present trial (up to 7.5% vs.<br />
10%, respectively).<br />
The covariable was statistically significant (P≤0.05) for feed intake, but not for weight gain or<br />
feed efficiency (P>0.05). Logically heavier pigs are expected to consume more feed (National<br />
Research Council, 1987). Neither diarrhea nor any other health problems were observed in the<br />
pigs supplemented with 10% of WWCPP.<br />
9<br />
8<br />
7<br />
6<br />
5<br />
4<br />
3<br />
2<br />
1<br />
0<br />
P>0.05<br />
P>0.05<br />
7.7 ± .25<br />
5.9 + .38<br />
0 10<br />
Levels of WWCPP (%)<br />
7.4 + .25<br />
Weekly Intake Weekly Gain<br />
5.1 + .38<br />
Fig. 1. Weekly feed consumption and weight<br />
gain as affected by supplementation<br />
Event with WWCPP. gain/feed<br />
intake) was higher<br />
46<br />
Kg<br />
1.2<br />
1<br />
0.8<br />
0.6<br />
0.4<br />
0.2<br />
0<br />
1.10 + .04<br />
0<br />
.85 + .05<br />
1.06 + .04<br />
P>0.05 Levels of WWCPP (%)<br />
10<br />
Feed Intake Weight gain<br />
.74 + .05<br />
Fig. 2. Daily feed consumption and weight gain as<br />
affected by supplementation with WWCPP.
Feed Efficiency<br />
0.78<br />
0.76<br />
0.74<br />
0.72<br />
0.7<br />
0.68<br />
0.66<br />
0.64<br />
P>0.05<br />
0.77 + .05<br />
Conclusion<br />
In this study no significant effects on the performance of weaning pigs resulted from<br />
supplementation with 10% of waste water from a caramel producing plant. Feed intake, weight<br />
gain and feed efficiency were not statistically affected as compared to the control. Although,<br />
consi<strong>de</strong>ring previous results, no additional benefit of increasing the level of WWCPP from 7.5 to<br />
10% in the diet of weaning pigs was found, this industrial byproduct could be useful to<br />
substitute for part of the imported ingredients used in swine feeding in Puerto Rico, <strong>de</strong>pending<br />
on relative costs.<br />
0 10<br />
Levels of WWCPP (%)<br />
Weighing the pigs.<br />
0.69 + .05<br />
Fig. 3. Feed efficiency as a affected by<br />
supplementation with WWCPP.<br />
47<br />
Collecting orts.
Literature Cited<br />
Jiménez, E. 2003. Use of Waste Waters from a Caramel Producing Plant as a Supplement in the<br />
Diet of Early Weaning and Finishing Pigs. Masters Thesis, Department of Animal Industry,<br />
University of Puerto Rico, Mayagüez Campus. 57 pp.<br />
Kerr C., R.D. Goodband, J.W. Smith, R.E. Musser, J.R. Bergstrom, W.B. Nessmith, M.D. Tokach<br />
and J.L. Nelssen. 1998. Evaluation of Potato Proteins on the Growth Performance of Early-<br />
Weaned Pigs. Journal of Animal Science. 76: 3024-3033.<br />
León, F.J., R. Sánchez, C.S. Santana and A. Rodríguez. 2003. Waste Water from a Caramel<br />
Industry as a Partial Substitute in Diets for Pigs. Journal of Agriculture of the Unversity of<br />
Puerto Rico. 87 (1-2): 87-90.<br />
National Research Council (NRC). 1987. Predicting Feed Intake of Food-Producing Animals.<br />
National Aca<strong>de</strong>my Press, Washington D.C. pp. 25-41.<br />
Richert<br />
B.T., K.R. Cera, A.P. Schinckel, L.K. Clark and J.J. Turek. 1996. Effect of Nursery Diet<br />
Complexity<br />
and Weaning Age on Pig Growth Performance and Health Status. Purdue Swine<br />
Day.<br />
1-4.<br />
SAS/STAT.<br />
1990. SAS User’s Gui<strong>de</strong> (Release 6.12). SAS Inst., Inc., Cary, NC.<br />
48
The role of circulating insulin-like growth factor binding proteins (IGFBP) in the growth<br />
of pigs<br />
supplemented with a unique caramel wastewater (CPWW) in the diet<br />
María <strong>de</strong> los Milagros Soltero,<br />
Melvin Pagán, María <strong>de</strong>l Pilar Díaz and Carmen Santana<br />
University of Puerto Rico, Mayagüez Campus<br />
Abstract<br />
Over the past few <strong>de</strong>ca<strong>de</strong>s, a world wi<strong>de</strong> effort for the control<br />
of industrial pollution has pinpointed<br />
several areas on which research is nee<strong>de</strong>d to <strong>de</strong>velop alternatives<br />
for the disposal of polluting agents. In<br />
the<br />
case of the caramel industry, effective usage of the secondary waste-water products (CPWW)<br />
generated would help to relieve this situation. Previous studies have shown that the addition of levels up<br />
to 7.5% of this waste-water to the diet of weaning pigs improves their performance (Jimenez, 2003). At<br />
the same time, the circulating insulin-like growth factor binding proteins (IGFBP) function to regulate the<br />
endocrine actions of insulin-like growth factor-I (IGF-I) and recent in vitro and in vivo findings suggest<br />
that IGFBP also<br />
function in<strong>de</strong>pen<strong>de</strong>ntly of the IGF-I as growth modulators. Moreover, growth hormone<br />
(GH) is responsible of the regulation of the overall effect of IGF and IGFBP. With these consi<strong>de</strong>rations in<br />
mind,<br />
an experiment was conducted to evaluate the expression of circulating IGFBP, IGF-I and GH in<br />
response to a 10% inclusion of CPWW in weaning pig diets to assess associations between<br />
those growth<br />
related proteins and feed consumption, daily weight gain, and feed efficiency. Sixteen purebred<br />
Landrace<br />
pigs were randomly distributed among 8 pens (a gilt and boar per pen) and assigned one of<br />
two treatments: 0% (control) and 10% inclusion of CPWW. During five consecutive weeks live weight<br />
and<br />
feed consumption were recor<strong>de</strong>d. Blood samples were drawn by jugular venipuncture during the<br />
first,<br />
second, and third week of the experiment and serum levels of IGF-I, IGFBP-III, IGFBP-II, GH were<br />
<strong>de</strong>termined<br />
by radioimmunoassay (RIA), immunoradiometric assay (IRMA) and enzyme-linked<br />
immunosorbent<br />
assay (ELISA), respectively. Serum IGF-I levels were higher in control animals (P <<br />
0.05) and increased from d 14 to d 28 of the experimental period (P < 0.05). Weekly increases were<br />
observed<br />
for IGFBP-III (P < 0.05) and IGFBP-II circulating levels <strong>de</strong>creased from d 14 to d 28 of the<br />
postweaning test period. Simple correlation analysis revealed that there was a positive association<br />
between circulating levels of IGF-I and IGFBP-III (r = 0.88; P < 0.0001). However, the opposite was<br />
observed between<br />
these two and IGFBP-II (r = -0.84, P < 0.0001; r = -0.67, P < 0.0025, respectively).<br />
Levels of GH did not show any significant change between treatments, weeks or sexes (P > 0.05). The<br />
changes<br />
observed in circulating levels of IGF-I, IGFBP-III and IGFBP-II may be associated with weekly<br />
increases<br />
in feed consumption and weight gain that occurred during the entire experimental period (P <<br />
0.05).<br />
Resumen<br />
A través <strong>de</strong> las pasadas décadas, un esfuerzo a nivel mundial ha señalado varias áreas en don<strong>de</strong> se <strong>de</strong>be<br />
realizar<br />
investigación con el propósito <strong>de</strong> <strong>de</strong>sarrollar posibles alternativas para la disposición <strong>de</strong> agentes<br />
contaminantes.<br />
En el caso <strong>de</strong> la industria <strong>de</strong>l caramelo, el uso efectivo <strong>de</strong> las <strong>aguas</strong> <strong>residuales</strong> (CPWW)<br />
generadas<br />
ayudaría a aliviar esta situación. Estudios previos han <strong>de</strong>mostrado que la adición <strong>de</strong> estas<br />
<strong>aguas</strong><br />
<strong>de</strong> <strong>de</strong>secho hasta niveles <strong>de</strong> 7.5% a la dieta <strong>de</strong> cerdos post-<strong>de</strong>stete mejora su <strong>de</strong>sempeño<br />
(Jiménez, sin publicar). Al mismo tiempo, las proteínas <strong>de</strong> enlace <strong>de</strong>l factor <strong>de</strong> crecimiento<br />
similar a<br />
insulina (IGFBP) en el suero sanguíneo funcionan para regular las acciones endocrinas <strong>de</strong>l factor I <strong>de</strong><br />
crecimiento parecido a la insulina (IGF-I). Descubrimientos recientes in vitro<br />
e in vivo sugieren que los<br />
IGFBP<br />
también funcionan in<strong>de</strong>pendientemente <strong>de</strong>l IGF-I como moduladores <strong>de</strong>l crecimiento. Mas aún, la<br />
hormona <strong>de</strong> crecimiento (GH) es responsable <strong>de</strong> la regulación<br />
<strong>de</strong>l efecto conjunto <strong>de</strong> ambos IGF-I y<br />
IGFBP. Con esto en mente se realizó un experimento para <strong>de</strong>terminar si la inclusión <strong>de</strong> un 10% <strong>de</strong><br />
CPWW en la dieta <strong>de</strong> cerdos post-<strong>de</strong>stete resulta en cambios en los niveles <strong>de</strong> IGFBP (II y III), IGF-I y<br />
GH en la sangre y por en<strong>de</strong> en diferencias en crecimiento, consumo <strong>de</strong> alimento, ganancia <strong>de</strong> peso diaria<br />
y eficiencia <strong>de</strong> conversión. Dieciséis cerdos <strong>de</strong> raza Landrace fueron distribuidos al azar a 8 jaulas (<strong>una</strong><br />
cerda y un cerdo por jaula) y asignados a <strong>una</strong> <strong>de</strong> dos tratamientos: 0% (control) y 10% <strong>de</strong> inclusión <strong>de</strong><br />
CPWW. Durante cinco semanas consecutivas se registró el peso vivo y el consumo <strong>de</strong> alimento <strong>de</strong> los<br />
animales. Se colectaron muestras <strong>de</strong> sangre a través <strong>de</strong> sangrado yugular durante la primera, segunda y<br />
tercera semana <strong>de</strong>l experimento y los niveles <strong>de</strong> IGF-I, IGFBP-III, IGFBP-II en el suero fueron<br />
49
<strong>de</strong>terminados mediante radioimmunoensayo (RIA), ensayo immunoradiométrico (IRMA) y ensayo<br />
inmunosorbente ligado a <strong>una</strong> enzima (ELISA), respectivamente. Los niveles <strong>de</strong> IGF-I fueron más altos<br />
para los animales control (P < 0.05) y aumentaron <strong>de</strong>l d 14 al d 28 <strong>de</strong>l periodo post-<strong>de</strong>stete (P < 0.05).<br />
Se observó un aumento semanal en los niveles <strong>de</strong> IGFBP-III (P < 0.05) mientras que, los niveles <strong>de</strong><br />
IGFBP-II disminuyeron a partir <strong>de</strong>l d 14 al d 28 (P < 0.05). Análisis <strong>de</strong> correlación simple reveló que<br />
existe <strong>una</strong> asociación positiva entre los niveles <strong>de</strong> IGF-I y IGFBP-III circulando en la sangre (r = 0.88; P<br />
< 0.0001). Sin embargo, se observó un efecto opuesto entre estos y IGFBP-II (r = -0.84, P < 0.0001; r<br />
= -0.67, P < 0.0025, respectivamente). No se observó efecto <strong>de</strong> tratamiento, semana o sexo sobre los<br />
niveles <strong>de</strong> GH (P > 0.05). Los cambios observados en los niveles sanguineos <strong>de</strong> IGF-I, IGFBP-III y<br />
IGFBP-II pue<strong>de</strong>n ser responsables <strong>de</strong> los aumentos semanales en consumo <strong>de</strong> alimento y peso vivo que<br />
ocurrieron durante todo el periodo experimental (P < 0.05).<br />
Introduction<br />
Production of meat is almost entirely <strong>de</strong>pen<strong>de</strong>nt on animal growth. However, not all aspects of<br />
growth are un<strong>de</strong>rstood, particularly the mechanisms involved in initiation of growth, regulation<br />
of growth rate, and termination of growth at maturity (Hedrick et al., 1994). The Somatomedin<br />
hypothesis originated in early efforts to un<strong>de</strong>rstand how somatic growth was regulated by<br />
factors secreted by the pituitary (Le Roith et al., 2001).<br />
The hormonal regulation of growth is<br />
multi-factorial and a group of proteins known to significantly affect animal growth and<br />
metabolism is the insulin-like growth factor (IGF) system. The IGF system (IGF-I, IGF-II, IGF<br />
cell surface receptors and insulin-like growth factor binding proteins) has been implicated as<br />
being involved in many biological processes of relevance to livestock production systems.<br />
These inclu<strong>de</strong> pre- and postnatal growth, lactation, reproduction and the immune function. The<br />
IGF system plays an important physiological role in the growth and <strong>de</strong>velopment of mammals<br />
by acting locally in specific organs or systemically through circulating IGF-I (Werner et al.,<br />
1994). The actions of both, IGF-I and IGF–II, are mediated by specific insulin-like growth<br />
factor binding proteins (IGFBP). The postulated mo<strong>de</strong>s of action of these binding proteins<br />
inclu<strong>de</strong>: IGF circulatory transport vehicles, retardation of IGF <strong>de</strong>gradation, transvascular IGF<br />
movement and direct modulation of IGF actions at the target cell either by enhancing or<br />
blocking its activity (McGuire et al., 1992; Florini et al., 1996). IGFBP compete with IGF<br />
receptors for IGF binding, and as a consequence, they can affect cell growth. The IGFBP can<br />
act in an endocrine, paracrine, or autocrine fashion and recent in vitro and in vivo findings<br />
suggest that IGFBP function in<strong>de</strong>pen<strong>de</strong>ntly of the IGF as growth modulators (Firth and Baxter,<br />
2002). Also involved in this whole process is the growth hormone (GH). GH simultaneously<br />
stimulates the synthesis of IGF-I and produces a microenvironment that facilitates IGF-I action<br />
through<br />
the modification of the IGFBP profile (Le Roith et al., 2001). Therefore, even though<br />
great progress has occurred in meat production and<br />
processing technologies, a basic<br />
50
un<strong>de</strong>rstanding of animal growth as it relates to physiology of IGFBP and their IGF in<strong>de</strong>pen<strong>de</strong>nt<br />
effects has potential for improving efficiency in meat production. A 10% inclusion of CPWW<br />
may induce indirect changes in relative levels of IGFBP. If this inclusion causes a positive effect<br />
on growth, it would constitute an excellent alternative for disposal of the waste water byproduct<br />
and also benefit meat production.<br />
Objectives<br />
To evaluate the expression of circulating IGFBP in response to a 10% inclusion of caramel<br />
production waste water in weaning pig diets.<br />
To asses potential correlations between relative levels of serum IGFBP and feed efficiency, feed<br />
consumption, weight gain and growth.<br />
Materials and Methods<br />
Sixteen purebred, post-weaning, Landrace pigs were randomly assigned to 8 pens (a gilt and<br />
boar per pen) and to one of two treatments: 0% (control) and 10% inclusion of CPWW. During<br />
five consecutive weeks live weight and feed consumption were recor<strong>de</strong>d; and blood was drawn<br />
by jugular venipuncture. Following collection, individual serum samples were diluted 1:4 or 1:1<br />
with Laemmli’s Electrophoresis Buffer for the analysis of sample pools and individual samples<br />
for each week. Diluted samples (2µl of serum) were subjected to SDS-PAGE<br />
using 12%<br />
separating acrylami<strong>de</strong> gels with 4% staking gels on a Protean II XI Electrophoresis Cell (Bio-<br />
Rad Laboratories, Hercules, CA, USA). Prestained Protein Molecular Weight Standards (12 µl)<br />
(Bio-Rad Laboratories) were used to estimate molecular weights of IGFBP species. Samples<br />
were loa<strong>de</strong>d on gels, control and treatment samples from each pen alternated, and all samples<br />
were run in duplicate. Separated proteins were transferred electrophoretically onto<br />
nitrocellulose membrane using a Trans-Blot Electrophoretic Transfer Cell (Bio-Rad Laboratories).<br />
Following transfer, gels were stained with Coomasie Brillant Blue R-250 (Bio-Rad Laboratories)<br />
and membranes were stained with Ponceau S Solution (Sigma-Aldrich, Inc., St. Louis, MO, USA)<br />
to assure a complete transfer. A biotinylated IGF-I western ligand blotting protocol was tested<br />
for the <strong>de</strong>termination of IGFBP levels<br />
in swine serum. Membranes were washed with TBS-1%<br />
T, blocked by incubating with TBS-0.1% T- 1% BSA, rinsed with TBS-0.1% T, and incubated<br />
with 2 µg Biotinylated IGF-I (GroPep, North A<strong>de</strong>lai<strong>de</strong>, Australia), followed by the addition of<br />
Strepavidin-HRP (Amersham Biosciences, Piscataway,<br />
NJ, USA) in TBS-0.1%T. Blots were<br />
51
insed,<br />
treated with ECL Western Blotting Detection Reagents and Analysis System (Amersham<br />
Biosciences) and exposed for two minutes with Kodak BioMax Light Film (Sigma-Aldrich, Inc.).<br />
Because the validation of Biotinylated<br />
IGF-I Western Ligand Blotting could not be achieved,<br />
sample<br />
pools were ma<strong>de</strong> and sent to Diagnostic Systems Laboratories (Webster, TX) where<br />
they were subjected to Radioimmunoassay (RIA), to <strong>de</strong>tect IGFBP-II; Enzime-Linked<br />
Immunosorbent Assay (ELISA), to <strong>de</strong>tect GH; and Immunoradiometric Assay (IRMA), to <strong>de</strong>tect<br />
IGF-I and IGFBP-III. A diagram of the pooling strategy is provi<strong>de</strong>d:<br />
Days 0 14 28<br />
Week Effect:<br />
C + T = ♀ + ♂<br />
Sex by Treatment Effect:<br />
♀ ♂<br />
C T C T<br />
Treatment Effect:<br />
C (all)<br />
T (all)<br />
Total Number of Pools = 21<br />
1 1 1<br />
4 4 4<br />
2 2 2<br />
A factorial experimental <strong>de</strong>sign was used to study the effect of treatment (0 and 10% CPWW),<br />
sex (male and female), week (d 0, 14, 28 of blood collection) and the interaction between sex<br />
and treatment (GLM Procedure; SAS, 1996). The correspon<strong>de</strong>nt means were separated using<br />
the Bonferroni test and the <strong>de</strong>gree of association between GH, IGF-I, IGFBP-III and IGFBP-II<br />
was established by Pearson Correlation Coefficients (Corr Procedure; SAS, 1996).<br />
Results and Discussion<br />
No significant differences were found between control and CPWW supplemented pigs in weight<br />
gain, feed consumption, and feed efficiency (P > 0.05, data not shown). On the contrary,<br />
weekly increases in feed consumption and weight gain were observed during the entire<br />
experimental period (Figure 1, P < 0.05). Serum IGF-I levels were higher in control animals<br />
(Figure 2, P < 0.05) and increased from d 14 to d 28 of the experimental period (Figure 3, P <<br />
0.05). Weekly increases were observed for IGFBP-III (Figure 4,<br />
P < 0.05) and IGFBP-II<br />
circulating levels <strong>de</strong>creased from d 14 to d 28 of the postweaning test period (Figure 5, P <<br />
52
0.05). Simple correlation analysis revealed that there was a positive association between<br />
circulating levels of IG F-I and IGFBP-III (r = 0.88; P < 0.0001). However, the opposite was<br />
observed between these two and IGFBP-II (r = -0.84, P < 0.0001; r = -0.67, P < 0.0025,<br />
respectively). Levels of GH did not<br />
show any significant change between treatments, weeks or<br />
sexes (P > 0.05, data not shown) . Unlike GH, which is secreted in a pulsatile manner, IGF-I<br />
levels remain fairly constant throughout the day (Bach, 1999) and can be <strong>de</strong>termined from a<br />
single blood sample (Bishop<br />
et al., 1989). At the same time, IGF-I serum concentration is<br />
associat ed with growth traits in man y livestock species (An<strong>de</strong>rson et al., 1988; Graml et al.,<br />
1994) and may be useful as a physiological indicator in selection programs <strong>de</strong>signed to improve<br />
weight and growth rate in pigs (Buonomo et al., 1987). IGF-I mediates many of the growth-<br />
promoting effects of growth hormone and regulates postnatal growth and <strong>de</strong>velopment.<br />
However, the actions of the IGF-I and –II (IGFs) are modulated by a family of six high affinity<br />
binding proteins (IGFBP-1–6) that have been i<strong>de</strong>ntified by molecular cloning of their cDNAs<br />
from rat and human tissues (Shimasaki and Ling, 1991). These proteins bind IGFs with an<br />
affinity equal to or greater than that of the IGF-I receptor (Rechler and Clemmons,<br />
1998) and<br />
they<br />
can act in an endocrine, paracrine, or autocrine fashion. IGFBP-2 and -3, like IGF-I, are<br />
also responsive to growth hormone (Cohick et al., 1992; Harrell et al., 1999)<br />
and may be useful<br />
indicators of rate of gain and carcass composition in livestock. IGFBP-2 is a distinct protein<br />
whose plasma concentration is inversely related to GH (Binoux et al., 1986) whereas IGFBP-3 is<br />
a glycoprotein whose plasma concentration is directly related to GH secretory status (Baxter<br />
and Martin, 1986). In the present study no association was found between serum levels of IGF-<br />
I, IGFBP-III, IGFBP-II and GH (Table 1). This may be due to the fact that a single blood<br />
sample was collected to measure GH instead of the recommen<strong>de</strong>d 10 hours sampling strategy<br />
for accurate <strong>de</strong>termination of this specific hormone. We found that circulating levels of IGFBP-<br />
II even though <strong>de</strong>creased from day 14 to d 28 of the experimental period (Figure 5), were<br />
higher than the levels of both IGF-I and IGFBP-III (Figure 3 and 4, respectively). Generally,<br />
IGFBP-III is the most abundant IGFBP species in serum and milk. It is produced mainly by non-<br />
parenchymal hepatic cells and circulates in serum, binding IGF-I or IGF-II in conjunction with<br />
an acid-labile subunit (ALS) to form a 150 kDa circulating (ternary) complex at a serum<br />
concentration of about 100 nM which increased the IGF-I half life to 15 h (Rechler and<br />
Clemmons, 1998). This is in accordance with the strong positive correlation found between<br />
these two proteins in the present study (Table 1). The precise roles of individual IGFBP are still<br />
53
unknown, due mainly to the great complexity of their actions and their regulation, but also to<br />
the fact that the overwhelming majority of information about the IGFBP is <strong>de</strong>rived for in vitro<br />
studies. IGFBP-2 appears to play a key role in myogenesis (Ernst et al., 1992; Ernst et al.,<br />
1996; Fligger et a., 1998; Gerrard et al., 1999). The level of expression of IGFBP-2 mRNA and<br />
protein was found to be high in proliferating turkey myogenic satellite cells (Ernst et al., 1996)<br />
and mouse myoblast (Ernst et al., 1992) and to <strong>de</strong>crease gradually as differentiation<br />
progressed. This has been associated with a sequestration of IGF-I by IGFBP-2, which makes<br />
that growth factor less available to the myogenic satellite cells (Fligger et al., 1998). Schnei<strong>de</strong>r<br />
et al. (2000) reported that the most prominent phenotype in IGFBP-2 transgenic mice was a<br />
reduction of somatic growth and that overexpression of IGFBP-3 un<strong>de</strong>r a ubiquitous promoter<br />
resulted in selective organomegaly. In our study, circulating levels of both IGFBP-III and<br />
IGFBP-II were much higher than the levels of IGF-I. Therefore, these two binding proteins<br />
somehow are regulating the actions of IGF-I (Table 1) and probably functioning in an IGF-I<br />
in<strong>de</strong>pen<strong>de</strong>nt manner (according to serum levels, Figures 3, 4 and 5). Therefore, the changes<br />
observed in circulating levels of IGF-I, IGFBP-III and IGFBP-II may be associated with the<br />
weekly increases in feed consumption and weight gain that occurred during the entire<br />
experimental period (Figure 1, P < 0.05).<br />
kg<br />
12<br />
10<br />
8<br />
6<br />
4<br />
2<br />
0<br />
a<br />
1 2 3 4<br />
Time (weeks)<br />
Feed Consumption Weight Gain<br />
Figure 1. Weekly feed consumption and weight gain (Kg) of post-weaning pigs.<br />
a<br />
b<br />
Within each variable means lacking a common superscript letter differ (P < 0.05).<br />
54<br />
b<br />
c<br />
c<br />
d<br />
c
IGF-I (ng/mL)<br />
100<br />
90<br />
80<br />
70<br />
60<br />
50<br />
40<br />
30<br />
20<br />
10<br />
0<br />
a<br />
Control Tr eatment<br />
Figure 2. Serum IGF-I levels of controls pigs and pigs supplemented by a 10% inclusion of CPWW<br />
during the postweaning period. Samples collected at day 0, 14 and 28 of the<br />
experimental period wer e pooled for control<br />
and supplemented pigs and IGF-I was<br />
<strong>de</strong>termined by Immunoradiometric assay (Diagnostic Systems Laboratories, Inc.). Within<br />
each variable means lacking a common superscript letter differ (P < 0.05).<br />
180<br />
160<br />
140<br />
120<br />
100<br />
IGF-I (ng/mL)<br />
80<br />
60<br />
40<br />
20<br />
0<br />
a<br />
0 14 28<br />
Time (Days)<br />
Figure 3. Serum IGF-I levels of postweaning pigs. Samples collected at day 0, 14 and 28 of the<br />
experimental period were individually pooled and IGF-I was <strong>de</strong>termined by<br />
Immunoradiometric assay (Diagnostic Systems Laboratories, Inc.). Within each variable<br />
means lacking a common superscript letter differ (P < 0.05).<br />
55<br />
a<br />
b<br />
b
300<br />
250<br />
200<br />
IGFBP-III (ng/mL) 150<br />
100<br />
50<br />
0<br />
0 14 28<br />
Time (Days)<br />
Figure 4. Serum IGFBP-III levels of postweaning pigs. Samples collected at day 0, 14 and 28 of the<br />
experimental period were individually pooled and IGFBP-III was <strong>de</strong>termined by<br />
Immunoradiometric assay (Diagnostic Systems Laboratories, Inc.). Within each variable<br />
means lacking a common superscript letter differ (P < 0.05).<br />
IGFBP-II (ng/mL)<br />
1200<br />
1000<br />
800<br />
600<br />
400<br />
200<br />
0<br />
a<br />
0 14 28<br />
Time (Days)<br />
Figure 5. Serum IGFBP-II levels of postweaning pigs. Samples collected at day 0, 14 and 28 of the<br />
experimental period were individually pooled and IGFBP-II was <strong>de</strong>termined by<br />
Radioimmunoassay (Diagnostic Systems Laboratories, Inc.). Within each variable means<br />
b<br />
a a<br />
lacking a common superscript letter differ (P < 0.05).<br />
56<br />
c<br />
b
Table 1. Pearson Correlation Coefficients for Serum IGF-I, IGFBP-III, IGFBP-2 and GH.<br />
TRAIT IGF-I IGFBP-III IGFBP-II<br />
WEEK 0.88<br />
0.92<br />
-0. 64<br />
0.0001<br />
0.0001<br />
0.0042<br />
IGF-I 0.88<br />
-0.84<br />
0.0001<br />
0.0001<br />
IGFBP-III -0.67<br />
0.0025<br />
IGF-I = Insulin-like growth factor-I<br />
IGFBP-III = Insulin-like growth factor binding protein-III<br />
IGFBP-II = Insulin-like growth factor binding protein-II<br />
GH = Growth Hormone<br />
Conclusion<br />
Changes in circulating<br />
levels of IGF-I, IGFBP-III, and IGFBP-II observed in control pigs and pigs<br />
supplemented with a 10% inclusion of CPWW may be responsible of weekly increases in feed<br />
efficiency and weight gain that occurred during a 28 d postweaning experimental<br />
period which<br />
reaffirms that these proteins play a key role in swine growth regulation.<br />
Figure 6. Jugular Venipuncture of Control Pigs and Animals<br />
Supplemented with a 10% Inclusion of CPWW in the Diet<br />
57<br />
GH<br />
-0.48<br />
0.05<br />
-0.20<br />
0.4145<br />
-0.34<br />
0.1654
Literature Cited<br />
An<strong>de</strong>rson, P .T. , W.G. Bergen, R.A. Merkel, W.J. Enright, S.A. Zinn, K.R. Refsal, and D. R.<br />
Hawkins. 1988. The relationship between composition<br />
of gain and circulating hormon es in<br />
growing beef bulls fed three dietary cru<strong>de</strong> prot ein<br />
levels. J . Anim. Sci. 66:3059-3067.<br />
Bach, L.A. 1999. The insulin-like growth factor system: basic and clinical aspects. Aust. N Z.<br />
J.<br />
Med. 29:355-361.<br />
Baxter, R.C., and J.L. Martin. 1986. Radioimmunoassay of growth hormone <strong>de</strong>pen<strong>de</strong>nt insulin-<br />
like<br />
growth factor binding protein in human plasma. J. Clin. Invest. 78:1504-1512.<br />
Binoux, M., P. Hossenlopp, S. Hardouin , D. Seurin, C.<br />
Lassarre, and M. Gourmelen. 1986.<br />
Somatomedin (insulin-like growth factor)-binding proteins: Molecular forms and regulation.<br />
Horm. Res. 24:141-151.<br />
Bishop, M.D., R.C.M. Simmen, F.A. Simmen, and M.E. Davis. 1989. The relationship of insulinlike<br />
growth factor-I with postweaning performance in Angus beef cattle.<br />
J. Anim. Sci.<br />
67:2872-2880.<br />
Buonomo,<br />
F.C., T.J. Lauterio, C.A., Baile, and D.R. Campion. 1987. Determination of insulin-<br />
like<br />
growth factor 1 (IGF1) and IGF binding protein levels in swine. Dom. Anim. Endocrinol.<br />
4:23-31.<br />
Cohick, W.S., M.A. McGuire, D.R. Clemmons, and D.E. Bauman. 1992. Regulation of insulin-like<br />
growth factor-binding proteins in serum and lymph of lactating cows by somatrotopin.<br />
Endocrinology. 130:1508-1514.<br />
Ernst, C.W., D.C. McFarland, and M.E. White. 1996. Expression of insulin-like growth factor II<br />
(IGF-II), IGF binding protein-2 and myogenin during differentiation of myogenic satellite cells<br />
<strong>de</strong>rived from the turkey. Differentiation. 61:25-33.<br />
Ernst, C.W., R.H. McCusker,<br />
and M.E. White. 1992. Gene expression and secretion of insulinlike<br />
growth factor-binding proteins during myoblast differentiation. Endocrinology.<br />
130:607-<br />
615.<br />
Firth, S. M. and R. C. Baxter. 2002. Cellular actions of the insulin-like growth factor binding<br />
proteins. Endocr. Rev. 23: 824-854.<br />
58
Fligger, J.M., P.V. Malven, M.E. Doumit, R.A. Merkel, and<br />
A.L. Grant. 1998. Increases in<br />
insulin-like growth factor binding protein-2 accompany<br />
<strong>de</strong>creases in proliferation and<br />
differentiation when porcine muscle satellite cells un<strong>de</strong>rgo multiple passages. J. Anim.<br />
Sci.<br />
76:2086-2093.<br />
Gerrard, D.E., C.S. Okamura, and A.L. Grant. 1999. Expression and location of IGF<br />
proteins-2,<br />
-4 and -5 in <strong>de</strong>veloping fetal tissues. J. Anim. Sci. 77:1431-1441.<br />
binding<br />
Graml, R., A. Olbrich-Bludau,<br />
M. Schwab, E. Schallenberger, D. Schams, and F. Pirchner. 1994.<br />
Relationship<br />
between plasma hormone and metabolite levels and breeding values of bulls. J.<br />
Breed. Genet. 112:313-326.<br />
Florini, J.R., D.Z. Ewton, and S.A. Coolican. 1996. Growth hormone and the insulin- like growth<br />
factor<br />
system in myogenesis. Endocrinol. Rev. 17:481-517.<br />
Hedrick, H.B., E.D. Aberle, J.C. Forrest, M.D. Judge, and R.A. Merkel. 1994. Principles of Meat<br />
Science. 3rd Ed. Kendall Hunt Publishing Company, Dubuque, Iowa. pp 55.<br />
Harrell,<br />
R.J., M.J. Thomas, R.D. Boyd, S.M. Czerwinski, N.C. Steele, and D.E. Bauman. 1999.<br />
Ontogenic maturation of the samototropin/insulin-like growth factor axis. J. Anim. Sci.<br />
77:2934-2941.<br />
Jiménez, E. 2003. Use of waste waters from a caramel producinf plant as a supplement in the<br />
diet of early<br />
weanling and finishing pigs. M.S. Thesis, Department of Animal Industry, University<br />
of<br />
Puerto Rico, Mayaguez Campus. 57pp.<br />
Le Roith, D., C. Bondy, S. Yakar, J. Liu, and A. Butler. 2001. The somatomedin hypothesis:2001.<br />
Endocr.<br />
Rev. 22:53-74.<br />
McGuire, M.A., J.L. Vincini, D.E. Bauman, and J.J. Veenhuizen. 1992. Insulin-like growth factors<br />
and binding<br />
proteins in ruminants and their nutritional regulation. J. Anim. Sci. 70:2901-2910.<br />
Rechler, M.M., and D.R. Clemmons. 1998. Regulatory actions of insulin-like growth factor-<br />
binding<br />
proteins. Trends Endocrinol. Metab. 9:176-183.<br />
SAS. 1996. The SAS System for Windows (Version 6.12, TS020). SAS institute Inc., Cary, NC.<br />
59
Schnei<strong>de</strong>r, M. R., H. Lahm, M. Wu, A. Hoeflich, and E. Wolf. 2000. Transgenic mouse mo<strong>de</strong>ls<br />
for studying the functions of insulin-like growth factor-binding proteins. FASEB J. 14:629-640.<br />
Shimasaki, S., and N. Ling. 1991. I<strong>de</strong>ntification and molecular characterization of insulin-like<br />
growth factor binding proteins (IGFBP-1, -2, -3, -4, -5, and -6). Prog. Growth Factor Res.<br />
3:243-266.<br />
Werner, H., M. Adamo, C.T. Roberts, Jr., and D. LeRoith. 1994. Molecular and cellular<br />
aspects of insulin-like growth factor action. Vitam. Horm. 48:1-58.<br />
60