Thin-Layer Radiochromatography - Raytest
Thin-Layer Radiochromatography - Raytest
Thin-Layer Radiochromatography - Raytest

Create successful ePaper yourself
Turn your PDF publications into a flip-book with our unique Google optimized e-Paper software.
A Field Guide to In stru men ta tion<br />
<strong>Thin</strong>-<strong>Layer</strong> <strong>Radiochromatography</strong><br />
<strong>Thin</strong>-layer radiochromatography<br />
(TLRC) involves the use of<br />
thin-layer chromatography (TLC)<br />
and high- performance TLC (HPTLC)<br />
for the separation and qualitative and<br />
quantitative determination of<br />
radiolabeled substances in chemical,<br />
biochemical, biological, pharmaceutical,<br />
and medicinal samples. The classical<br />
detection methods for TLRC are<br />
autoradiography and liquid scintillation<br />
counting (LSC; also termed zonal<br />
analysis). In autoradiography, the layer<br />
containing the separated radioactive<br />
zones (spots or bands) is put in direct<br />
contact with a photographic (X-ray)<br />
film, which shows the image of the<br />
chromatogram after film development.<br />
Qualitative assessment of<br />
chromatograms is made by visual<br />
inspection of the film to reveal the<br />
locations of radioactivity as darkened<br />
zones of varying optical densities. The<br />
optical density is related to the amount of<br />
radioactivity in the zone, so<br />
quantification is done by density<br />
measurement of the zones with a<br />
densitometer using a calibration curve<br />
produced by exposure to radioactive<br />
standards. Descriptions of applicable slit<br />
scanning, video, digital camera, and<br />
flatbed light-based densitometers, which<br />
are also used for quantification of colored,<br />
UV absorbing, and fluorescent TLC<br />
zones, have already been published (1–4)<br />
and will not be repeated here.<br />
This article decsribes a selection of<br />
the most useful methods and instruments<br />
that are currently available for LSC and<br />
for detecting and measuring radioactive<br />
zones in thin layers without the use of<br />
film or scraping off the layer, and<br />
selected applications for their use. The<br />
latest available descriptions of<br />
instruments for LSC and direct detection<br />
of radioactivity in TLC were in book<br />
chapters published in 2001 (5) and<br />
2003 (6). These chapters included many<br />
instruments that are outdated and no<br />
longer commercially available, e.g., the<br />
digital autoradiograph from EG&G<br />
Berthold, Wildbad, Germany, and no<br />
book chapter or journal article on TLC<br />
has included an updated description of<br />
current instruments since then.<br />
The coverage in this article is<br />
selective rather than exhaustive in terms<br />
of the number of companies and<br />
instruments described, as well as<br />
features, options, and applications<br />
mentioned for each instrument.<br />
Information was taken from<br />
correspondences with manufacturers<br />
and their Websites and printed<br />
brochures. Readers are encouraged to<br />
contact the manufacturers for their<br />
complete TLRC product offerings,<br />
detailed instrument specifications, and<br />
application notes.<br />
Beckman Coulter LS 6500<br />
Scintillation Counting System<br />
In LSC, the zones emitting<br />
alpha, beta, or gamma<br />
radioactivity are scraped off<br />
the layer and mixed with a<br />
liquid scintillation cocktail (a<br />
mixture of solvent, emulsifier,<br />
and flour). The flour in the<br />
cocktail converts the kinetic<br />
energy of nuclear emissions<br />
into photons of light energy<br />
(blue light flashes) with<br />
intensity proportional to the<br />
initial energy of the radioactive<br />
particle. The photons are<br />
detected by a photomultiplier<br />
tube (PMT), converted into proportional<br />
electrical pulses, and passed into a<br />
multichannel analyzer covering an<br />
energy range of, e.g., 0–2000 keV. The<br />
number of pulses in each channel is<br />
recorded for sample analysis, and the<br />
spectrum can be plotted to provide<br />
information about the energy of the<br />
radiation or the amount of radioactive<br />
material dissolved in the cocktail.<br />
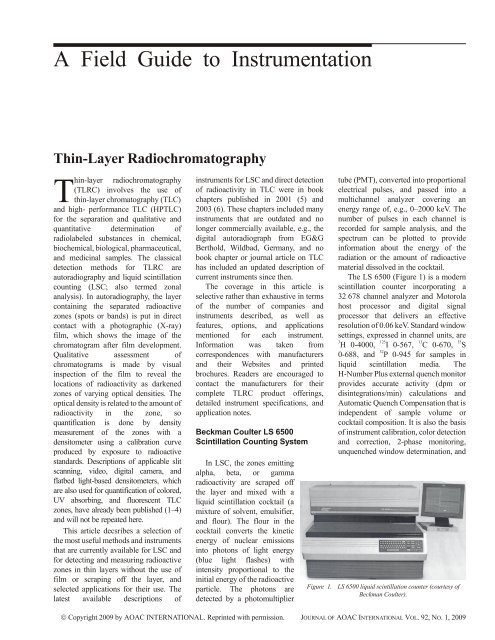
The LS 6500 (Figure 1) is a modern<br />
scintillation counter incorporating a<br />
32 678 channel analyzer and Motorola<br />
host processor and digital signal<br />
processor that delivers an effective<br />
resolution of 0.06 keV. Standard window<br />
settings, expressed in channel units, are<br />
3<br />
H 0-4000, 125<br />
I 0-567, 13<br />
C 0-670, 35<br />
S<br />
0-688, and 32<br />
P 0-945 for samples in<br />
liquid scintillation media. The<br />
H-Number Plus external quench monitor<br />
provides accurate activity (dpm or<br />
disintegrations/min) calculations and<br />
Automatic Quench Compensation that is<br />
independent of sample volume or<br />
cocktail composition. It is also the basis<br />
of instrument calibration, color detection<br />
and correction, 2-phase monitoring,<br />
unquenched window determination, and<br />
Figure 1. LS 6500 liquid scintillation counter (courtesy of<br />
Beckman Coulter).<br />
� Copyright 2009 by AOAC INTERNATIONAL. Reprinted with permission. JOURNAL OF AOAC INTERNATIONAL VOL. 92, NO. 1, 2009
A Field Guide to In stru men ta tion<br />
Figure 2. BAS-5000 storage phosphor screen imaging<br />
system (courtesy of Fujifilm Life Science).<br />
multilabel dpm quench curves. The<br />
plastic Versa-Rack vial system allows<br />
counting of samples in any combination,<br />
up to 336 standard vials (20 mL) and<br />
648 miniature vials (6 mL); capabilities<br />
also exist to count 4 mL Bio-Vials and<br />
Microfuge tubes. Computer-based<br />
operation is via a combination of easy to<br />
use menus, context-sensitive help<br />
screens, and up to 50 user programs.<br />
Different biodegradable general use and<br />
specialized cocktails, plastic scintillation<br />
vials, unquenched LS standards, and<br />
quenched standards are among the<br />
available accessories.<br />
Phosphor Imaging<br />
Storage phosphor screen imaging is<br />
often termed filmless autoradiography.<br />
The phosphor screens are sensitive to<br />
any source of ionizing radiation, e.g.,<br />
14 C, 3 H, 35 S, 125 I, 32 P, 33 P, 18 F, and 99m Tc. They<br />
contain small crystals of a<br />
photostimulable phosphor coated on a<br />
support in which luminescence is<br />
produced and stored when exposed to<br />
radioactive TLC zones. The<br />
luminescence is evaluated by scanning<br />
with a laser in a reading device, and<br />
quantification is carried out by use of a<br />
calibration curve to exclude the effects<br />
of the phosphor screen type and<br />
exposure period. The screens can be<br />
reused after being erased by<br />
exposure to visible light. The<br />
formulation of the phosphor<br />
screen, chemistry of the detection<br />
process, mechanism of scanning,<br />
and software for evaluation of<br />
images may differ for instruments<br />
from each manufacturer.<br />
BAS-5000 Bioimaging<br />
Analyzer<br />
The BAS-5000 bioimaging<br />
analyzer from Fujifilm Life<br />
Science USA (Figure 2) uses a<br />
patented phosphor imaging plate (IP)<br />
with a scanner for IP reading for the<br />
sensitive, 2-dimensional (2D) detection<br />
of radioactive TLC zones by the<br />
photostimulated luminescence (PSL)<br />
phenomenon. The instrument features a<br />
confocal laser, light-collecting optics,<br />
dynamic range up to 5 orders of<br />
magnitude, and a pixel size as small as<br />
25 �m. A 20 � 25 cm IP with the images<br />
of chromatograms from a 20 � 20 cm<br />
TLC plate can be scanned at 50 �m in as<br />
manufacturing process. The exposed IP<br />
is scanned with a laser beam of red light<br />
(633 nm) focused by a mirror while<br />
being moved in the reader; the PSL<br />
released by the laser as photons of blue<br />
light (390 nm) is collected onto a PMT<br />
through a light collection guide and is<br />
converted to electrical signals.<br />
Cyclone Plus Phosphor Imager<br />
The PerkinElmer benchtop Cyclone<br />
Plus quantitative radiometric phosphor<br />
imager (Figure 3) operates with the same<br />
storage phosphor and scanning process<br />
(Figure 4), except that confocal optics<br />
and a helical scanning mechanism are<br />
used with the flexible phosphor screen<br />
loaded into a cylindrical carousel that<br />
spins at 360 rpm. This allows the<br />
instrument to be more compact and less<br />
expensive than the BAS-5000, in which<br />
the phosphor screen is kept on a flat<br />
plane during scanning. The phosphor<br />
screen is scanned by the system’s laser<br />
focused to less than 50 �m, and the latent<br />
image is detected by the instrument<br />
optics to create a high-resolution<br />
digitized image of the layer with<br />
quantitative data in the form of an image<br />
file. The image is displayed on the<br />
computer screen for analysis with<br />
OptiQuant software and can be printed,<br />
exported, and archived for future use.<br />
The following storage phosphor screens<br />
little as 5 min; the detection limit is<br />
0.11 dpm/mm 2<br />
/h for P 32<br />
. Compared to<br />
X-ray film, sensitivity is about 100 times<br />
higher, processing is 10–100 times<br />
faster, and quantitative accuracy is<br />
greater.<br />
The IP consists of 5 �m crystals of<br />
barium fluorobromide containing a trace<br />
amount of bivalent europium<br />
(BaFBr:Eu +2 ) as a<br />
bioluminescence center<br />
coated on a polyester support<br />
film. When the crystal is<br />
exposed to a radiolabeled<br />
zone, the energy of the<br />
radioisotope ionizes the Eu +2<br />
to Eu +3<br />
, liberating electrons<br />
to the conduction band of the<br />
phosphor crystals. The<br />
electrons are trapped in the<br />
bromine vacancies Figure 3. Cyclone Plus phosphor imager (courtesy of<br />
introduced during the<br />
PerkinElmer).<br />
JOURNAL OF AOAC INTERNATIONAL VOL. 92, NO. 1, 2009. � Copyright 2009 by AOAC INTERNATIONAL. Reprinted with permission.
A Field Guide to In stru men ta tion<br />
Figure 4. Schematic representation of the storage phosphor process (courtesy of PerkinElmer).<br />
are available in 12.5 � 19.2, 12.5 � 25.2,<br />
or 12.5 � 43 cm sizes: multisensitive<br />
(MS) general purpose, super resolution<br />
(SR) made with the finest grain particles<br />
of phosphor, and tritium sensitive (TR)<br />
uncoated for the detection of 3<br />
H. Specific<br />
TLC applications cited by PerkinElmer<br />
are imaging of 3<br />
H, 125<br />
I, 14<br />
C, 32<br />
P, 33<br />
P, 18<br />
F, 90<br />
Y,<br />
99m 111 177<br />
Tc, In, and Lu; nucleotide<br />
metabolism studies with<br />
32 P- and<br />
33<br />
P-labeled adenosine triphosphate<br />
(ATP) or guanosine triphosphate (GTP);<br />
14<br />
C-uridine-5�-diphospho-glucuronic<br />
acid (UDPGA) glucuronidation assay;<br />
quality control (QC) of<br />
177 Lu- and<br />
90 Y-DOTA-D-phenylalanine(1)-tyrosine<br />
(3)-octreotide (TOC); 18 F silica gel TLC<br />
for analysis of positron emission<br />
tomography (PET) radiochemicals; QC<br />
of 99m Tc; and radiochemical purity of 90 Y<br />
Zevalin (Figure 5).<br />
Radioscanners for Direct<br />
Measurement of TLC Plates<br />
Bioscan AR-2000 TLC Imaging<br />
Scanner<br />
The AR-2000 imaging scanner<br />
(Figure 6) uses a resistive anode<br />
single-element position sensing<br />
windowless gas-filled proportional<br />
detector for direct digital counting of all<br />
beta and gamma emitting isotopes,<br />
including 3 H, on TLC or HPTLC plates.<br />
The process involves ionization of the<br />
counting gas by interaction with<br />
radioactive TLC zones, producing a<br />
pulse of electrons that is proportional to<br />
the amount of radioactivity. An entire<br />
lane can be imaged in under 1 min, and<br />
multiple lanes can be measured in a<br />
single automated run without operator<br />
intervention. The instrument is linear<br />
over 4–5 decades of activity; has<br />
resolution of 0.5–3 mm depending on<br />
the isotope; and has a sensitivity of less<br />
than 1000 dpm for 3 H and 125 I and less<br />
than 100 dpm for 14 C, 32 P, and most other<br />
isotopes in a 10 min analysis. Models are<br />
available that hold one, two, or three 20<br />
� 20 cm TLC plates. Single-lane or 2D<br />
color imaging and automated<br />
quantification can be performed with<br />
WinScan software, and Bio-Chrom<br />
software can be used in place of<br />
WinScan for compliance with 21 CFR<br />
Part 11, U.S. Food and Drug<br />
Administration and Good Laboratory<br />
Practice (GLP) standards.<br />
Applications for which the AR-2000<br />
have been used include PET or single<br />
photon emission computed tomography<br />
(SPECT) radiopharmaceutical QC and<br />
synthesis process control (compounds<br />
labeled with 18<br />
F, 11<br />
C, 99m<br />
TC, 111<br />
In, etc.);<br />
pharmaceutical metabolite analysis for<br />
beta-, gamma-, or positron-labeled<br />
products; radiotracer toxicology studies<br />
with 14 C-labeled organic compounds and<br />
agrochemicals; biosynthesis studies<br />
involving complex lipids, phospholipids,<br />
and glycolipids; radiochemical purity<br />
quality assurance (QA) analyses for<br />
tracer or metabolism studies;<br />
radiolabeled reporter gene or enzyme<br />
assays; quantitative radiolabeled<br />
biochemical separations (programmable<br />
scanning and quick change magnetic<br />
collimators can be used for optimization<br />
of resolution and sensitivity); and study<br />
of constitutive expression of<br />
25-D 3 -1alpha-hydroxylase in a<br />
transformed proximal tubule cell line:<br />
evidence for direct regulation of<br />
vitamin D metabolism by calcium (7).<br />
<strong>Raytest</strong> GITA<br />
The GITA gamma isotope TLC<br />
analyzer (Figure 7) is an X-Y scanner<br />
controlled by a personal computer (PC)<br />
Figure 5. Determination of radiochemical<br />
purity for the 90 Y-based drug Zevalin on multiple<br />
TLC strips simultaneously<br />
(courtesy of PerkinElmer).<br />
� Copyright 2009 by AOAC INTERNATIONAL. Reprinted with permission. JOURNAL OF AOAC INTERNATIONAL VOL. 92, NO. 1, 2009
A Field Guide to In stru men ta tion<br />
Figure 6. AR-2000 TLC imaging scanner<br />
(courtesy of Bioscan Inc.).<br />
for automatic measurement, data<br />
evaluation, and report printing. It scans<br />
along one trace from start to front and<br />
then goes to the next preprogrammed<br />
trace position and scans that trace with<br />
individual nuclide settings. The<br />
V-shaped bismuth germanate (BGO-V)<br />
crystal scintillation probe detector,<br />
mounted in tungsten shielding, can be<br />
automatically energy calibrated using a<br />
137 Cs standard, and many energy<br />
windows can be preprogrammed for<br />
various nuclides. Collimators of 3 mm<br />
(stainless steel) and 5–20 mm (tungsten)<br />
size are available to optimize resolution<br />
and sensitivity for gamma detection in<br />
different energy ranges (0–60, 60–150,<br />
150–250, 250–450, and >450 keV)<br />
depending on the radioactive compound.<br />
Up to 80 sample traces can be<br />
programmed in terms of location, scan<br />
speed, etc., in both directions on two 20<br />
� 20 cm plates. Specifications include<br />
energy 0–2000 keV, activity<br />
10–100 000 Bq, sensitivity 20 Bq for<br />
99m Tc, resolution 2 mm for 99m Tc, linearity<br />
10 5 , and decay correction. A single<br />
chromatogram can be displayed live on<br />
the screen of a connected PC, and<br />
multiple traces can be displayed in 3<br />
dimensions. Peak integration can be<br />
performed manually or automatically,<br />
and measurement and data handling are<br />
digital (single event counting). A typical<br />
scan of a TLC zone containing a gamma<br />
radiolabeled compound is shown in<br />
Figure 8. Beta/positron detection can be<br />
made using an optional Geiger-Mueller<br />
(GM) detector ( 3<br />
H is not detected).<br />
<strong>Raytest</strong> miniGITA Star<br />
The miniGITA Star (Figure 9) is a<br />
scanner for gamma and beta/positron<br />
radiation from TLC zones that is similar<br />
to the GITA. The major differences are<br />
that the scan area is 5 � 20 cm and only<br />
one trace can be made at a time in the X<br />
direction. The BGO-V crystal has a 3 �<br />
25 mm entry window and is 25 mm high,<br />
and the tungsten shielding has an outside<br />
diameter of 70 mm.<br />
<strong>Raytest</strong> RITA Star<br />
The RITA Star beta radiation TLC<br />
analyzer (Figure 10) has a position<br />
sensitive proportional gas flow counter<br />
detector with an active length of 200 mm<br />
and active width of 20, 15, 10, 3, or<br />
1 mm controllable by exchange of the<br />
diaphragm. The sensing element is gold<br />
plated for easy cleaning and long life.<br />
For measurement of low energy betas<br />
from 3 H, the counting tube is used open<br />
(without any window) and is placed as<br />
close as possible to the radioactive TLC<br />
zone. Therefore, the detector rests on the<br />
surface of the layer in order to close the<br />
counting chamber and reduce gas<br />
leakage, and the gold-plated tungsten<br />
counting wire can be accurately aligned<br />
for optimum results. The entrance<br />
window is closed for 14<br />
C and other beta<br />
emitting nuclides. The counting tube is<br />
automatically moved to measure traces<br />
of multiple chromatograms on a layer.<br />
2D thin-layer chromatograms are<br />
measured by assembling individual<br />
one-dimensional traces. Data collection,<br />
analysis, and documentation meet GLP<br />
requirements. Two 20 � 20 cm plates can<br />
be measured at once.<br />
The RITA Star is designed for<br />
maximum sensitivity for low energy<br />
emitting nuclides such as 3<br />
H, 14<br />
C, 35<br />
S, 33<br />
P,<br />
and 32 P. Sensitivity and resolution values<br />
are 100 dpm/peak and 0.5 mm for 3 H,<br />
and 10 dpm/peak and 1 mm for 14<br />
C,<br />
respectively, and the dynamic range is<br />
10 6 . Background is 80 cpm/200 mm.<br />
Position deviations of the counting tube<br />
are less than 0.5 mm over the 200 mm<br />
length. The counting gas is 90% Ar and<br />
10% methane (P10 gas) with a<br />
0.5–1 L/min flow rate.<br />
Gamma and positron emitting<br />
nuclides such as 125<br />
I, 99m<br />
Tc, and 18<br />
F are<br />
detected more sensitively using the<br />
GITA or miniGITA Star.<br />
<strong>Raytest</strong> MARITA Star<br />
The MARITA Star (Figure 11) is an<br />
automatic single-trace instrument for<br />
measurement of one 5 � 20 cm TLC<br />
plate. The same position sensitive<br />
Figure 7. GITA gamma TLC scanner<br />
(courtesy of <strong>Raytest</strong>).<br />
JOURNAL OF AOAC INTERNATIONAL VOL. 92, NO. 1, 2009. � Copyright 2009 by AOAC INTERNATIONAL. Reprinted with permission.
A Field Guide to In stru men ta tion<br />
Figure 8. Scan of a thin-layer chromatogram containing a 99m Tc-labeled compound obtained using a<br />
GITA with gamma detector (courtesy of <strong>Raytest</strong>).<br />
proportional counter detector is used as<br />
for the RITA Star, and the resolution,<br />
sensitivity, and background specifications<br />
are the same.<br />
Applications<br />
TLRC with the described techniques<br />
and modern instruments can be used,<br />
among other applications, for animal,<br />
human, and plant metabolism analysis;<br />
biodistribution studies; toxicology<br />
studies; separation, detection, and<br />
quantification of separated radioactive<br />
zones of all compound classes; and<br />
radiopharmaceutical synthesis, QC, and<br />
purity, efficacy, and stability<br />
determinations. The phosphor imaging<br />
and in situ scanning instruments are<br />
highly automated and have significant<br />
advantages in terms of simplicity, speed,<br />
accuracy, precision, and sensitivity<br />
compared to traditional film<br />
autoradiography or scraping followed by<br />
LSC. The in situ scanner methods are<br />
direct analyses that minimize technician<br />
radiation exposure and do not require<br />
disposal of contaminated screens or<br />
liquid waste.<br />
The following are a selection of<br />
references reporting studies using the<br />
TLRC methods described above:<br />
3�-sulfonylesters of 2.5�-anhydro-<br />
1-(2-deoxy-beta-D-threo-pentofuranosyl)<br />
thymine as precursors for the synthesis<br />
of<br />
18<br />
F-fluorothymidine (FLT; 8);<br />
molecular cloning and biochemical<br />
characterization of a serine threonine<br />
prorein kinase, PknL, from<br />
Mycobacterium tuberculosis (9);<br />
preparation, QC, and biodistribution of<br />
67<br />
Ga-DOTA (tetraazacyclododecanetetraacetic<br />
acid)-anti-CD20 (CD 20 is a<br />
nonglycosylated phosphoprotein expressed<br />
on the surface of mature B-cells; 10);<br />
synthesis and biodistribution of<br />
99m<br />
Tc-glucoheptonoate-guanine (11);<br />
preparation, QC, and stability of<br />
99m 14<br />
Tc-cefuroxime axetil (12); C-benzyl<br />
acetate as a radiotracer for measurement<br />
of glial metabolism in rat brain (13);<br />
18<br />
analysis of F-labeled synthesis<br />
products by radioactivity scanning, film<br />
autoradiography, and phosphor<br />
imaging (14); phosphor imaging<br />
analysis of short-lived radioactive<br />
metabolites from microdyalysis<br />
fractions (15); quantification of<br />
sphingomyelin-derived 32 P-ceramide in<br />
tissue and plasma from humans and mice<br />
with Niemann-Pick disease using a<br />
phosphor imaging system after TLC<br />
separation (16); investigation of<br />
(-)-deprenyl metabolism using<br />
reaction-displacement TLC with 2D<br />
position sensitive proportional counting<br />
scanning (PSPCS; 17); radioscanning<br />
quantitative characterization of<br />
insecticidal sugar esters of petunia (18);<br />
quantitative PSPCS for the analysis of<br />
neutral 14 C-lipids neosynthesized by the<br />
human sebaceous gland (19);<br />
quantitative assessment of microsomal<br />
tolbutamide hydroxylation by a<br />
TLC-phosphor imager technique (20);<br />
isolation and identification of 3 H- and<br />
14<br />
C-deramciclane in different biological<br />
matrixes such as plasma and urine by<br />
Figure 9. miniGITA Star beta radiation scanner<br />
with GM tube detector (courtesy of <strong>Raytest</strong>).<br />
� Copyright 2009 by AOAC INTERNATIONAL. Reprinted with permission. JOURNAL OF AOAC INTERNATIONAL VOL. 92, NO. 1, 2009
A Field Guide to In stru men ta tion<br />
Figure 10. RITA Star beta TLC scanner<br />
(courtesy of <strong>Raytest</strong>).<br />
octadecylsilyl (C18) SPE,<br />
overpressurized layer chromatography<br />
(OPLC)-PSPCS, and mass<br />
spectrometry (21); fate of<br />
14<br />
C-diphenylamine in apples based on<br />
radioscanning (22); rapid assay for nitric<br />
oxide synthase by autoradiography and<br />
radiometric scanning of L- 14<br />
C-arginine<br />
Beckman Coulter, Inc.<br />
4300 N. Harbor Blvd<br />
PO Box 3100<br />
Fullerton, CA 92834-3100<br />
600-742-2345<br />
http://www.beckmancoulter.com<br />
Bioscan Inc.<br />
4590 MacArthur Blvd, N.W.<br />
Washington, DC 20007<br />
800-255-7226<br />
http://www.bioscan.com<br />
and -citrulline (23); adsorption and<br />
mobility of the fungicide metalaxyl in<br />
vineyard soils with 14 C detection by a<br />
Bio-Image analyzer (24); metabolism of<br />
the herbicide 2,4-dichlorophenoxyacetic<br />
acid (2,4-D) in laying hens and lactating<br />
goats with detection of radioactive zones<br />
by a radio-TLC scanner (25);<br />
degradation of the pesticide<br />
14 C-carfentrazone-ethyl under aerobic<br />
aquatic conditions with detection of<br />
radioactive zones using an imaging<br />
Figure 11. MARITA Star beta TLC scanner<br />
(courtesy of <strong>Raytest</strong>).<br />
Contact Information<br />
Fujifilm Life Science USA<br />
419 West Ave<br />
Stamford, CT 06902<br />
886-902-3854<br />
http://www.fujifilmlifescienceusa.com<br />
PerkinElmer Inc.<br />
940 Winter St<br />
Waltham, MA 02451<br />
800-762-4000<br />
http://www.perkinelmer.com<br />
scanner (26); separation and assay of<br />
14<br />
C-labeled glyceryl trinitrate and its<br />
metabolites by OPLC-PSPCS (27);<br />
pharmacokinetics and metabolism of the<br />
novel muscarinic receptor against<br />
SNI-2011 (cevimeline) in rats and dogs<br />
with 2D-TLC and bioimaging<br />
analysis (28); and combinatorial<br />
enzymatic phosphor imaging assay for<br />
the high throughput screening of a new<br />
class of bacterial cell wall<br />
inhibitors (29).<br />
<strong>Raytest</strong> USA, Inc.<br />
515 Cornelius Harnett Dr<br />
Wilmington, NC 28401<br />
800-887-2666<br />
http://www.raytest.com<br />
—Joseph Sherma<br />
John D. & Frances H. Larkin<br />
Professor Emeritus<br />
Department of Chemistry<br />
Lafayette College<br />
shermaj@lafayette.edu<br />
JOURNAL OF AOAC INTERNATIONAL VOL. 92, NO. 1, 2009. � Copyright 2009 by AOAC INTERNATIONAL. Reprinted with permission.
A Field Guide to In stru men ta tion<br />
References<br />
(1) Sherma, J. (2001) in Encyclopedia of Chromatography, J. Cazes (Ed.), Marcel Dekker, Inc., New York, NY, pp 572–576<br />
(2) Sherma, J. (2005) in Encyclopedia of Chromatography, 2nd Ed., J. Cazes (Ed.), Taylor & Francis, CRC Press, Boca Raton, FL, pp 1232–1240<br />
(3) Sherma, J. (2000) Inside Laboratory Management 4(10) 5–9<br />
(4) Sherma, J. (2008) J. AOAC Int. 91, 51A–58A<br />
(5) Klebovich, I. (2001) in Planar Chromatography, S.Z. Nyiredy (Ed.), Springer Scientific Publisher, Budapest, Hungary<br />
(6) Hazai, I., & Klebovich, I. (2003) in Handbook of <strong>Thin</strong> <strong>Layer</strong> Chromatography, 3rd Ed., J. Sherma & B. Fried (Eds), Marcel Dekker, Inc., New York,<br />
NY, pp 339–360<br />
(7) Bland, R., Walker, E.A., Hughes, S.V., Stewart, P.M., & Hewison, M. (1999) Endocrinology 140, 2027–2034<br />
(8) Windhorst, A.D., Klein, P.J., Eisenbarth, J., Oeser, T., Kruijer, P.S., & Eisenhut, M. (2008) Nucl. Med. Biol. 35, 413–423<br />
(9) Lakshminarayan, H., Narayanan, S., Bach, H., Sundaram, K.G.P., & Av-Gay, Y. (2008) Protein Expres. Purif. 58, 309–317<br />
(10) Jalilian, A.R., Mirsadeghi, L., Haji-Hosseini, R., & Khorrami, A. (2008) Radiochim. Acta 96, 167–174<br />
(11) Unak, P., Teksoz, S., Muftuler, F.Z.B., Medine, E.J., Acar, C., & Yurekli, Y. (2008) J. Radioanal. Nucl. Chem. 275, 379–385<br />
(12) Lambrecht, F.Y., Durkan, K., & Unak, P. (2008) J. Radioanal. Nucl. Chem. 275, 161–164<br />
(13) Monosaki, S., Hosoi, R., Sanuki, T., Todoroki, K., Yamaguchi, M., Gee, A., & Inoue, O. (2007) Nucl. Med. Biol. 34, 939–944<br />
(14) Kamarainen, E.L., Haaparanta, M., Siitari-Kauppi, M., Koivula, T., Lipponen, T., & Solin, O. (2006) Appl. Radiat. Isotopes 64, 1043–1047<br />
(15) Haaparanta, M., Gronroos, T., Eskola, O., & Solin, O. (2006) J. Chromatogr. A 1108, 136–139<br />
(16) He, X., Chen, F., Gatt, S., & Schuchman, E.H. (2001) Anal. Biochem. 293, 204–211<br />
(17) Kalasz, H., Lengyel, J., Szarvas, T., Morovjan, G., & Klebovich, I. (2003) J. Planar Chromatogr.-Mod. TLC 16, 381–385<br />
(18) Chortyk, O.T., Kays, S.J., & Teng, Q. (1997) J. Agric. Food Chem. 45, 270–275<br />
(19) Christelle, C., Vingler, P., Boyera, N., Galey, I., & Bernard, B.A. (1997) J. Planar Chromatogr.-Mod. TLC 10, 243–250<br />
(20) Ludwig, E., Wolfinger, H., & Ebner, T. (1998) J. Chromatogr. B 707, 347–350<br />
(21) Ludanyi, K., Vekey, K., Szunyog, J., Mincsovics, E., Karancsi, T., Ujszaszy, K., Nemes, K.B., & Klebovich, I. (1998) J. AOAC Int. 82, 231–238<br />
(22) Haesook, K.K., Roninson, R.A., & Wu, J. (1998) J. Agric. Food Chem. 46, 707–717<br />
(23) Kumar, V.B., Bernardo, A.E., Alshaher, M.M., Buddhiraju, M., Purushothaman, R., & Morley, J.E. (1999) Anal. Biochem. 269, 17–20<br />
(24) Andrades, M.S., Sanchez-Martin, M.J., & Sanchez-Camazano, M. (2001) J. Agric. Food Chem. 49, 2363–2369<br />
(25) Barnekow, D.E., Hamburg, A.W., Puvanesarajah, V., & Guo, M. (2001) J. Agric. Food Chem. 49, 156–163<br />
(26) Elmarakby, S.A., Suplee, D.M., & Cook, R. (2001) J. Agric. Food Chem. 49, 5285–5293<br />
(27) Klebovich, I., Morovjan, G., Hazai, I., & Mincsovics, E. (2002) J. Planar Chromatogr.-Mod. TLC 15, 404–409<br />
(28) Washio, T., Kohsaka, K., Arisawa, H., & Masunaga, H. (2003) Arzneim.-Forsch. Drug Res. 53, 26–33<br />
(29) El Zoeiby, A., Beaumont, M., Bubuc, E., Sanschagrin, F., Voyer, N., & Levesque, R.C. (2003) Bioorg. Med. Chem. 11, 1583–1592<br />
The Journal of AOAC INTERNATIONAL has granted permission to use A Field Guide to Instrumentation (Vol. 92, Issue 1) to RayTest USA, Inc.<br />
AOAC INTERNATIONAL is a globally recognized, independent, not-for-profit association founded in 1884. To attain its vision of “worldwide<br />
confidence in analytical results,” AOAC serves communities of the analytical sciences by providing the tools and processes necessary to develop<br />
voluntary consensus standards or technical standards through stakeholder consensus and working groups in which the fit-for-purpose and method<br />
performance criteria are established and fully documented.<br />
AOAC is committed to linking the success of its business model with a resolve to helping its clients reach their institutional and corporate goals.<br />
To this end, AOAC is poised to tailor its services to meet the analytical quality needs of its customers. A turnkey approach may be utilized to<br />
develop a package of services for our clients.<br />
AOAC provides credibility, acceptability, and defensibility that are the results of the Association’s status as an independent, science-based, third-party<br />
organization with a 125-year-old brand name. From the traditional Official Methods SM and Annual Meetings to the newer consensus-building activities<br />
and prevalidation documentation, AOAC aims to continue to serve its members and maintain the Association’s relevance.<br />
For more information about AOAC INTERNATIONAL, please visit http://www.aoac.org/<br />
� Copyright 2009 by AOAC INTERNATIONAL. Reprinted with permission. JOURNAL OF AOAC INTERNATIONAL VOL. 92, NO. 1, 2009