

2017 State of Consumerism in Healthcare_final (1)

Create successful ePaper yourself
Turn your PDF publications into a flip-book with our unique Google optimized e-Paper software.
<strong>2017</strong> STATE OF CONSUMERISM IN HEALTHCARE<br />
Consumer Insights Are Incomplete and Applied<br />
Inconsistently, if at All<br />
To better address consumer needs, organizations must have access to reliable data from a variety<br />
<strong>of</strong> sources to better understand consumers’ behaviors and priorities. Yet nearly three-fourths <strong>of</strong><br />
organizations received low Tier 3 and Tier 4 rat<strong>in</strong>gs relative to their efforts to gather, analyze, and<br />
leverage consumer <strong>in</strong>sights for decision mak<strong>in</strong>g (Figure 9).<br />
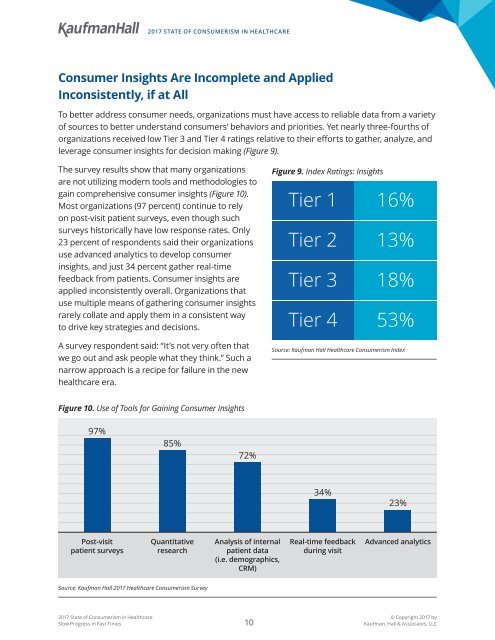
The survey results show that many organizations<br />
are not utiliz<strong>in</strong>g modern tools and methodologies to<br />
ga<strong>in</strong> comprehensive consumer <strong>in</strong>sights (Figure 10).<br />
Most organizations (97 percent) cont<strong>in</strong>ue to rely<br />
on post-visit patient surveys, even though such<br />
surveys historically have low response rates. Only<br />
23 percent <strong>of</strong> respondents said their organizations<br />
use advanced analytics to develop consumer<br />
<strong>in</strong>sights, and just 34 percent gather real-time<br />
feedback from patients. Consumer <strong>in</strong>sights are<br />
applied <strong>in</strong>consistently overall. Organizations that<br />
use multiple means <strong>of</strong> gather<strong>in</strong>g consumer <strong>in</strong>sights<br />
rarely collate and apply them <strong>in</strong> a consistent way<br />
to drive key strategies and decisions.<br />
A survey respondent said: “It’s not very <strong>of</strong>ten that<br />
we go out and ask people what they th<strong>in</strong>k.” Such a<br />
narrow approach is a recipe for failure <strong>in</strong> the new<br />
healthcare era.<br />
Figure 9. Index Rat<strong>in</strong>gs: Insights<br />
Tier 1 16%<br />
Tier 2 13%<br />
Tier 3 18%<br />
Tier 4 53%<br />
Source: Kaufman Hall <strong>Healthcare</strong> <strong>Consumerism</strong> Index<br />
Figure 10. Use <strong>of</strong> Tools for Ga<strong>in</strong><strong>in</strong>g Consumer Insights<br />
97%<br />
85%<br />
72%<br />
34%<br />
23%<br />
Post-visit<br />
patient surveys<br />
Quantitative<br />
research<br />
Analysis <strong>of</strong> <strong>in</strong>ternal<br />
patient data<br />
(i.e. demographics,<br />
CRM)<br />
Real-time feedback<br />
dur<strong>in</strong>g visit<br />
Advanced analytics<br />
Source: Kaufman Hall <strong>2017</strong> <strong>Healthcare</strong> <strong>Consumerism</strong> Survey<br />
<strong>2017</strong> <strong>State</strong> <strong>of</strong> <strong>Consumerism</strong> <strong>in</strong> <strong>Healthcare</strong><br />
Slow Progress <strong>in</strong> Fast Times<br />
10<br />
© Copyright <strong>2017</strong> by<br />
Kaufman, Hall & Associates, LLC