

2017 State of Consumerism in Healthcare_final (1)

You also want an ePaper? Increase the reach of your titles
YUMPU automatically turns print PDFs into web optimized ePapers that Google loves.
<strong>2017</strong> STATE OF CONSUMERISM IN HEALTHCARE<br />
Organizations Have a Narrow View <strong>of</strong> Consumer Experience<br />
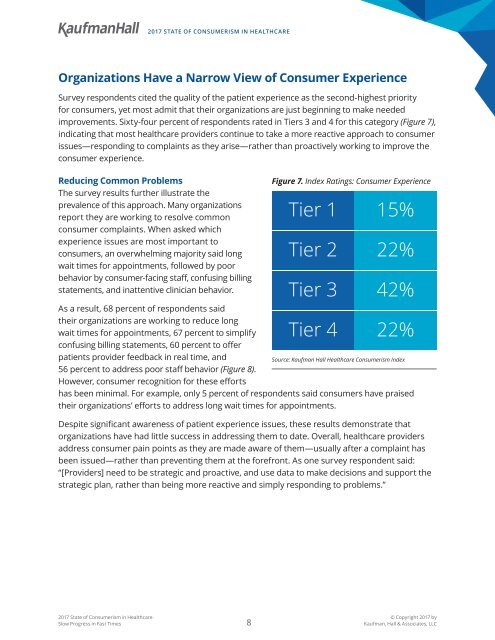
Survey respondents cited the quality <strong>of</strong> the patient experience as the second-highest priority<br />
for consumers, yet most admit that their organizations are just beg<strong>in</strong>n<strong>in</strong>g to make needed<br />
improvements. Sixty-four percent <strong>of</strong> respondents rated <strong>in</strong> Tiers 3 and 4 for this category (Figure 7),<br />
<strong>in</strong>dicat<strong>in</strong>g that most healthcare providers cont<strong>in</strong>ue to take a more reactive approach to consumer<br />
issues—respond<strong>in</strong>g to compla<strong>in</strong>ts as they arise—rather than proactively work<strong>in</strong>g to improve the<br />
consumer experience.<br />
Reduc<strong>in</strong>g Common Problems<br />
The survey results further illustrate the<br />
prevalence <strong>of</strong> this approach. Many organizations<br />
report they are work<strong>in</strong>g to resolve common<br />
consumer compla<strong>in</strong>ts. When asked which<br />
experience issues are most important to<br />
consumers, an overwhelm<strong>in</strong>g majority said long<br />
wait times for appo<strong>in</strong>tments, followed by poor<br />
behavior by consumer-fac<strong>in</strong>g staff, confus<strong>in</strong>g bill<strong>in</strong>g<br />
statements, and <strong>in</strong>attentive cl<strong>in</strong>ician behavior.<br />
Figure 7. Index Rat<strong>in</strong>gs: Consumer Experience<br />
Tier 1<br />
Tier 2<br />
Tier 3<br />
15%<br />
22%<br />
42%<br />
As a result, 68 percent <strong>of</strong> respondents said<br />
their organizations are work<strong>in</strong>g to reduce long<br />
wait times for appo<strong>in</strong>tments, 67 percent to simplify<br />
confus<strong>in</strong>g bill<strong>in</strong>g statements, 60 percent to <strong>of</strong>fer<br />
Tier 4 22%<br />
patients provider feedback <strong>in</strong> real time, and<br />
Source: Kaufman Hall <strong>Healthcare</strong> <strong>Consumerism</strong> Index<br />
56 percent to address poor staff behavior (Figure 8).<br />
However, consumer recognition for these efforts<br />
has been m<strong>in</strong>imal. For example, only 5 percent <strong>of</strong> respondents said consumers have praised<br />
their organizations’ efforts to address long wait times for appo<strong>in</strong>tments.<br />
Despite significant awareness <strong>of</strong> patient experience issues, these results demonstrate that<br />
organizations have had little success <strong>in</strong> address<strong>in</strong>g them to date. Overall, healthcare providers<br />
address consumer pa<strong>in</strong> po<strong>in</strong>ts as they are made aware <strong>of</strong> them—usually after a compla<strong>in</strong>t has<br />
been issued—rather than prevent<strong>in</strong>g them at the forefront. As one survey respondent said:<br />
“[Providers] need to be strategic and proactive, and use data to make decisions and support the<br />
strategic plan, rather than be<strong>in</strong>g more reactive and simply respond<strong>in</strong>g to problems.”<br />
<strong>2017</strong> <strong>State</strong> <strong>of</strong> <strong>Consumerism</strong> <strong>in</strong> <strong>Healthcare</strong><br />
Slow Progress <strong>in</strong> Fast Times<br />
8<br />
© Copyright <strong>2017</strong> by<br />
Kaufman, Hall & Associates, LLC