Atlas of Flood Maps
Atlas of Flood Maps
Atlas of Flood Maps
You also want an ePaper? Increase the reach of your titles
YUMPU automatically turns print PDFs into web optimized ePapers that Google loves.
EU <strong>Flood</strong> Risk <strong>Maps</strong> Q4310 September, 2007<br />
Examples from EU countries<br />
WL | Delft Hydraulics<br />
4.2 Belgium<br />
4.2.1 Flanders<br />
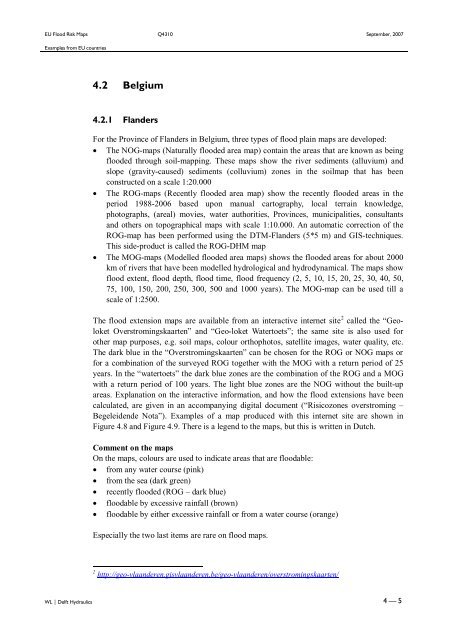
For the Province <strong>of</strong> Flanders in Belgium, three types <strong>of</strong> flood plain maps are developed:<br />
� The NOG-maps (Naturally flooded area map) contain the areas that are known as being<br />
flooded through soil-mapping. These maps show the river sediments (alluvium) and<br />
slope (gravity-caused) sediments (colluvium) zones in the soilmap that has been<br />
constructed on a scale 1:20.000<br />
� The ROG-maps (Recently flooded area map) show the recently flooded areas in the<br />
period 1988-2006 based upon manual cartography, local terrain knowledge,<br />
photographs, (areal) movies, water authorities, Provinces, municipalities, consultants<br />
and others on topographical maps with scale 1:10.000. An automatic correction <strong>of</strong> the<br />
ROG-map has been performed using the DTM-Flanders (5*5 m) and GIS-techniques.<br />
This side-product is called the ROG-DHM map<br />
� The MOG-maps (Modelled flooded area maps) shows the flooded areas for about 2000<br />
km <strong>of</strong> rivers that have been modelled hydrological and hydrodynamical. The maps show<br />
flood extent, flood depth, flood time, flood frequency (2, 5, 10, 15, 20, 25, 30, 40, 50,<br />
75, 100, 150, 200, 250, 300, 500 and 1000 years). The MOG-map can be used till a<br />
scale <strong>of</strong> 1:2500.<br />
The flood extension maps are available from an interactive internet site 2 called the “Geoloket<br />
Overstromingskaarten” and “Geo-loket Watertoets”; the same site is also used for<br />
other map purposes, e.g. soil maps, colour orthophotos, satellite images, water quality, etc.<br />
The dark blue in the “Overstromingskaarten” can be chosen for the ROG or NOG maps or<br />
for a combination <strong>of</strong> the surveyed ROG together with the MOG with a return period <strong>of</strong> 25<br />
years. In the “watertoets” the dark blue zones are the combination <strong>of</strong> the ROG and a MOG<br />
with a return period <strong>of</strong> 100 years. The light blue zones are the NOG without the built-up<br />
areas. Explanation on the interactive information, and how the flood extensions have been<br />
calculated, are given in an accompanying digital document (“Risicozones overstroming –<br />
Begeleidende Nota”). Examples <strong>of</strong> a map produced with this internet site are shown in<br />
Figure 4.8 and Figure 4.9. There is a legend to the maps, but this is written in Dutch.<br />
Comment on the maps<br />
On the maps, colours are used to indicate areas that are floodable:<br />
� from any water course (pink)<br />
� from the sea (dark green)<br />
� recently flooded (ROG – dark blue)<br />
� floodable by excessive rainfall (brown)<br />
� floodable by either excessive rainfall or from a water course (orange)<br />
Especially the two last items are rare on flood maps.<br />
2 http://geo-vlaanderen.gisvlaanderen.be/geo-vlaanderen/overstromingskaarten/<br />
4—5


