WCG-Global-Leasing-Report-2017

You also want an ePaper? Increase the reach of your titles
YUMPU automatically turns print PDFs into web optimized ePapers that Google loves.
<strong>2017</strong><br />
<strong>Global</strong><br />
<strong>Leasing</strong><br />
<strong>Report</strong><br />
BY BRENDAN GLEESON<br />
GROUP CEO<br />
WHITE CLARKE GROUP<br />
CONTINUOUS GROWTH AND<br />
BRIGHT PROSPECTS FOR THE<br />
GLOBAL LEASING INDUSTRY
WHITE CLARKE GROUP GLOBAL LEASING REPORT<br />
Your complimentary copy of<br />
the <strong>Global</strong> <strong>Leasing</strong> <strong>Report</strong> <strong>2017</strong><br />
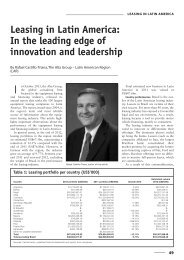
I am delighted to present you with this latest edition of the White<br />
Clarke Group <strong>Global</strong> <strong>Leasing</strong> <strong>Report</strong> <strong>2017</strong>. The GLR has become<br />
the definitive analysis of country trading environments and world<br />
trends in auto and asset leasing and I am proud that this is the<br />
11th year that our report has featured as the keynote commentary<br />
of the World <strong>Leasing</strong> Yearbook.<br />
You will find the latest auditable data on volume and growth by<br />
region, market penetration, GDP ratios and market shares, complete<br />
with a ranking of the top 50 leasing markets by size worldwide.<br />
For the fifth consecutive year since the global economic<br />
crisis, the leasing industry has expanded, with the top 50<br />
leasing markets growing new business volume by 6.5%, from<br />
US$994.31bn in 2014 to more than US$1trillion in 2015. Three<br />
regions, North America, Europe and Asia, account for more<br />
than 90% of total world volume.<br />
Brendan Gleeson, Group CEO,<br />
White Clarke Group<br />
Latin America recorded growth of 28.9%, showing the largest<br />
percentage rise among all global regions. This is followed by<br />
Asia, which has shown continuous growth over the last few years<br />
and is up by 14.4%. North America has also seen an impressive<br />
growth of 10.7%.<br />
The outlook for all six regions looks cautiously optimistic given<br />
the reported growth in most regions. However, the year 2016 has<br />
brought some significant economic and political events, namely<br />
Brexit and the election of Donald Trump to the US Presidency.<br />
Both events have short term turbulence upon the global FX and<br />
stock markets. It is too early to assess how these events may<br />
impact upon the economies of the world and the global leasing<br />
industry in the medium term, but there may be some resulting<br />
economic instability in <strong>2017</strong>.<br />
I hope you will enjoy this report and feel free to comment or ask<br />
questions info@whiteclarkegroup.com<br />
2<br />
© WORLD LEASING YEARBOOK
WHITE CLARKE GROUP GLOBAL LEASING REPORT<br />
About White Clarke Group<br />
World <strong>Leasing</strong> Yearbook<br />
White Clarke Group is the global first-class provider<br />
in end-to-end automotive and asset finance software<br />
solutions and consulting services. It is a global organization<br />
employing around 500 professionals, with offices in the UK,<br />
US, Canada, Australia, Austria, Germany, India and China.<br />
The company’s award-winning CALMS end-to-end platform<br />
provides a flexible workflow approach that automates the<br />
entire business process from origination through contract<br />
to portfolio management—trusted by more than 100<br />
customers in 30 countries around the globe.<br />
The White Clarke Group <strong>Global</strong> <strong>Leasing</strong> <strong>Report</strong> is prepared<br />
by White Clarke Group in association with the World<br />
<strong>Leasing</strong> Yearbook. This report is an extract from the<br />
complete <strong>Global</strong> <strong>Leasing</strong> <strong>Report</strong> which is part of the 352<br />
page World <strong>Leasing</strong> Yearbook. To obtain the full report,<br />
which contains 7 additional tables and figures, you can<br />
purchase the book at www.world-leasing-yearbook.com<br />
or call +44 (0)1206 579591<br />
For more information, please visit<br />
www.whiteclarkegroup.com<br />
3<br />
© WORLD LEASING YEARBOOK
WHITE CLARKE GROUP GLOBAL LEASING REPORT<br />
Continuous growth and bright<br />
prospects for the global<br />
leasing industry<br />
By Brendan Gleeson, Group CEO, White Clarke Group<br />
The White Clarke Group <strong>Global</strong> <strong>Leasing</strong> <strong>Report</strong><br />
continues a history of tracking the worldwide<br />
market for leasing products for more than 30<br />
years. Following the continuing recovery from<br />
the global economic crisis, the leasing industry<br />
experienced significant growth in 2015 and<br />
has introduced new innovative ways to finance<br />
equipment for companies worldwide.<br />
All values are quoted in US dollars.<br />
Overview<br />
For the fifth consecutive year since the global<br />
economic crisis, the global leasing industry maintained<br />
an optimistic outlook and has experienced growth in<br />
new business volumes.<br />
The top 50 countries reported growth in new business<br />
volume of 6.5%, from US$994.31bn in 2014 to more<br />
than US$1 trillion in 2015. Three regions, North America,<br />
Europe and Asia, account for more than 90% of total<br />
world volume.<br />
The North American region posted impressive growth<br />
of 10.7%. Latin America recorded growth of 28.9%<br />
in 2015, and showed the largest percentage rise<br />
among all the global regions. Another region that<br />
is experiencing continuous growth is Asia where<br />
business was up 14.4%.<br />
Contrastingly, Europe reported a small decline in total<br />
leasing volume when expressed in US dollars, which<br />
was not due to the recession in parts of the Eurozone<br />
but rather reflects the impact of the dollar to euro<br />
exchange rates (see below for further explanation).<br />
The Australia/New Zealand region experienced the<br />
same volume of business in local currency, but again<br />
fell 12.4% when expressed in US dollars.<br />
North America<br />
The North American region comprises the US, Canada<br />
and Mexico. The region has maintained its position as<br />
the world’s largest market, with new business volume<br />
of US$407.8bn in 2015. It has now increased its share<br />
of the total global market in equipment leasing to 42.1%.<br />
The US is the main dominant player of the region, and<br />
is the largest single market in the world. In 2015 new<br />
business volume was US$374bn, 15% greater than the<br />
subsequent largest region (Europe with US$322.8bn).<br />
The changing landscape of asset-based finance<br />
business in the US has prompted the Equipment<br />
<strong>Leasing</strong> & Finance Foundation (ELFF) to shift its focus<br />
from pure leasing and hire purchase to encompass a<br />
broader set of financial instruments. In 2015 the total<br />
US equipment finance industry (leasing plus secured<br />
loans and lines of credit) exceeded US$1 trillion and is<br />
expected to grow further in 2016.<br />
4<br />
© WORLD LEASING YEARBOOK
WHITE CLARKE GROUP GLOBAL LEASING REPORT<br />
Table 1: Volume and growth by region (2014–2015)<br />
Rank by<br />
volume<br />
Region<br />
Annual volume<br />
(US$bn)<br />
Growth 2014–2015<br />
(%)<br />
Percentage of world<br />
market volume 2014<br />
Percentage of world<br />
market volume 2015<br />
Change in market<br />
share 2014–2015<br />
1 N America 407.8 10.7 39.0 40.6 1.52<br />
2 Europe 322.8 –1.5 34.7 32.1 –2.6<br />
3 Asia 223.0 14.4 20.6 22.2 1.5<br />
4 Aus/NZ 31.2 –12.4 3.8 3.1 –0.7<br />
5 S America 13.8 28.9 1.1 1.4 0.2<br />
6 Africa 6.7 –0.7 0.7 0.7 0.0<br />
Total 1,005.30<br />
Source: White Clarke Group <strong>Global</strong> <strong>Leasing</strong> <strong>Report</strong>.<br />
The Canadian Finance & <strong>Leasing</strong> Association (CFLA) has<br />
reassessed the way it compiles sales volume since 2013.<br />
This has improved the reliability of the data; however, the<br />
whole region lacks the granularity of data available from<br />
other regions. Overall Canada reported sales volume<br />
of US$26.21bn and modest growth of 3.4%, which was<br />
impacted upon by the collapse of oil prices in 2014.<br />
There was poor performance in some European<br />
countries reflecting the weak state of the domestic<br />
economies, notably: Russia (20% decline), Ukraine (70%<br />
decline) and Greece (3% decline). Ukraine has now<br />
exited the table of top 50 countries. No surprise given<br />
the annexation of the Crimea by Russia and the war in<br />
eastern Ukraine and the resulting economic fallout.<br />
Mexico experienced growth of 32% and new business<br />
volume of US$7.19bn showing the solid development of<br />
the leasing industry in that region.<br />
Europe<br />
Each year Europe competes with the US for the top<br />
position in the world’s leasing market share, and<br />
each have new business volume of US$322.8bn<br />
and US$374.35bn respectively.<br />
Europe accounts for 33.2% of world volume and<br />
five European countries feature in the world’s top<br />
10 countries for new business, contributing 68%<br />
of the total volume.<br />
In local currency, the European region grew by 10.3%.<br />
However, when expressed in US dollars, Europe<br />
experienced negative growth of –1.5%. (Note: The<br />
European growth figures reported in Table 2 refer<br />
to the growth figures in local currency). See the full<br />
Leaseurope report in the World <strong>Leasing</strong> Yearbook.<br />
The United Kingdom and Germany are positioned as<br />
the third and fourth largest leasing markets in the world<br />
and remain the dominant players in Europe. Jointly they<br />
accounted for 46.9% of the European market and 15.6%<br />
of the world market. This performance was aided by<br />
the healthy performance of the UK economy with GDP<br />
growth of 3.02% and Germany at 1.71%.<br />
In 2015, the UK leasing industry captured US$87.13bn<br />
in new business volume, leading to another significant<br />
rate of growth of 14% (in local currency) compared with<br />
the previous year and positioning it in a strong third<br />
position after the US and China. The IT equipment<br />
market reported the largest rate of growth in the UK,<br />
around 38%, followed by commercial vehicle and<br />
car finance segments which also experienced<br />
double-digit growth. Overall, the UK market has<br />
demonstrated stability and efficiency when it comes<br />
to asset financing and leasing.<br />
The second largest European market is Germany with<br />
a growth of 8.42% (in local currency) in comparison to<br />
2014 and with new business volume of US$63.84bn.<br />
5<br />
© WORLD LEASING YEARBOOK
WHITE CLARKE GROUP GLOBAL LEASING REPORT<br />
WLY FC <strong>2017</strong> Spine Black v2 02/11/2016 15:07 Page 1<br />
<strong>2017</strong><br />
WORLD LEASING YEARBOOK <strong>2017</strong><br />
Covering 352 pages the NEW <strong>2017</strong> edition of the World <strong>Leasing</strong> Yearbook is your essential<br />
guide to all the current opportunities in leasing and asset finance, ensuring you keep ahead<br />
of the competition. The <strong>2017</strong> edition provides 352 pages of unrivalled data:<br />
• Over 50 country reviews covering all leasing sectors with core data and statistics.<br />
• The <strong>Global</strong> <strong>Leasing</strong> <strong>Report</strong> <strong>2017</strong> features unique data on international leasing volume<br />
and growth by region. A ranking of the Top 50 global leasing markets, global leasing<br />
statistics from 1995 to date, market penetration levels per country, GDP penetration<br />
ratios and market shares.<br />
• Features over 250 tables and graphs of essential statistical data.<br />
• An extensive review of leasing software developments for <strong>2017</strong> along with<br />
comprehensive product reviews from over 30 leasing suppliers.<br />
• The unique and comprehensive World <strong>Leasing</strong> Yearbook Database giving you access<br />
to over 5,000 companies and over 6,000 contacts in over 100 countries from all sectors<br />
of the international asset finance and leasing industry. Supplied on disc and fully<br />
downloadable and searchable.<br />
Price: £375 / US$550 (hardback and e-versions available)<br />
www.world-leasing-yearbook.com<br />
WLY17 advert 175mm x 125mm with border.indd 1 23/02/<strong>2017</strong> 14:55:41<br />
The German leasing sector is one of the most mature in<br />
the world, and hire purchase stills plays a secondary role<br />
accounting for only 13% of equipment finance compared<br />
to finance leasing of 48% and operating leasing of 39%. In<br />
2015 the share of leasing as a financing tool for investment<br />
became larger and the equipment and construction<br />
industries adopted leasing more frequently.<br />
Road vehicles remain the dominant asset class in the<br />
German economy (71%), followed by machinery (13%)<br />
and office equipment and IT systems (6%). Looking at<br />
the equipment leased by type of customer, services,<br />
manufacturing and transport segments accounted for<br />
more than the 65% of the total volume.<br />
France secured the sixth place in the <strong>Global</strong> <strong>Leasing</strong><br />
<strong>Report</strong> rankings, with new business volume of US$30.92bn<br />
and growth of 10%. This growth was mainly facilitated by<br />
low inflation and high household consumption, which led<br />
to a greater investment in leasing assets.<br />
Most of the central and eastern European countries,<br />
as mentioned above, have reported low or negative<br />
growth (i.e. Ukraine, Russia, Serbia and Estonia). The<br />
Russian leasing market was affected by the bank<br />
lending rates, and experienced a decline in growth of<br />
–20%. Nonetheless, during the second quarter of 2016<br />
new leasing reforms were discussed at the meeting of<br />
the RF Ministry of Finance Interdepartmental Working<br />
Group, and these are expected to bring future brighter<br />
prospects for the Russian leasing sector.<br />
* NB Our European figures will exhibit slight differences<br />
from those quoted by Leaseurope because The White<br />
Clarke Group <strong>Global</strong> <strong>Leasing</strong> <strong>Report</strong> adopts the US<br />
dollar as its base rate, as published at the last day of<br />
the year. Leaseurope employs the euro as its base<br />
currency, adjusted for exchange rate fluctuations.<br />
6<br />
© WORLD LEASING YEARBOOK
WHITE CLARKE GROUP GLOBAL LEASING REPORT<br />
Asia<br />
New business volume in Asia increased by 14.4% in 2015<br />
and takes a 22.2% share of the world market (around<br />
US$223bn), up from last year when the market volume for<br />
Asia was 20.6%.<br />
Small and medium-sized enterprises showed a rise<br />
for the first time in two years and large companies<br />
declined for the third year in a row. An increase in<br />
consumer tax may have been a contributor factor.<br />
The Chinese central bank cut interest rates five times<br />
during the year, making bank loans cheaper and leasing<br />
less attractive. Nonetheless, China remains the biggest<br />
player in the Asia market and increased its volume by 26%,<br />
reporting US$136.45bn new business volume in 2015.<br />
The Chinese leasing industry has positioned itself as<br />
the second largest market in the world for asset finance<br />
through leasing and hire purchase, despite experiencing<br />
the lowest growth in GDP for the past 25 years. The<br />
infrastructure and the manufacturing sectors have<br />
traditionally dominated the leasing market, but in recent<br />
years the car industry has gained market share.<br />
The Japanese leasing market recovered from last year’s<br />
decline in growth (--17% in 2014) and experienced an<br />
increase of 9% in 2015. New business volume increased<br />
from US$55bn to US$60.84bn, a growth favoured by<br />
the Abe administration’s ‘Japan Revitalization Strategy’<br />
introduced in 2013 where leasing became an instrument<br />
to promote technology.<br />
The third biggest leasing market in Asia is Korea and<br />
it is ranked 13th in the world achieving an increase in<br />
new business volume of 8% in 2015 to US$11.39bn.<br />
Transportation equipment and industrial machinery<br />
continue to be the main assets leased representing<br />
more than 80% of new business.<br />
Taiwan is the fourth largest Asian leasing market. Since<br />
2010 Taiwan has been experiencing an economic<br />
expansion and has left behind the global economic<br />
crisis’ effects which caused declines in leasing<br />
volumes in previous years. The Taiwanese leasing<br />
market is growing and in 2015 new business volume<br />
reached US$10.62bn (10% higher than 2014).<br />
Recent changes in Taiwanese regulations introduced<br />
flexible financing not otherwise available to small<br />
enterprises, with the aim of easing capital shortages<br />
for SMEs. Also in 2015, the leasing market expanded<br />
into high-tech leasing business creating optimism in<br />
the leasing industry for the future.<br />
Industrial equipment (12%), factory equipment (29%),<br />
information and communication equipment (3%) and<br />
medical equipment (9%) exhibited growth in comparison<br />
with last year, whereas construction equipment (-8.8%)<br />
and transport equipment (-3.4%) suffered negative growth.<br />
The last Asian country to make it to the <strong>Global</strong><br />
<strong>Leasing</strong> <strong>Report</strong> top 50 is India. It experienced growth<br />
of only 2.65%, just enough to be included in this<br />
year’s <strong>Report</strong>, thus eliminating a European country<br />
from the top 50 list.<br />
7<br />
© WORLD LEASING YEARBOOK
WHITE CLARKE GROUP GLOBAL LEASING REPORT<br />
Rest of the world<br />
Four countries in Africa (Egypt, Nigeria, Morocco and South<br />
Africa), five countries in Latin America (Argentina, Brazil,<br />
Chile, Colombia and Peru) plus Australia and New Zealand<br />
make up the remainder of the top 50 for 2015.<br />
In previous reports, we have isolated Australia’s volume<br />
of chattel mortgage from their rankings. Chattel mortgage<br />
plays an increasingly important role in equipment finance<br />
in Australia. Following representations from the AELA we<br />
have now accepted chattel mortgage as a form of hire<br />
purchase, with which there are important similarities.<br />
Australia moves from sixth to seventh place in world<br />
ranking, mainly due to the difference in exchange rates<br />
with the dollar. However, sales remain the same when<br />
expressed in Australian dollars (A$42.3bn).<br />
Latin American new business volume figures are not<br />
recorded by the national leasing associations, with the<br />
exception of Brazil and Chile, where the emphasis is<br />
on portfolio value. This makes it notoriously difficult to<br />
ascertain sales volume for the region, but we are most<br />
grateful, once again, to the CEO of the Alta Group—Latin<br />
American Region, Mr Rafael Castillo Triana, for giving us<br />
access to his research and facilitate us with data.<br />
Where national association figures are not available,<br />
there has been a significant downward reassessment.<br />
In the absence of growth figures, we have adopted the<br />
growth in portfolio value, giving at least some indication<br />
of the health of the industry.<br />
Adopting portfolio value as the benchmark, one of the<br />
South American countries managed to get into the top<br />
20 countries for leasing. Overall new business volume<br />
for the Latin American region grew by 28.9% in US<br />
dollars. Significant growth was seen in the Colombian<br />
leasing market which increased volume by more<br />
than 21% in 2015.<br />
Africa accounts for 0.7% of the world market in leasing<br />
and four African countries achieved a placing within the<br />
top 50 leasing threshold: Egypt, Nigeria, Morocco and<br />
South Africa. The region declined in volume (-0.7%) to<br />
US$6.7bn in 2015. The African leasing industry is still in<br />
its infancy and, apart from South Africa, there is a paucity<br />
of quantitative information available. South Africa ranked<br />
27th in the top 50 countries, with a small decline in<br />
volume of 1.16%.<br />
8<br />
© WORLD LEASING YEARBOOK
WHITE CLARKE GROUP GLOBAL LEASING REPORT<br />
Table 2: White Clarke Group <strong>Global</strong> <strong>Leasing</strong> <strong>Report</strong><br />
Ranking<br />
Continental<br />
Code<br />
Country<br />
Annual Volume<br />
(US$bn)<br />
% Growth<br />
2014–2015<br />
% Market<br />
Penetration<br />
Source<br />
1 NA US 374.35 11.10 22.0 (8)<br />
2 A China (People's Republic) 136.45 25.55 4.0 (9)<br />
3 E UK 87.13 14.01 31.1 (2)<br />
4 E Germany 63.82 8.42 16.7 (2)<br />
5 A Japan 60.84 8.94 9.6 (1)<br />
6 E France 30.92 9.93 14.2 (2)<br />
7 ANT Australia 30.85 0.01 40.0 (1)<br />
8 NA Canada 26.21 3.40 32.0 (1)<br />
9 E Sweden 18.22 12.05 22.9 (2)<br />
10 E Italy 17.67 12.52 13.0 (2)<br />
11 E Switzerland 13.79 5.25 11.5 (2)<br />
12 E Poland 12.56 16.37 17.1 (2)<br />
13 A Korea 11.39 8.10 9.4 (1)<br />
14 A Taiwan 10.62 9.80 9.3 (1)<br />
15 E Denmark 9.04 24.06 28.5 (2)<br />
16 E Russia 8.69 –19.85 n/a (2)<br />
17 E Turkey 7.69 –9.85 10.0 (1)<br />
18 E Spain 7.64 19.93 5.6 (2)<br />
19 NA Mexico 7.19 32.00 n/a (4)<br />
20 SA Colombia 6.14 21.00 n/a (4)<br />
21 E Norway 6.12 –2.39 9.8 (2)<br />
22 E Austria 6.09 5.90 13.3 (2)<br />
23 E Netherlands 5.95 21.27 6.8 (2)<br />
24 E Finland 5.06 3.74 17.2 (2)<br />
25 E Belgium 5.05 11.14 8.9 (2)<br />
26 E Czech Republic 4.11 20.34 12.0 (2)<br />
27 AF South Africa 3.10 –1.16 n/a (7)<br />
28 SA Peru 2.70 4.00 n/a (4)<br />
29 E Slovakia 2.46 17.60 15.6 (2)<br />
30 SA Brazil 2.43 –38.57 n/a (1)<br />
31 E Portugal 2.36 20.85 15.7 (2)<br />
32 A Iran 2.14 17.00 7.3 (9)<br />
33 SA Chile 1.81 –20.95 n/a (1)<br />
34 E Romania 1.68 18.47 4.5 (2)<br />
35 AF Egypt 1.37 159.00 n/a (1)<br />
36 E Hungary 1.30 13.50 n/a (1)<br />
37 AF Nigeria 1.20 27.39 n/a (1)<br />
38 E Lithuania 1.17 51.42 18.2 (2)<br />
39 A Malaysia 1.15 –15.61 n/a (1)<br />
40 E Slovenia 1.12 44.61 19.6 (2)<br />
41 AF Morocco 1.04 5.80 n/a (2)<br />
42 E Estonia 1.02 7.61 24.7 (2)<br />
43 E Bulgaria 0.87 20.41 9.3 (2)<br />
44 E Latvia 0.76 28.78 14.8 (2)<br />
45 SA Argentina 0.73 27.00 n/a (4)<br />
46 ANT New Zealand 0.37 0.01 n/a (8)<br />
47 E Serbia-Montenegro 0.34 7.86 n/a (2)<br />
48 A Uzbekistan 0.23 3.00 2.3 (1)<br />
49 A India 0.19 2.65 n/a (9)<br />
50 E Greece 0.17 –2.80 1.1 (2)<br />
TOTAL 1,005.30<br />
Market penetration rates quoted by Leaseurope appear as those reported and defined in the Leaseurope’s 2015 Annual Survey.<br />
Key to Sources: (1) National <strong>Leasing</strong> Association (4) Alta Group (7) Central bank data<br />
(2) Leaseurope (5) Other trade associations (8) Author’s estimate<br />
(3) Asian <strong>Leasing</strong> Association (6) Government statistics (9) Others’ data<br />
White Clarke Group <strong>Global</strong> <strong>Leasing</strong> <strong>Report</strong> is prepared by White Clarke Group, Milton Keynes, UK, in association with the World <strong>Leasing</strong> Yearbook.<br />
No information may be reproduced without the prior permission of White Clarke Group and the publishers of the World <strong>Leasing</strong> Yearbook.
WHITE CLARKE GROUP GLOBAL LEASING REPORT<br />
<strong>Leasing</strong> penetration<br />
The sources<br />
For countries where reliable data has been made available,<br />
Table 2 includes a measure of leasing penetration for<br />
the year 2015. We provide two measurements for leasing<br />
penetration. One shows the percentage of investment in<br />
a given country financed by leasing and hire purchase.<br />
It is calculated as total new business volume divided by<br />
total investment, excluding real estate. For 11 of the largest<br />
countries, a back run of these figures for 20 years is given<br />
in Table 4.<br />
The second method of expressing penetration, introduced<br />
into the <strong>Global</strong> <strong>Leasing</strong> <strong>Report</strong> in 1999, is in relation to gross<br />
domestic product (GDP), i.e. national output as a whole.<br />
Table 5 gives figures and rankings for each country in the<br />
White Clarke Group/GDP ratio for 2015.<br />
Of the two measures, the first (investment penetration) is a<br />
better indication of how leasing compares in competition<br />
with alternative forms of financing. However, calculation of<br />
the investment penetration ratio depends on identifying the<br />
correct statistic for plant investment, against which leasing<br />
should be compared.<br />
The White Clarke Group/GDP ratio is a more reliable indicator<br />
in that it is based on a broader denominator. Furthermore,<br />
information for all countries is more readily available.<br />
In measuring leasing by reference to economic activity<br />
as a whole, this ratio highlights which countries have<br />
relatively mature leasing industries, or, in some cases,<br />
where leasing is being promoted strategically as a source<br />
of investment funding.<br />
The White Clarke Group <strong>Global</strong> <strong>Leasing</strong> <strong>Report</strong> is<br />
assembled from a number of disparate sources, the<br />
most important primary sources being the national<br />
associations that represent leasing companies in<br />
most individual countries.<br />
The chief role of the national associations is to act as<br />
lobbying groups, with the aim of influencing the regulatory<br />
environment. These bodies almost all make efforts to extend<br />
their membership bases as widely as possible within the<br />
local leasing industry, and to measure and publicise local<br />
leasing business activity.<br />
In several regions, including Europe, Asia and Latin America,<br />
continental leasing federations add substantial value to<br />
the process of recording activity at national as well as<br />
continental levels.<br />
In Europe, the Leaseurope federation endeavours to<br />
standardise the measurement of equipment leasing business<br />
for each European country, on a basis that broadly matches<br />
the <strong>Global</strong> <strong>Leasing</strong> <strong>Report</strong>’s concept of the scope of leasing.<br />
We are particularly grateful to Leaseurope for the quality and<br />
depth of their data.<br />
Readers will note some differences between figures<br />
quoted for European countries by the two organisations.<br />
This is because Leaseurope publishes its data in euros,<br />
using average exchange rates over the year for non-Euro<br />
countries, while the <strong>Global</strong> <strong>Leasing</strong> <strong>Report</strong> is published<br />
in US dollars, employing the last published exchange<br />
rates for the year.<br />
10<br />
© WORLD LEASING YEARBOOK
WHITE CLARKE GROUP GLOBAL LEASING REPORT<br />
Identifying the top 50<br />
National associations also remain important sources<br />
of information in Europe, with many of them providing<br />
significant information and narrative beyond that<br />
required by Leaseurope.<br />
We are grateful to the Alta Group for their assistance<br />
in preparing much of the Latin American data.<br />
Other important sources of information for some<br />
countries include official statistics from central banks<br />
or finance ministries; and in some cases trade bodies,<br />
which have a wider remit than the leasing industry but<br />
who can make a clear differentiation between leasing<br />
and other financial products.<br />
In some of the less developed countries, International<br />
Finance Corporation (IFC), the private sector arm of the<br />
World Bank, has been active in promoting leasing activity.<br />
IFC is in a position to provide market volume estimates for<br />
several developing countries, and has been a very helpful<br />
source of information for the <strong>Global</strong> <strong>Leasing</strong> <strong>Report</strong> for<br />
many years.<br />
The global and continental aggregates are compiled<br />
from the top 50 countries only, and estimates are not<br />
made for countries outside that group. It is estimated<br />
that all the excluded countries together would have<br />
accounted for less than US$10bn of measurable<br />
leasing business in 2015.<br />
For the purposes of identifying regional or continental<br />
groups, Turkey is taken as the eastern extremity of<br />
Europe. Africa is divided from Asia at the Suez Canal,<br />
with Egypt in Africa. The Americas are divided at the<br />
Panama Canal, with Panama itself in North America.<br />
Australia and New Zealand together are treated as<br />
a separate region.<br />
Cross-border leasing is included within the national total<br />
for the home state of the lessor, rather than that of the<br />
lessee. Strictly speaking, the national totals represent<br />
leasing industries rather than leasing markets.<br />
For a few countries, where it is clear that locally-based<br />
sources have provided data representing only part of<br />
total leasing activity, or where reasonably comprehensive<br />
information for earlier years had not been available, White<br />
Clarke Group has had to make an author’s estimate of the<br />
national leasing total.<br />
The various sources of information for each country are<br />
identified in the footnotes to Table 2.<br />
11<br />
© WORLD LEASING YEARBOOK
WHITE CLARKE GROUP GLOBAL LEASING REPORT<br />
Table 3: <strong>Leasing</strong> volume by region 1999–2015 (US$bn)<br />
1999 2000 2001 2002 2003 2004 2005 2006 2007 2008 2009 2010 2011 2012 2013 2014 2015<br />
Europe 133.6 131.0 140.0 164.1 196.1 236.5 239.6 272.0 401.2 336.7 220.4 233.0 302.7 314.0 333.6 327.8 322.8<br />
N America 239.1 272.4 254.1 216.0 223.9 240.7 236.7 241.1 237.9 226.1 190.8 213.3 292.5 336.4 335.1 368.4 407.8<br />
Asia 80.4 78.3 67.7 68.7 74.1 78.2 74.0 81.7 84.6 99.2 103.8 105.6 153.4 180.2 177.3 195.0 223.0<br />
S America 8.3 8.1 5.6 3.3 4.0 7.5 13.9 19.2 41.4 54.2 30.2 25.4 27.5 13.2 18.0 10.7 13.8<br />
Australia/NZ 7.9 5.3 5.5 5.8 7.6 8.1 8.2 8.6 4.1 6.9 5.7 10.8 12.0 16.1 12.5 35.6 31.2<br />
Africa 4.3 3.9 3.8 3.7 5.6 8.1 9.6 11.1 11.2 9.6 6.5 6.4 8.6 8.2 7.5 6.8 6.7<br />
Annual totals 473.5 499.0 476.7 461.6 511.3 579.1 582.0 633.7 780.4 732.8 557.3 594.5 796.7 868.0 884.0 944.3 1,005.3<br />
Sources: London Financial Group, White Clarke Group <strong>Global</strong> <strong>Leasing</strong> <strong>Report</strong>.<br />
Table 4: A comparison of the rate of equipment leasing<br />
market penetration (%)<br />
1997 1998 1999 2000 2001 2002 2003 2004 2005 2006 2007 2008 2009 2010 2011 2012 2013 2014 2015<br />
US 30.9 30.9 30.0 31.7 31.0 31.1 31.1 29.9 26.9 27.7 26.0 16.4 17.1 17.1 21.0 22.0 22.0 22.0 22.0<br />
Japan 8.9 9.2 9.5 9.1 9.2 9.3 8.7 8.7 9.3 9.3 7.8 7.2 7.0 6.3 6.8 7.2 9.8 8.9 9.6<br />
Germany 13.6 14.7 15.1 14.8 13.5 9.8 21.7 15.7 18.6 23.6 15.5 16.2 13.9 14.3 14.7 5.8 16.6 16.4 16.7<br />
Korea 28.3 13.1 2.8 2.4 1.6 3.9 4.4 5.6 7.7 9.4 n/a 10.5 4.4 4.8 8.7 8.5 8.1 9.8 9.4<br />
UK 19.2 15.0 15.9 13.8 14.4 15.3 14.2 9.4 14.5 12.7 11.6 20.6 17.6 18.5 19.8 23.8 31.0 28.6 31.1<br />
France 12.4 17.0 15.7 9.2 13.7 12.9 15.4 9.0 11.7 11.0 12.0 12.2 3.1 10.5 11.1 12.8 12.5 13.1 14.2<br />
Italy 10.9 12.3 12.4 12.3 10.4 8.6 7.6 11.4 15.1 15.2 11.4 16.9 10.0 13.1 12.3 10.0 9.4 11.7 13.0<br />
Brazil 20.7 20.7 12.5 11.4 7.6 3.6 3.8 7.7 13.5 16.9 19.0 23.8 n/a n/a n/a n/a n/a n/a n/a<br />
Canada 15.7 22.0 22.0 22.5 22.0 20.2 22.0 23.3 23.9 22.0 22.0 19.6 14.0 15.1 20.8 20.8 32.0 31.0 32.0<br />
Australia 25.0 25.0 25.4 20.0 20.0 20.0 20.0 20.0 20.0 18.0 14.2 10.0 10.0 12.0 27.5 27.5 40.0 40.0 40.0<br />
Sweden 28.0 20.0 17.5 12.9 9.2 13.0 11.6 12.7 11.8 11.8 14.3 19.4 17.5 19.2 18.2 24.6 24.4 22.7 22.9<br />
Sources:<br />
(1) Australian Equipment Lessors Association (total leasing as a percentage<br />
of private capital investment).<br />
(2) US Dept. of Commerce, Economics & Statistics Administration, Bureau<br />
of Economic Analysis and Equipment <strong>Leasing</strong> Association of America<br />
(equipment leasing as a percentage of business investment in equipment).<br />
(3) Japan Economic Planning Agency and Japan <strong>Leasing</strong> Association<br />
(equipment leasing as a percentage of private capital investment).<br />
(4) Leaseurope Annual <strong>Report</strong>s.<br />
(5) Statistics Canada and Equipment Lessors Association of Canada<br />
(lessor purchases as a percentage of total equipment acquisitions in Canada).<br />
(6) Korea <strong>Leasing</strong> Association.<br />
(7) Brazilian Association of <strong>Leasing</strong> Companies.<br />
(8) London Financial Group.<br />
(9) White Clarke Group <strong>Global</strong> <strong>Leasing</strong> <strong>Report</strong>.<br />
12<br />
© WORLD LEASING YEARBOOK
WHITE CLARKE GROUP GLOBAL LEASING REPORT<br />
Deriving the figures<br />
The statistics measure new business value for each<br />
year, i.e. the value of equipment newly assigned on<br />
lease to customers during the year. Strictly speaking,<br />
that does not necessarily denote new equipment: it<br />
could include second-hand equipment, and sale-andleaseback<br />
transactions for equipment already in use<br />
by the seller/lessee.<br />
The widespread adoption of hire purchase as a<br />
financial instrument for equipment finance (in some<br />
countries, hire purchase has become the major source<br />
of revenue for leasing companies) prompted a change<br />
in our industry reporting since 2011. Since then, all<br />
reference to leasing and the leasing sector includes<br />
equipment hire purchase.<br />
Real estate leasing is consistently excluded from<br />
the <strong>Report</strong>. In some countries the national leasing<br />
associations (or other information sources) are<br />
concerned with the leasing of land and buildings as well<br />
as that of equipment. Nevertheless, in most of those<br />
cases the primary data sources make a sufficiently clear<br />
distinction between the two in their own statistics.<br />
Likewise, consumer credit financing is excluded.<br />
In principle, the dividing line between leasing and<br />
consumer finance is a simple functional one, i.e. whether<br />
the equipment is largely for business use, or primarily<br />
for the customer’s private non-professional use as an<br />
individual or householder.<br />
This still leaves some problem areas as to what types of<br />
commercial equipment financing transaction should be<br />
counted as leasing. In many countries the line between<br />
leases and other forms of finance is reasonably clear.<br />
There is no obvious solution as to where to draw the line<br />
on a consistent basis for all countries. In such problem<br />
areas the approach adopted by the White Clarke Group<br />
<strong>Global</strong> <strong>Leasing</strong> <strong>Report</strong> (within the overriding parameters,<br />
such as excluding both real estate and consumer<br />
transactions) is to follow the local definition of leasing.<br />
The <strong>Global</strong> <strong>Leasing</strong> <strong>Report</strong> employs US dollar as the<br />
common currency baseline for country comparisons,<br />
using exchange rates prevailing at the end of the year.<br />
In other cases, some estimating is necessary within the<br />
<strong>Global</strong> <strong>Leasing</strong> <strong>Report</strong> in order to strip out a portion of<br />
the reported total leasing activity believed to represent<br />
real estate leasing.<br />
13<br />
© WORLD LEASING YEARBOOK
WHITE CLARKE GROUP GLOBAL LEASING REPORT<br />
Table 5: White Clarke Group/GDP penetration ratio<br />
Annual leasing volume as a percentage of gross domestic product<br />
Ranking Country 2015 Ratio<br />
1 Estonia 4.31<br />
2 Sweden 3.03<br />
3 UK 3.02<br />
4 Latvia 2.68<br />
5 Lithuania 2.64<br />
6 Denmark 2.50<br />
7 Switzerland 2.40<br />
8 Slovak Republic 2.19<br />
9 Australia 2.08<br />
10 US 2.08<br />
11 Poland 2.08<br />
12 Slovenia 1.90<br />
13 Finland 1.90<br />
14 Germany 1.71<br />
15 Taiwan 1.67<br />
16 Colombia 1.57<br />
17 Austria 1.47<br />
18 Bulgaria 1.44<br />
19 Canada 1.39<br />
20 China 1.37<br />
21 Czech Republic 1.33<br />
22 Norway 1.28<br />
23 Peru 1.26<br />
24 France 1.05<br />
25 Portugal 0.98<br />
26 Belgium 0.94<br />
27 Japan 0.93<br />
28 Korea 0.83<br />
29 Morocco 0.83<br />
30 Hungary 0.80<br />
31 Italy 0.77<br />
32 Turkey 0.74<br />
33 Netherlands 0.70<br />
34 South Africa 0.68<br />
35 Romania 0.63<br />
36 Chile 0.62<br />
37 Serbia 0.55<br />
38 Mexico 0.53<br />
39 Spain 0.50<br />
40 Iran 0.49<br />
41 Uzbekistan 0.41<br />
42 Egypt 0.40<br />
43 Nigeria 0.37<br />
44 Malaysia 0.36<br />
45 Russia 0.35<br />
46 New Zealand 0.22<br />
47 Argentina 0.18<br />
48 Brazil 0.09<br />
49 Greece 0.05<br />
50 India 0.01<br />
Ranking Country 2014 Ratio<br />
1 Estonia 4.81<br />
2 Sweden 3.30<br />
3 UK 2.84<br />
4 Latvia 2.47<br />
5 Australia 2.47<br />
6 Denmark 2.36<br />
7 Switzerland 2.30<br />
8 Slovakia 2.24<br />
9 Finland 2.14<br />
10 Poland 2.11<br />
11 Lithuania 2.07<br />
12 US 1.95<br />
13 Germany 1.87<br />
14 Slovenia 1.73<br />
15 Canada 1.69<br />
16 Austria 1.63<br />
17 Norway 1.63<br />
18 Taiwan 1.63<br />
19 Czech Republic 1.36<br />
20 Bulgaria 1.31<br />
21 China (People’s Republic) 1.29<br />
22 France 1.12<br />
23 Colombia 1.09<br />
24 South Africa 1.07<br />
25 Belgium 0.99<br />
26 Portugal 0.95<br />
27 Hungary 0.93<br />
28 Morocco 0.91<br />
29 Japan 0.89<br />
30 Turkey 0.88<br />
31 Korea 0.87<br />
32 Chile 0.83<br />
33 Italy 0.80<br />
34 Russia 0.72<br />
35 Netherlands 0.67<br />
36 Romania 0.67<br />
37 Serbia-Montenegro 0.60<br />
38 Malaysia 0.57<br />
39 Uzbekistan 0.55<br />
40 Spain 0.49<br />
41 Iran 0.42<br />
42 Ukraine 0.25<br />
43 New Zealand 0.23<br />
44 Egypt 0.19<br />
45 Nigeria 0.17<br />
46 Brazil 0.15<br />
47 Peru 0.11<br />
48 Greece 0.06<br />
49 Argentina 0.06<br />
50 Mexico 0.04<br />
Ranking Country 2013 Ratio<br />
1 Estonia 5.91<br />
2 Sweden 3.82<br />
3 Latvia 3.36<br />
4 UK 2.67<br />
5 Lithuania 2.65<br />
6 Denmark 2.50<br />
7 Slovakia 2.48<br />
8 Finland 2.31<br />
9 Switzerland 2.19<br />
10 Slovenia 2.09<br />
11 Poland 2.03<br />
12 Germany 2.01<br />
13 US 1.92<br />
14 Austria 1.74<br />
15 Norway 1.73<br />
16 Colombia 1.62<br />
17 Taiwan 1.60<br />
18 Czech Republic 1.55<br />
19 Bulgaria 1.51<br />
20 Morocco 1.29<br />
21 France 1.25<br />
22 South Africa 1.23<br />
23 Russia 1.22<br />
24 Peru 1.21<br />
25 Belgium 1.13<br />
26 China (People’s Republic) 1.11<br />
27 Japan 1.11<br />
28 Hungary 1.09<br />
29 Chile 0.96<br />
30 Australia 0.88<br />
31 Italy 0.87<br />
32 Portugal 0.83<br />
33 Argentina 0.80<br />
34 Korea 0.79<br />
35 Romania 0.78<br />
36 Netherlands 0.75<br />
37 Serbia-Montenegro 0.72<br />
38 Canada 0.71<br />
39 Malaysia 0.69<br />
40 Uzbekistan 0.63<br />
41 Turkey 0.63<br />
42 Puerto Rico 0.58<br />
43 Ukraine 0.50<br />
44 Mexico 0.40<br />
45 Spain 0.39<br />
46 Nigeria 0.24<br />
47 Iran 0.24<br />
48 New Zealand 0.23<br />
49 Brazil 0.16<br />
50 Egypt 0.15<br />
Sources: London Financial Group, White Clarke Group<br />
14<br />
© WORLD LEASING YEARBOOK
WHITE CLARKE GROUP GLOBAL LEASING REPORT<br />
The outlook for 2016<br />
As a conclusion to the <strong>Report</strong> we always try to anticipate<br />
what the following years may bring for the global leasing<br />
industry. The year 2016 has brought some significant<br />
economic and political events, namely Brexit and the<br />
election of Donald Trump to the US Presidency. Both<br />
events have brought short-term turbulence upon the<br />
global FX and stock markets. It is too early to assess how<br />
these events may impact upon the economies of the world<br />
and the global leasing industry in the medium term but<br />
there may be some resulting economic instability in <strong>2017</strong>.<br />
What we can say with some authority is that the leasing<br />
market in 2015 gained a greater share of the equipment<br />
finance industry and reported growth in most of the regions<br />
when expressed in their own currencies. This allows us an<br />
optimistic outlook for coming years, and the last paragraphs<br />
of this <strong>Report</strong> are intended to anticipate what is expected<br />
from 2016. At the time of writing this <strong>Report</strong> (November<br />
2016) only information from three quarters of 2016 are<br />
available and therefore, further adjustments might need to<br />
be taken into consideration when reviewing this section.<br />
Four countries (US, China, UK and Germany) account<br />
for more than 65% of total world volume, and their<br />
perspective gives us enough indication of what the<br />
future might hold.<br />
US<br />
Despite low financing costs and a strong dollar, the<br />
Equipment <strong>Leasing</strong> & Finance Foundation (ELFF) forecasts<br />
modest growth for 2016, of around 1%. This forecast was<br />
made before the Trump Presidency results. Nonetheless,<br />
it is expected that the total US equipment finance market<br />
is going to be slightly greater than US$1 trillion in 2016.<br />
China<br />
The rapid growth of the Chinese leasing industry in<br />
recent years is anticipated to continue and, despite the<br />
cut in interest rates by the central bank aiming to draw<br />
attention to banking loans instead, numerous leasing<br />
opportunities remain available. The diversification of<br />
funding sources in China is expected to bring advantages<br />
to the leasing market and increase demand.<br />
The issue by the Chinese State Council in 2015 of several<br />
policies to support leasing is expected to increase new<br />
business volume and encourage the use of leasing as an<br />
asset finance mechanism in the future. Some companies<br />
have already seen the effects and the number of lessors<br />
in the Chinese market has now reached more than 3,500<br />
with a penetration of 4%, expecting solid growth in 2016.<br />
Germany<br />
It is expected that the growth in private consumption and<br />
the modest economic recovery of the eurozone is going<br />
to increase GDP by 1.5% in real terms and the investment<br />
in equipment by 3% in nominal terms in Germany. The<br />
Association of German <strong>Leasing</strong> Companies states that<br />
it is anticipates that new business volume will continue<br />
to rise in 2016.<br />
UK<br />
The UK leasing industry has reported strong<br />
performance during the first three quarters of 2016 and<br />
new business volume is expected to increase around<br />
8% during those nine months. The Finance & <strong>Leasing</strong><br />
Association expects that the publication of the new<br />
accounting standard IFRS 16 should not affect the market<br />
in 2016. The implications of Brexit on the domestic<br />
financing market for <strong>2017</strong> and onwards are unknown.<br />
We can anticipate that the industry in 2016 may<br />
experience some regulatory challenges but overall<br />
steady growth and bright prospects are anticipated.<br />
his article was written by Brendan Gleeson, Group CEO<br />
of White Clarke Group, a global financial services business<br />
technology company, with offices in North America, Europe<br />
and Asia Pacific. Brendan joined White Clarke Group in 2001<br />
and, under his leadership, the group has grown to become<br />
a global force in the auto finance and asset finance industry.<br />
With over 25 years’ experience in the financial services<br />
sector, including a number of board level appointments,<br />
his special expertise is creating and delivering strategic<br />
change initiatives. Before joining the company he was IT<br />
Director at Bank of Ireland Asset & Motor Finance. Brendan<br />
holds a first in Computer Science from Trinity College,<br />
in addition to his MBA from Cranfield.<br />
info@whiteclarkegroup.com<br />
whiteclarkegroup.com<br />
15<br />
© WORLD LEASING YEARBOOK
Thanks for reading<br />
If you enjoyed this publication you<br />
should head over to our website<br />
where we regularly deliver valuable<br />
industry insights free of charge.<br />
whiteclarkegroup.com