WCG-Global-Leasing-Report-2017

You also want an ePaper? Increase the reach of your titles
YUMPU automatically turns print PDFs into web optimized ePapers that Google loves.
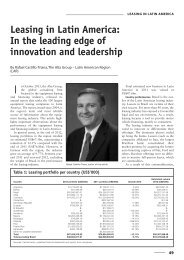
WHITE CLARKE GROUP GLOBAL LEASING REPORT<br />
<strong>Leasing</strong> penetration<br />
The sources<br />
For countries where reliable data has been made available,<br />
Table 2 includes a measure of leasing penetration for<br />
the year 2015. We provide two measurements for leasing<br />
penetration. One shows the percentage of investment in<br />
a given country financed by leasing and hire purchase.<br />
It is calculated as total new business volume divided by<br />
total investment, excluding real estate. For 11 of the largest<br />
countries, a back run of these figures for 20 years is given<br />
in Table 4.<br />
The second method of expressing penetration, introduced<br />
into the <strong>Global</strong> <strong>Leasing</strong> <strong>Report</strong> in 1999, is in relation to gross<br />
domestic product (GDP), i.e. national output as a whole.<br />
Table 5 gives figures and rankings for each country in the<br />
White Clarke Group/GDP ratio for 2015.<br />
Of the two measures, the first (investment penetration) is a<br />
better indication of how leasing compares in competition<br />
with alternative forms of financing. However, calculation of<br />
the investment penetration ratio depends on identifying the<br />
correct statistic for plant investment, against which leasing<br />
should be compared.<br />
The White Clarke Group/GDP ratio is a more reliable indicator<br />
in that it is based on a broader denominator. Furthermore,<br />
information for all countries is more readily available.<br />
In measuring leasing by reference to economic activity<br />
as a whole, this ratio highlights which countries have<br />
relatively mature leasing industries, or, in some cases,<br />
where leasing is being promoted strategically as a source<br />
of investment funding.<br />
The White Clarke Group <strong>Global</strong> <strong>Leasing</strong> <strong>Report</strong> is<br />
assembled from a number of disparate sources, the<br />
most important primary sources being the national<br />
associations that represent leasing companies in<br />
most individual countries.<br />
The chief role of the national associations is to act as<br />
lobbying groups, with the aim of influencing the regulatory<br />
environment. These bodies almost all make efforts to extend<br />
their membership bases as widely as possible within the<br />
local leasing industry, and to measure and publicise local<br />
leasing business activity.<br />
In several regions, including Europe, Asia and Latin America,<br />
continental leasing federations add substantial value to<br />
the process of recording activity at national as well as<br />
continental levels.<br />
In Europe, the Leaseurope federation endeavours to<br />
standardise the measurement of equipment leasing business<br />
for each European country, on a basis that broadly matches<br />
the <strong>Global</strong> <strong>Leasing</strong> <strong>Report</strong>’s concept of the scope of leasing.<br />
We are particularly grateful to Leaseurope for the quality and<br />
depth of their data.<br />
Readers will note some differences between figures<br />
quoted for European countries by the two organisations.<br />
This is because Leaseurope publishes its data in euros,<br />
using average exchange rates over the year for non-Euro<br />
countries, while the <strong>Global</strong> <strong>Leasing</strong> <strong>Report</strong> is published<br />
in US dollars, employing the last published exchange<br />
rates for the year.<br />
10<br />
© WORLD LEASING YEARBOOK