WCG-Global-Leasing-Report-2017

Create successful ePaper yourself
Turn your PDF publications into a flip-book with our unique Google optimized e-Paper software.
WHITE CLARKE GROUP GLOBAL LEASING REPORT<br />
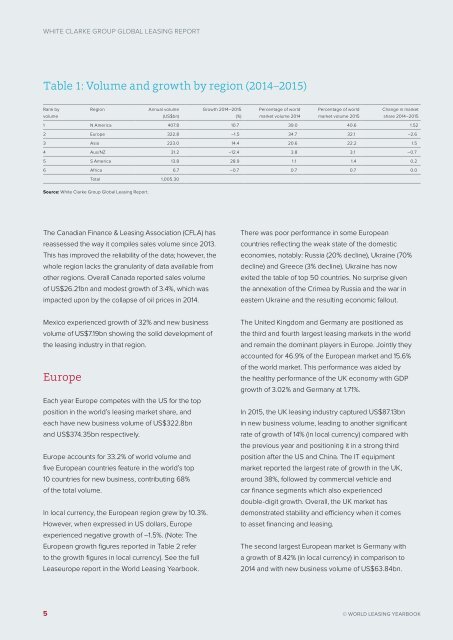
Table 1: Volume and growth by region (2014–2015)<br />
Rank by<br />
volume<br />
Region<br />
Annual volume<br />
(US$bn)<br />
Growth 2014–2015<br />
(%)<br />
Percentage of world<br />
market volume 2014<br />
Percentage of world<br />
market volume 2015<br />
Change in market<br />
share 2014–2015<br />
1 N America 407.8 10.7 39.0 40.6 1.52<br />
2 Europe 322.8 –1.5 34.7 32.1 –2.6<br />
3 Asia 223.0 14.4 20.6 22.2 1.5<br />
4 Aus/NZ 31.2 –12.4 3.8 3.1 –0.7<br />
5 S America 13.8 28.9 1.1 1.4 0.2<br />
6 Africa 6.7 –0.7 0.7 0.7 0.0<br />
Total 1,005.30<br />
Source: White Clarke Group <strong>Global</strong> <strong>Leasing</strong> <strong>Report</strong>.<br />
The Canadian Finance & <strong>Leasing</strong> Association (CFLA) has<br />
reassessed the way it compiles sales volume since 2013.<br />
This has improved the reliability of the data; however, the<br />
whole region lacks the granularity of data available from<br />
other regions. Overall Canada reported sales volume<br />
of US$26.21bn and modest growth of 3.4%, which was<br />
impacted upon by the collapse of oil prices in 2014.<br />
There was poor performance in some European<br />
countries reflecting the weak state of the domestic<br />
economies, notably: Russia (20% decline), Ukraine (70%<br />
decline) and Greece (3% decline). Ukraine has now<br />
exited the table of top 50 countries. No surprise given<br />
the annexation of the Crimea by Russia and the war in<br />
eastern Ukraine and the resulting economic fallout.<br />
Mexico experienced growth of 32% and new business<br />
volume of US$7.19bn showing the solid development of<br />
the leasing industry in that region.<br />
Europe<br />
Each year Europe competes with the US for the top<br />
position in the world’s leasing market share, and<br />
each have new business volume of US$322.8bn<br />
and US$374.35bn respectively.<br />
Europe accounts for 33.2% of world volume and<br />
five European countries feature in the world’s top<br />
10 countries for new business, contributing 68%<br />
of the total volume.<br />
In local currency, the European region grew by 10.3%.<br />
However, when expressed in US dollars, Europe<br />
experienced negative growth of –1.5%. (Note: The<br />
European growth figures reported in Table 2 refer<br />
to the growth figures in local currency). See the full<br />
Leaseurope report in the World <strong>Leasing</strong> Yearbook.<br />
The United Kingdom and Germany are positioned as<br />
the third and fourth largest leasing markets in the world<br />
and remain the dominant players in Europe. Jointly they<br />
accounted for 46.9% of the European market and 15.6%<br />
of the world market. This performance was aided by<br />
the healthy performance of the UK economy with GDP<br />
growth of 3.02% and Germany at 1.71%.<br />
In 2015, the UK leasing industry captured US$87.13bn<br />
in new business volume, leading to another significant<br />
rate of growth of 14% (in local currency) compared with<br />
the previous year and positioning it in a strong third<br />
position after the US and China. The IT equipment<br />
market reported the largest rate of growth in the UK,<br />
around 38%, followed by commercial vehicle and<br />
car finance segments which also experienced<br />
double-digit growth. Overall, the UK market has<br />
demonstrated stability and efficiency when it comes<br />
to asset financing and leasing.<br />
The second largest European market is Germany with<br />
a growth of 8.42% (in local currency) in comparison to<br />
2014 and with new business volume of US$63.84bn.<br />
5<br />
© WORLD LEASING YEARBOOK