WCG-Global-Leasing-Report-2017

Create successful ePaper yourself
Turn your PDF publications into a flip-book with our unique Google optimized e-Paper software.
WHITE CLARKE GROUP GLOBAL LEASING REPORT<br />
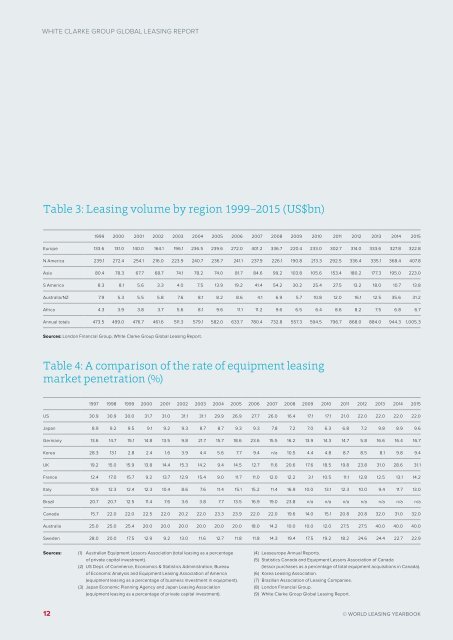
Table 3: <strong>Leasing</strong> volume by region 1999–2015 (US$bn)<br />
1999 2000 2001 2002 2003 2004 2005 2006 2007 2008 2009 2010 2011 2012 2013 2014 2015<br />
Europe 133.6 131.0 140.0 164.1 196.1 236.5 239.6 272.0 401.2 336.7 220.4 233.0 302.7 314.0 333.6 327.8 322.8<br />
N America 239.1 272.4 254.1 216.0 223.9 240.7 236.7 241.1 237.9 226.1 190.8 213.3 292.5 336.4 335.1 368.4 407.8<br />
Asia 80.4 78.3 67.7 68.7 74.1 78.2 74.0 81.7 84.6 99.2 103.8 105.6 153.4 180.2 177.3 195.0 223.0<br />
S America 8.3 8.1 5.6 3.3 4.0 7.5 13.9 19.2 41.4 54.2 30.2 25.4 27.5 13.2 18.0 10.7 13.8<br />
Australia/NZ 7.9 5.3 5.5 5.8 7.6 8.1 8.2 8.6 4.1 6.9 5.7 10.8 12.0 16.1 12.5 35.6 31.2<br />
Africa 4.3 3.9 3.8 3.7 5.6 8.1 9.6 11.1 11.2 9.6 6.5 6.4 8.6 8.2 7.5 6.8 6.7<br />
Annual totals 473.5 499.0 476.7 461.6 511.3 579.1 582.0 633.7 780.4 732.8 557.3 594.5 796.7 868.0 884.0 944.3 1,005.3<br />
Sources: London Financial Group, White Clarke Group <strong>Global</strong> <strong>Leasing</strong> <strong>Report</strong>.<br />
Table 4: A comparison of the rate of equipment leasing<br />
market penetration (%)<br />
1997 1998 1999 2000 2001 2002 2003 2004 2005 2006 2007 2008 2009 2010 2011 2012 2013 2014 2015<br />
US 30.9 30.9 30.0 31.7 31.0 31.1 31.1 29.9 26.9 27.7 26.0 16.4 17.1 17.1 21.0 22.0 22.0 22.0 22.0<br />
Japan 8.9 9.2 9.5 9.1 9.2 9.3 8.7 8.7 9.3 9.3 7.8 7.2 7.0 6.3 6.8 7.2 9.8 8.9 9.6<br />
Germany 13.6 14.7 15.1 14.8 13.5 9.8 21.7 15.7 18.6 23.6 15.5 16.2 13.9 14.3 14.7 5.8 16.6 16.4 16.7<br />
Korea 28.3 13.1 2.8 2.4 1.6 3.9 4.4 5.6 7.7 9.4 n/a 10.5 4.4 4.8 8.7 8.5 8.1 9.8 9.4<br />
UK 19.2 15.0 15.9 13.8 14.4 15.3 14.2 9.4 14.5 12.7 11.6 20.6 17.6 18.5 19.8 23.8 31.0 28.6 31.1<br />
France 12.4 17.0 15.7 9.2 13.7 12.9 15.4 9.0 11.7 11.0 12.0 12.2 3.1 10.5 11.1 12.8 12.5 13.1 14.2<br />
Italy 10.9 12.3 12.4 12.3 10.4 8.6 7.6 11.4 15.1 15.2 11.4 16.9 10.0 13.1 12.3 10.0 9.4 11.7 13.0<br />
Brazil 20.7 20.7 12.5 11.4 7.6 3.6 3.8 7.7 13.5 16.9 19.0 23.8 n/a n/a n/a n/a n/a n/a n/a<br />
Canada 15.7 22.0 22.0 22.5 22.0 20.2 22.0 23.3 23.9 22.0 22.0 19.6 14.0 15.1 20.8 20.8 32.0 31.0 32.0<br />
Australia 25.0 25.0 25.4 20.0 20.0 20.0 20.0 20.0 20.0 18.0 14.2 10.0 10.0 12.0 27.5 27.5 40.0 40.0 40.0<br />
Sweden 28.0 20.0 17.5 12.9 9.2 13.0 11.6 12.7 11.8 11.8 14.3 19.4 17.5 19.2 18.2 24.6 24.4 22.7 22.9<br />
Sources:<br />
(1) Australian Equipment Lessors Association (total leasing as a percentage<br />
of private capital investment).<br />
(2) US Dept. of Commerce, Economics & Statistics Administration, Bureau<br />
of Economic Analysis and Equipment <strong>Leasing</strong> Association of America<br />
(equipment leasing as a percentage of business investment in equipment).<br />
(3) Japan Economic Planning Agency and Japan <strong>Leasing</strong> Association<br />
(equipment leasing as a percentage of private capital investment).<br />
(4) Leaseurope Annual <strong>Report</strong>s.<br />
(5) Statistics Canada and Equipment Lessors Association of Canada<br />
(lessor purchases as a percentage of total equipment acquisitions in Canada).<br />
(6) Korea <strong>Leasing</strong> Association.<br />
(7) Brazilian Association of <strong>Leasing</strong> Companies.<br />
(8) London Financial Group.<br />
(9) White Clarke Group <strong>Global</strong> <strong>Leasing</strong> <strong>Report</strong>.<br />
12<br />
© WORLD LEASING YEARBOOK