Rogerio

You also want an ePaper? Increase the reach of your titles
YUMPU automatically turns print PDFs into web optimized ePapers that Google loves.
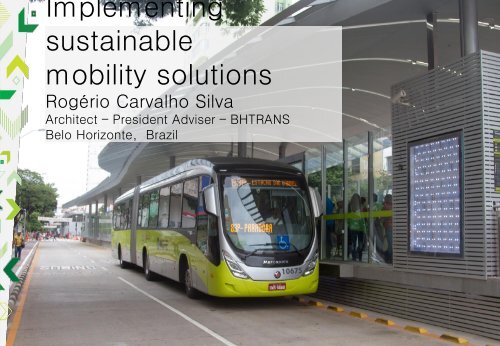
Implementing<br />
sustainable<br />
mobility solutions<br />
Rogério Carvalho Silva<br />
Architect – President Adviser – BHTRANS<br />
Belo Horizonte, Brazil
The City<br />
•Population of BH<br />
2.4 million inhabitants<br />
•Population of RMBH<br />
5.7 million inhabitants<br />
•6.3 million trips a day<br />
•2.5 trips / inhabitants / day
Transport System<br />
•Public transport by bus:<br />
293 lines, 3 thousand buses, 1.8<br />
million passangers/day<br />
•Metropolitan train:<br />
28 km, 19 stations, 200 thousand<br />
passangers/day<br />
•City car fleet:<br />
1.5 million cars – BH + 1 million -<br />
RMBH
City Strategic Planning<br />
Vision 2030<br />
Belo Horizonte: city of<br />
opportunities, sustainable and with<br />
quality of life<br />
Ensure mobility and accessibility in<br />
the urban environment through<br />
integrated networks, transport<br />
demand management and quality<br />
of public transport services
(2013)<br />
Inventory of greenhouse gases<br />
emissions in BH<br />
Distribution by Sectors (in<br />
%)<br />
The transportation<br />
sector is responsible<br />
for about 70% of the<br />
total CO 2 emissions<br />
Goal: to reduce the<br />
greenhouse gases<br />
emissions by 20%<br />
until 2030<br />
Fixed Units<br />
Urban Rejects<br />
Transport Sector
BH 2002/2012: increase in travels and<br />
larger participation of the individual<br />
modes*<br />
2002: 2,7 millions of tpd<br />
Buses<br />
2012: 4,1 millions of<br />
tpd<br />
Buses<br />
Cars<br />
Motorcycles<br />
Bicycles<br />
Others<br />
Cars<br />
Motorcycles<br />
Bicycles<br />
Others<br />
Mode Change<br />
2002/2012<br />
Buses - 8%<br />
Cars + 116%<br />
Motorcycl<br />
es<br />
+ 649%<br />
Bicycles + 7%<br />
Others + 154%<br />
Total + 53%<br />
* excluding walking trips<br />
• The public transport had a strong loss over a<br />
decade, falling from a 57.6 % share in 2002 to<br />
34.6% in 2012<br />
• The participation of cars rose from about 1/3<br />
to about 50%, being the most widely used<br />
modal in 2012
PlanMobBH – Starting Point<br />
Unsustainable Tendencies<br />
60<br />
Average travel time in minutes<br />
50<br />
40<br />
30<br />
20<br />
10<br />
0<br />
Coletivo Individual Nao motorizado Média geral<br />
Public<br />
Automobiles<br />
Non Motorized<br />
General Average
Fundamental Objectives of<br />
PlanMobBH<br />
Reduce the Number of Fatalities<br />
in Traffic<br />
Increase the percentage of trips<br />
by foot (emphasis on trips up to<br />
2km)<br />
Reduce the Increased Trend of<br />
Greenhouse Gases Emission<br />
Increase the percentage of<br />
bicycle trips (emphasis on trips<br />
up to 8km)<br />
Reduce the growth in the use of<br />
individual transportation (auto<br />
and motorcycle)<br />
Increase the current number of<br />
trips on public transport
The 4 pillars of the City Sustainable Urban<br />
Mobility Plan (PlanMobBH)<br />
Integration<br />
between Land<br />
Use Policy and<br />
Transportation<br />
Priority to<br />
public<br />
transport and<br />
its continuous<br />
improvement<br />
Stimulation of<br />
nonmotorized<br />
modes of<br />
transport<br />
Encouraging a<br />
more rational<br />
and innovative<br />
use of the car
Structuring initiatives for<br />
sustainable urban mobility in BH<br />
TOD Projects<br />
Urban Operation ACLO<br />
Regional Plans: New
Decrease in the number<br />
of bus trips in the morning<br />
peak hour<br />
0%<br />
-10%<br />
-20%<br />
-30%<br />
-40%<br />
-50%<br />
-60%<br />
-70%<br />
Structuring initiatives: MOVE, the<br />
BRT of Belo Horizonte<br />
23 km of exclusive lanes with two-way traffic, 5 integration stations at the<br />
edges and 40 transfer station along the corridor, transporting about 500,000<br />
Hospital<br />
region<br />
-54%<br />
Downtown<br />
Antonio<br />
Carlos Av.<br />
Cristiano<br />
Machado<br />
Av.<br />
-32% -27% -25%<br />
0%<br />
-10%<br />
-20%<br />
-30%<br />
-40%<br />
-50%<br />
-60%<br />
-70%<br />
Travel<br />
pass./day<br />
time reduction in<br />
the morning peak hour<br />
-53% -45% -25% -20%<br />
Number of passengers<br />
per business day<br />
550000<br />
500000<br />
450000<br />
400000<br />
350000<br />
300000<br />
250000<br />
200000<br />
4270<br />
00<br />
Projected<br />
4850<br />
00<br />
Actual
BRT – Bus Rapid<br />
Transit<br />
and Exclusive lanes<br />
for buses<br />
Present status (2017)<br />
• 23 km BRT;<br />
• 12 km exclusive bus<br />
lanes;<br />
• 7 integration stations and<br />
36 transference stations;<br />
Forecast (2030)<br />
• 150 km BRT;<br />
• 54 km exclusive bus<br />
lanes<br />
• 11 integration stations.
Electric Bus (2018) • Test of electric<br />
buses with a selfsufficiency<br />
higher<br />
than 250 km (each<br />
charge) – 80% of an<br />
average urban bus<br />
route;<br />
• Performance<br />
evaluation.<br />
• Operational costs
Stimulating nonmotorized<br />
modes<br />
Build a walking network<br />
integrated with the public<br />
transport and urban projects<br />
that brings improvements for<br />
pedestrians
30km/h Zones<br />
Proposal for Downtown<br />
Area • Reduction of car<br />
speed in order to<br />
guarantee the<br />
pedestrians and<br />
cyclists safety.<br />
• The red patterned<br />
areas indicate the<br />
selection of regions<br />
where the 30 zones<br />
will be
Pedala BH –<br />
Bike routes<br />
project<br />
Cycle infrastructure<br />
implementation<br />
plan:<br />
• (2020): 411 km<br />
• (2030): 1.000 km
Pedala BH – Bike routes<br />
project<br />
40 bycicle sharing stations in downtown Belo<br />
Horizonte and near touristic spots.
Rational Use of Automobiles<br />
Transportation demand management through coherence<br />
and integration of measures and modes of transport,<br />
resulting in a change of the predominant culture.<br />
Incentive to transport<br />
alternatives<br />
Discouraging the use<br />
of private transport<br />
Mitigation potential<br />
TOD<br />
Public<br />
Transportatio<br />
n<br />
Bicycle<br />
Walking<br />
Trip distance<br />
Speed limit<br />
reduction<br />
Management<br />
of parking<br />
areas<br />
Restriction of<br />
circulation<br />
areas<br />
Start<br />
Gradual<br />
intensification<br />
Triggers
Expected Results<br />
50%<br />
45%<br />
40%<br />
Modal Split (2012-<br />
2030)<br />
Traffic Jam Costs – R$<br />
23,30<br />
Billions<br />
35%<br />
30%<br />
25%<br />
20%<br />
15%<br />
10%<br />
5%<br />
0%<br />
2012 2014 2016 2018 2020 2022 2024 2026 2028 2030<br />
Public:<br />
planned<br />
Public: trend<br />
Coletivo - Planejado<br />
Não Motorizado - Planejado<br />
Individual - Tendencial<br />
Private:<br />
planned<br />
Private:<br />
trend<br />
Individual - Planejado<br />
Coletivo - Tendencial<br />
Não Motorizado - Tendencial<br />
Non-motorized:<br />
planned<br />
Non-motorized:<br />
trend<br />
14,20<br />
10,29<br />
11,12<br />
9,09<br />
6,94<br />
5,665,45<br />
3,35<br />
1,891,60<br />
0,29<br />
2020 De 2021 From a 2025 De 2026 From a 2030 Total de From 2020 a<br />
0 2021 to 2026 to 2020 2030to<br />
2025<br />
Trend<br />
2030<br />
Planned<br />
2030<br />
Net-gain
ov.br<br />
Thank<br />
You<br />
Rogério Carvalho<br />
Silva<br />
rogecarv@pbh.go<br />
v.br<br />
www.bhtrans.pbh.g<br />
ov.br
Municipal plan for greenhouse gases<br />
emissions reduction – PREGEE<br />
Emissions projection (millions tCO2e/year)
Evolution of some Mobility<br />
Indicators<br />
Unsustainable Tendencies<br />
250<br />
225<br />
200<br />
175<br />
150<br />
125<br />
100<br />
75<br />
Cars Fleet<br />
Frota de Veículos<br />
Demanda por Ônibus<br />
Bus Demand<br />
Population<br />
População<br />
Transit Accidents<br />
Acidentes de Trânsito<br />
50<br />
2001 2002 2003 2004 2005 2006 2007 2008 2009 2010 2011 2012 2013 2014
Structuring initiatives for<br />
sustainable urban mobility in BH<br />
MOVE: the BRT of<br />
BH<br />
23 km + 12<br />
kilometers of<br />
exclusive bus lanes<br />
Pedala BH:<br />
80km of bike lanes +<br />
40 shared bike<br />
stations<br />
30 km/h zones:<br />
attempt to keep road<br />
traffic speed down<br />
to a safe level<br />
Less street parking<br />
areas and more<br />
quality space for<br />
pedestrians