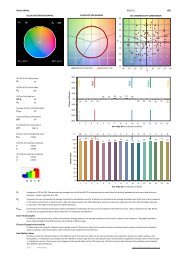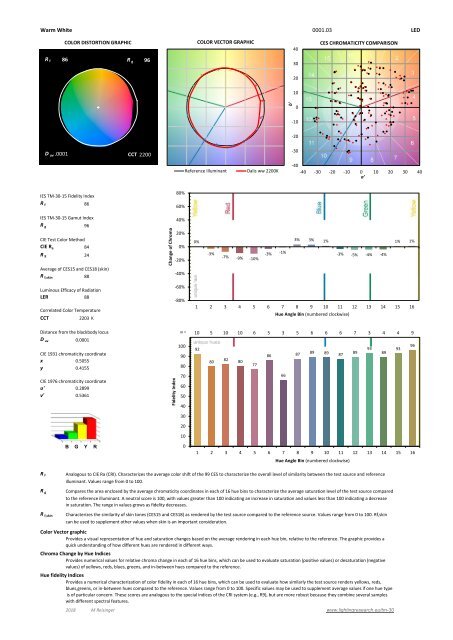
IES TM-30 LED WARM WHITE
Color vector graphics
Color vector graphics

Create successful ePaper yourself
Turn your PDF publications into a flip-book with our unique Google optimized e-Paper software.
Warm White 0001.03 <strong>LED</strong><br />
COLOR DISTORTION GRAPHIC<br />
COLOR VECTOR GRAPHIC<br />
40<br />
CES CHROMATICITY COMPARISON<br />
R f 86 R g 96<br />
<strong>30</strong><br />
20<br />
10<br />
b'<br />
0<br />
-10<br />
-20<br />
D uv .0001 CCT 2200<br />
-<strong>30</strong><br />
Reference Illuminant<br />
Dalis ww 2200K<br />
-40<br />
-40 -<strong>30</strong> -20 -10 0 10 20 <strong>30</strong> 40<br />
a'<br />
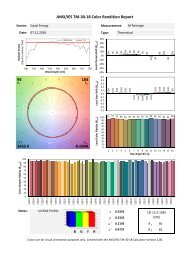
<strong>IES</strong> <strong>TM</strong>-<strong>30</strong>-15 Fidelity Index<br />
R f 86 R f 86<br />
80%<br />
60%<br />
<strong>IES</strong> <strong>TM</strong>-<strong>30</strong>-15 Gamut Index<br />
R g 96 R g 96<br />
40%<br />
CIE Test Color Method<br />
CIE R a 84<br />
R 9 24<br />
Average of CES15 and CES18 (skin)<br />
R f,skin 88<br />
Change of Chroma<br />
20%<br />
0%<br />
-20%<br />
-40%<br />
0%<br />
-3%<br />
-7% -9% -10%<br />
-3% -1%<br />
3% 3% 1%<br />
-3% -5% -4% -4%<br />
1% 1%<br />
Luminous Efficacy of Radiation<br />
LER 88<br />
Correlated Color Temperature<br />
CCT 2203 K 2200 CCT f<br />
-60%<br />
-80%<br />
1 2 3 4 5 6 7 8 9 10 11 12 13 14 15 16<br />
Hue Angle Bin (numbered clockwise)<br />
Distance from the blackbody locus<br />
D uv 0.0001 D uv .0001<br />
CIE 1931 chromaticity coordinate<br />
x 0.5055<br />
y 0.4155<br />
CIE 1976 chromaticity coordinate<br />
u' 0.2899<br />
v' 0.5361<br />
B G Y R<br />
Fidelity Index<br />
m =<br />
100<br />
90<br />
80<br />
70<br />
60<br />
50<br />
40<br />
<strong>30</strong><br />
20<br />
10<br />
0<br />
10 5 10 10 6 5 3 5 6 6 6 7 3 4 4 9<br />
92<br />
96<br />
93<br />
93<br />
86<br />
87<br />
89 89 87<br />
89<br />
89<br />
80<br />
82<br />
80<br />
77<br />
66<br />
1 2 3 4 5 6 7 8 9 10 11 12 13 14 15 16<br />
Hue Angle Bin (numbered clockwise)<br />
R f<br />
R g<br />
R f,skin<br />
Analogous to CIE Ra (CRI). Characterizes the average color shift of the 99 CES to characterize the overall level of similarity between the test source and reference<br />
illuminant. Values range from 0 to 100.<br />
Compares the area enclosed by the average chromaticity coordinates in each of 16 hue bins to characterize the average saturation level of the test source compared<br />
to the reference illuminant. A neutral score is 100, with values greater than 100 indicating an increase in saturation and values less than 100 indicating a decrease<br />
in saturation. The range in values grows as fidelity decreases.<br />
Characterizes the similarity of skin tones (CES15 and CES18) as rendered by the test source compared to the reference source. Values range from 0 to 100. Rf,skin<br />
can be used to supplement other values when skin is an important consideration.<br />
Color Vector graphic<br />
Provides a visual representation of hue and saturation changes based on the average rendering in each hue bin, relative to the reference. The graphic provides a<br />
quick understanding of how different hues are rendered in different ways.<br />
Chroma Change by Hue Indices<br />
Provides numerical values for relative chroma change in each of 16 hue bins, which can be used to evaluate saturation (positive values) or desaturation (negative<br />
values) of yellows, reds, blues, greens, and in-between hues compared to the reference.<br />
Hue fidelity Indices<br />
Provides a numerical characterization of color fidelity in each of 16 hue bins, which can be used to evaluate how similarly the test source renders yellows, reds,<br />
blues,greens, or in-between hues compared to the reference. Values range from 0 to 100. Specific values may be used to supplement average values if one hue type<br />
is of particular concern. These scores are analogous to the special indices of the CRI system (e.g., R9), but are more robust because they combine several samples<br />
with different spectral features.<br />
2018 M Reisinger www.lightingresearch.eu/tm-<strong>30</strong>