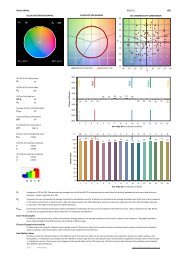
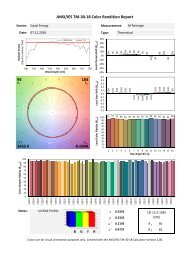
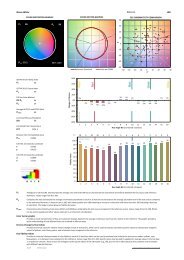
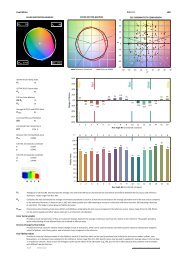
IES TM-30 LED Display Backlight BQ
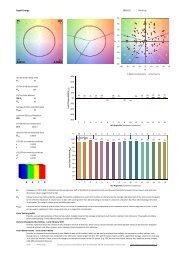
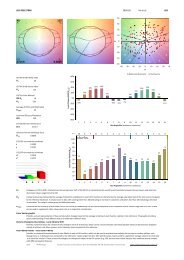
Color vector graphics
Color vector graphics

Create successful ePaper yourself
Turn your PDF publications into a flip-book with our unique Google optimized e-Paper software.
Local Chroma Shift (R cs,hj )
Local Color Fidelity (R fh,j )
b'
Display BQ 0014.01 TM-30-18 LED
80
R f
6
5
4
3
107
R g
40
30
7
2
20
8
1
10
0
9
16
-10
10 15
-20
CCT
7592 K
11
12 13
14 D uv
CCT
0.0010
-30
-40
-40 -30 -20 -10 0 10 20 30 40
a'
IES TM-30-18 Fidelity Index
R f 80 R f 80
80%
60%
Reference Illuminant
Test Source
IES TM-30-18 Gamut Index
R g 107 R g 107
CIE Test Color Method
CIE R a 80
R 9 29
40%
20%
0%
-20%
1% 1% 2%
7% 8%
19%
9% 8%
4%
-2%
-10% -10%
-2%
1%
8%
5%
Average of CES15 and CES18 (skin)
R f,skin 91
-40%
Luminous Efficacy of Radiation
LER 294
Correlated Color Temperature
CCT 7592 K 7590 CCT f
Distance from the blackbody locus
D uv 0.0010 D uv .0010
CIE 1931 chromaticity coordinate
x 0.2989
y 0.3107
CIE 1976 chromaticity coordinate
u' 0.1950
v' 0.4561
-60%
-80%
m =
100
90
80
70
60
50
1 2 3 4 5 6 7 8 9 10 11 12 13 14 15 16
Hue Angle Bin (numbered clockwise)
10 6 7 11 6 4 4 4 4 8 6 8 4 2 6 9
90
91 90
86
83
84
86
78
80
76 77 79
76
70
69
55
B G Y R
40
30
20
10
0
1 2 3 4 5 6 7 8 9 10 11 12 13 14 15 16
Hue Angle Bin (numbered clockwise)
R f
R g
R f,skin
Analogous to CIE Ra (CRI). Characterizes the average color shift of the 99 CES to characterize the overall level of similarity between the test source and reference
illuminant. Values range from 0 to 100.
Compares the area enclosed by the average chromaticity coordinates in each of 16 hue bins to characterize the average saturation level of the test source compared
to the reference illuminant. A neutral score is 100, with values greater than 100 indicating an increase in saturation and values less than 100 indicating a decrease
in saturation. The range in values grows as fidelity decreases.
Characterizes the similarity of skin tones (CES15 and CES18) as rendered by the test source compared to the reference source. Values range from 0 to 100. Rf,skin
can be used to supplement other values when skin is an important consideration.
Color Vector graphic
Provides a visual representation of hue and saturation changes based on the average rendering in each hue bin, relative to the reference. The graphic provides a
quick understanding of how different hues are rendered in different ways.
Chroma Change by Hue Indices - Local Chroma Shift
Provides numerical values for relative chroma change in each of 16 hue bins, which can be used to evaluate saturation (positive values) or desaturation (negative
values) of yellows, reds, blues, greens, and in-between hues compared to the reference.
Hue fidelity Indices - Local Color Fidelity
Provides a numerical characterization of color fidelity in each of 16 hue bins, which can be used to evaluate how similarly the test source renders yellows, reds,
blues,greens, or in-between hues compared to the reference. Values range from 0 to 100. Specific values may be used to supplement average values if one hue type
is of particular concern. These scores are analogous to the special indices of the CRI system (e.g., R9), but are more robust because they combine several samples
with different spectral features.
2022 M Reisinger Created on basis of calculations with the ANSI/IES TM-30-18 Calculator Version 2.00. www.lightingresearch.eu/tm-30