Trading Report February 2018
Report on trading activity at BSP Energy Exchange for February 2018
Report on trading activity at BSP Energy Exchange for February 2018
- No tags were found...

Create successful ePaper yourself
Turn your PDF publications into a flip-book with our unique Google optimized e-Paper software.
10 th Anniversary Monthly <strong>Report</strong> – <strong>February</strong> <strong>2018</strong><br />
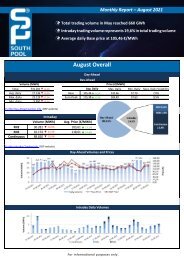
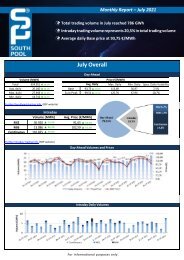
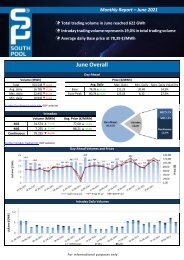
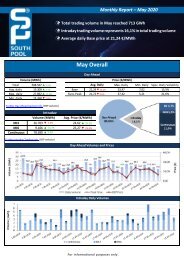
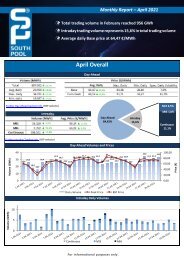
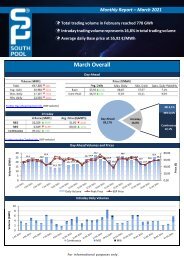
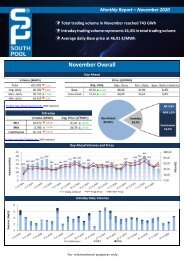
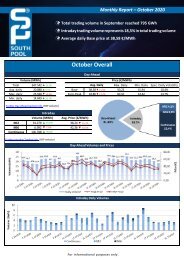
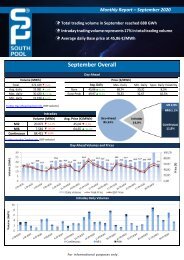
Average daily DA volume above 23.000 MWh in <strong>February</strong><br />
Intraday trading volume amounted nearly 21 GWh<br />
Base Price averaged at 43,30 €/MWh<br />
Volume (MWh)<br />
Further Day-Ahead Auction Info. (BSP website)<br />
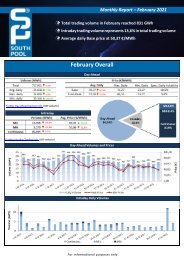
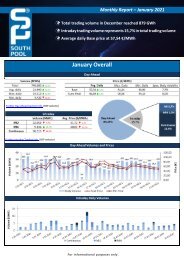
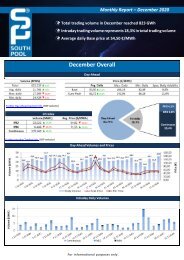
<strong>February</strong> Overall<br />
Day-Ahead<br />
Total 644.437 ▲ 3,8% Avg. Daily Max. Daily Min. Daily Spec. Daily Volatility<br />
Avg. daily 23.016 ▲ 14,9% Base 43,30▲14,2% 71,82 11,48 16,8%<br />
Max. daily 33.338 ▲ 4,3% Euro-Peak 49,53▲9,0% 88,37 13,41 19,3%<br />
Min. daily 17.890 ▲ 55,0%<br />
Intraday<br />
Volume (MWh)<br />
Avg. Price (€/MWh)<br />
MI2 9.339 ▼ 33,5% 40,36 ▲ 8,8%<br />
MI6 3.671 ▼ 26,5% 44,81 ▲ 13,5%<br />
Continuous 7.702 ▼ 58,7% /<br />
Price (€/MWh)<br />
Further Intraday <strong>Trading</strong> info. (BSP website)<br />
Day-Ahead Volumes and Prices<br />
Intraday Daily Volumes<br />
For informational purposes only.
Day-Ahead further Auction info.<br />
Average Hourly Volumes and Prices<br />
Hour (AM) 1 2 3 4 5 6 7 8 9 10 11 12<br />
Volume (MWh) 916 996 1051 1063 1029 960 941 974 983 955 953 916<br />
Base price (€/MWh) 33,03 32,47 31,39 30,52 30,83 32,87 39,63 47,68 50,64 51,16 49,77 51,42<br />
Hour (PM) 13 14 15 16 17 18 19 20 21 22 23 24<br />
Volume (MWh) 904 939 982 987 1005 946 947 949 924 896 902 898<br />
Base price (€/MWh) 49,10 45,47 44,23 Daily 44,27 volatility 45,96 of base 52,22 price 57,36 52,71 47,20 41,38 41,68 36,13<br />
SI→IT<br />
IT→SI<br />
Cross-Zonal Capacities<br />
SI→AT<br />
AT→SI<br />
Daily Volatility of Base Price<br />
Total<br />
Offered (MWh) 438.703 449.280 610.033 410.367 1.908.383<br />
Allocated (MWh) 424.044 0 69.266 129.768 623.078<br />
% Allocated 96,66% 0,00% 11,35% 31,62% /<br />
Methodology used for calculation of volatility.<br />
MI2 & MI6 Implicit Auctions<br />
Allocated CZC Values on Slovenian-Italian Border<br />
Cross-Zonal-Capacities<br />
SI-IT IT-SI Total<br />
Offered (MWh)<br />
Allocated (MWh)<br />
% Allocated<br />
14.658<br />
4.922<br />
33,58%<br />
378.747<br />
1.836<br />
0,48%<br />
393.405<br />
6.758<br />
/<br />
Read more about European Pilot Project<br />
Implicit Intraday Auctions (MI2 & MI6)<br />
Intraday Continuous <strong>Trading</strong><br />
Volumes by Products<br />
For informational purposes only.
Past 12 Months Trade Information<br />
Day-Ahead Auction<br />
Avg. Monthly Volume (MWh) 575.792<br />
Avg. Daily Volume (MWh) 18.930<br />
Avg. Base Price (€/MWh) 45,45<br />
Avg. Euro-Peak Price (€/MWh) 51,88<br />
Avg. SI-IT offered (MWh)/Avg. % Allocated 394.730 / 63,3%<br />
Avg. IT-SI offered (MWh)/Avg.% Allocated 474.780 / 13,0%<br />
Avg. SI-AT offered (MWh)/Avg. % Allocated 610.033 / 3,2%<br />
Avg. AT-SI offered (MWh)/Avg. % Allocated 233.866 / 62,7%<br />
Day-Ahead Market Volumes and Prices<br />
Intraday Continuous <strong>Trading</strong><br />
Avg. Monthly volume (MWh) 17.388<br />
Avg. Nbr. Of Transactions 364<br />
MI2 & MI6 Implicit Auctions<br />
Avg. Monthly volume MI2 (MWh) 26.764<br />
Avg. Monthly volume MI6 (MWh) 7.329<br />
Avg. SI-IT offered (MWh)/Avg. % Allocated 205.278 / 6,0%<br />
Avg. IT-SI offered (MWh)/Avg.% Allocated 305.362 / 3,0%<br />
Intraday Volumes (MWh)<br />
Total Volume in the past 12 months Continuous ■ MI2 ■ MI6 ■<br />
Mar. 17 26.133 17.516 5.505<br />
Apr. 17 27.822 29.853 9.325<br />
Maj. 17 19.354 41.953 5.891<br />
Jun. 17 13.404 33.927 10.241<br />
Jul. 17 23.037 45.876 11.279<br />
Avg. 17 13.612 34.912 10.123<br />
321.169<br />
Sep. 17 15.999 24.093 6.127<br />
Oct. 17 17.338 28.246 7.084<br />
208.519<br />
Nov. 17 9.509 24.392 10.152<br />
Dec. 17 15.959 17.009 3.557<br />
87.947 Jan. 18 18.652 14.053 4.992<br />
Feb. 18 7.702 9.339 3.671<br />
Absolute Difference Between MI and Day-Ahead Prices & MI Offered Cross-Zonal Capacities<br />
*Cross-Zonal Capacities not allocated on Day-Ahead Auction are later offered for MI2 and MI6 Auctions.<br />
For informational purposes only.
BSP Energy Exchange LL C<br />
Dunajska 156<br />
SI-1000 Ljubljana<br />
Slovenija<br />
+386 1 620 76 76<br />
+386 1 620 76 77<br />
www.bsp-southpool.com<br />
info@bsp-southpool.com<br />
For informational purposes only.