

Chapter 21. Adina Paytan. Tracing the Sources and Biogeochemical Cycling of Phosphorus in Aquatic Systems Using Isotopes of Oxygen in Phosphate

Create successful ePaper yourself
Turn your PDF publications into a flip-book with our unique Google optimized e-Paper software.
430 A. <strong>Paytan</strong> <strong>and</strong> K. McLaughl<strong>in</strong><br />
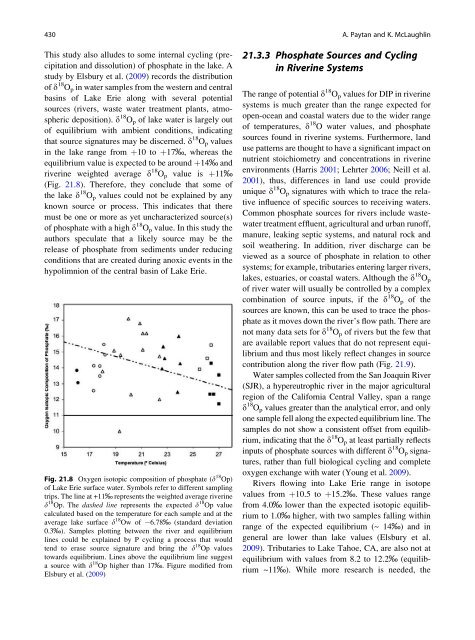
This study also alludes to some <strong>in</strong>ternal cycl<strong>in</strong>g (precipitation<br />
<strong>and</strong> dissolution) <strong>of</strong> phosphate <strong>in</strong> <strong>the</strong> lake. A<br />
study by Elsbury et al. (2009) records <strong>the</strong> distribution<br />
<strong>of</strong> d 18 O p <strong>in</strong> water samples from <strong>the</strong> western <strong>and</strong> central<br />
bas<strong>in</strong>s <strong>of</strong> Lake Erie along with several potential<br />
sources (rivers, waste water treatment plants, atmospheric<br />
deposition). d 18 O p <strong>of</strong> lake water is largely out<br />
<strong>of</strong> equilibrium with ambient conditions, <strong>in</strong>dicat<strong>in</strong>g<br />
that source signatures may be discerned. d 18 O p values<br />
<strong>in</strong> <strong>the</strong> lake range from þ10 to þ17‰, whereas <strong>the</strong><br />
equilibrium value is expected to be around þ14‰ <strong>and</strong><br />
river<strong>in</strong>e weighted average d 18 O p value is þ11‰<br />
(Fig. <strong>21.</strong>8). Therefore, <strong>the</strong>y conclude that some <strong>of</strong><br />
<strong>the</strong> lake d 18 O p values could not be expla<strong>in</strong>ed by any<br />
known source or process. This <strong>in</strong>dicates that <strong>the</strong>re<br />
must be one or more as yet uncharacterized source(s)<br />
<strong>of</strong> phosphate with a high d 18 O p value. In this study <strong>the</strong><br />
authors speculate that a likely source may be <strong>the</strong><br />
release <strong>of</strong> phosphate from sediments under reduc<strong>in</strong>g<br />
conditions that are created dur<strong>in</strong>g anoxic events <strong>in</strong> <strong>the</strong><br />
hypolimnion <strong>of</strong> <strong>the</strong> central bas<strong>in</strong> <strong>of</strong> Lake Erie.<br />
Fig. <strong>21.</strong>8 <strong>Oxygen</strong> isotopic composition <strong>of</strong> phosphate (d 18 Op)<br />
<strong>of</strong> Lake Erie surface water. Symbols refer to different sampl<strong>in</strong>g<br />
trips. The l<strong>in</strong>e at +11‰ represents <strong>the</strong> weighted average river<strong>in</strong>e<br />
d 18 Op. The dashed l<strong>in</strong>e represents <strong>the</strong> expected d 18 Op value<br />
calculated based on <strong>the</strong> temperature for each sample <strong>and</strong> at <strong>the</strong><br />
average lake surface d 18 Ow <strong>of</strong> 6.78‰ (st<strong>and</strong>ard deviation<br />
0.3‰). Samples plott<strong>in</strong>g between <strong>the</strong> river <strong>and</strong> equilibrium<br />
l<strong>in</strong>es could be expla<strong>in</strong>ed by P cycl<strong>in</strong>g a process that would<br />
tend to erase source signature <strong>and</strong> br<strong>in</strong>g <strong>the</strong> d 18 Op values<br />
towards equilibrium. L<strong>in</strong>es above <strong>the</strong> equilibrium l<strong>in</strong>e suggest<br />
a source with d 18 Op higher than 17‰. Figure modified from<br />
Elsbury et al. (2009)<br />
<strong>21.</strong>3.3 <strong>Phosphate</strong> <strong>Sources</strong> <strong>and</strong> <strong>Cycl<strong>in</strong>g</strong><br />
<strong>in</strong> River<strong>in</strong>e <strong>Systems</strong><br />
The range <strong>of</strong> potential d 18 O p values for DIP <strong>in</strong> river<strong>in</strong>e<br />
systems is much greater than <strong>the</strong> range expected for<br />
open-ocean <strong>and</strong> coastal waters due to <strong>the</strong> wider range<br />
<strong>of</strong> temperatures, d 18 O water values, <strong>and</strong> phosphate<br />
sources found <strong>in</strong> river<strong>in</strong>e systems. Fur<strong>the</strong>rmore, l<strong>and</strong><br />
use patterns are thought to have a significant impact on<br />
nutrient stoichiometry <strong>and</strong> concentrations <strong>in</strong> river<strong>in</strong>e<br />
environments (Harris 2001; Lehrter 2006; Neill et al.<br />
2001), thus, differences <strong>in</strong> l<strong>and</strong> use could provide<br />
unique d 18 O p signatures with which to trace <strong>the</strong> relative<br />
<strong>in</strong>fluence <strong>of</strong> specific sources to receiv<strong>in</strong>g waters.<br />
Common phosphate sources for rivers <strong>in</strong>clude wastewater<br />
treatment effluent, agricultural <strong>and</strong> urban run<strong>of</strong>f,<br />
manure, leak<strong>in</strong>g septic systems, <strong>and</strong> natural rock <strong>and</strong><br />
soil wea<strong>the</strong>r<strong>in</strong>g. In addition, river discharge can be<br />
viewed as a source <strong>of</strong> phosphate <strong>in</strong> relation to o<strong>the</strong>r<br />
systems; for example, tributaries enter<strong>in</strong>g larger rivers,<br />
lakes, estuaries, or coastal waters. Although <strong>the</strong> d 18 O p<br />
<strong>of</strong> river water will usually be controlled by a complex<br />
comb<strong>in</strong>ation <strong>of</strong> source <strong>in</strong>puts, if <strong>the</strong> d 18 O p <strong>of</strong> <strong>the</strong><br />
sources are known, this can be used to trace <strong>the</strong> phosphate<br />
as it moves down <strong>the</strong> river’s flow path. There are<br />
not many data sets for d 18 O p <strong>of</strong> rivers but <strong>the</strong> few that<br />
are available report values that do not represent equilibrium<br />
<strong>and</strong> thus most likely reflect changes <strong>in</strong> source<br />
contribution along <strong>the</strong> river flow path (Fig. <strong>21.</strong>9).<br />
Water samples collected from <strong>the</strong> San Joaqu<strong>in</strong> River<br />
(SJR), a hypereutrophic river <strong>in</strong> <strong>the</strong> major agricultural<br />
region <strong>of</strong> <strong>the</strong> California Central Valley, span a range<br />
d 18 O p values greater than <strong>the</strong> analytical error, <strong>and</strong> only<br />
one sample fell along <strong>the</strong> expected equilibrium l<strong>in</strong>e. The<br />
samples do not show a consistent <strong>of</strong>fset from equilibrium,<br />
<strong>in</strong>dicat<strong>in</strong>g that <strong>the</strong> d 18 O p at least partially reflects<br />
<strong>in</strong>puts <strong>of</strong> phosphate sources with different d 18 O p signatures,<br />
ra<strong>the</strong>r than full biological cycl<strong>in</strong>g <strong>and</strong> complete<br />
oxygen exchange with water (Young et al. 2009).<br />
Rivers flow<strong>in</strong>g <strong>in</strong>to Lake Erie range <strong>in</strong> isotope<br />
values from þ10.5 to þ15.2‰. These values range<br />
from 4.0‰ lower than <strong>the</strong> expected isotopic equilibrium<br />
to 1.0‰ higher, with two samples fall<strong>in</strong>g with<strong>in</strong><br />
range <strong>of</strong> <strong>the</strong> expected equilibrium (~ 14‰) <strong>and</strong> <strong>in</strong><br />
general are lower than lake values (Elsbury et al.<br />
2009). Tributaries to Lake Tahoe, CA, are also not at<br />
equilibrium with values from 8.2 to 12.2‰ (equilibrium<br />
~11‰). While more research is needed, <strong>the</strong>