Create successful ePaper yourself
Turn your PDF publications into a flip-book with our unique Google optimized e-Paper software.
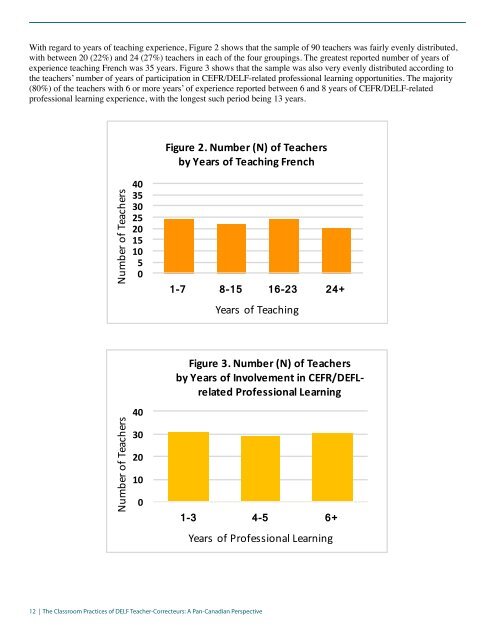
With regard to years of teaching experience, Figure 2 shows that the sample of 90 teachers was fairly evenly distributed,<br />
with between 20 (22%) and 24 (27%) teachers in each of the four groupings. The greatest reported number of years of<br />
experience teaching French was 35 years. Figure 3 shows that the sample was also very evenly distributed according to<br />
the teachers’ number of years of participation in CEFR/DELF-related professional learning opportunities. The majority<br />
(80%) of the teachers with 6 or more years’ of experience reported between 6 and 8 years of CEFR/DELF-related<br />
professional learning experience, with the longest such period being 13 years.<br />
Concerning the various types of CEFR/DELF-related professional learning opportunities in which the teachers reported<br />
having taken part, Table 1 shows that apart from the DELF examinateur-correcteur training in which all 90 teachers<br />
participated, the three most-frequently reported activities included the DELF examinateur-correcteur refresher, school/<br />
board conferences or workshops, and other conferences or workshops (e.g., ACPI, APPICPC, AQELFS, CASLT).<br />
Finally, in terms of the grades in which the teachers were teaching at the time of the survey, Table 2 shows that most<br />
teachers reported teaching in multiple grades, particularly in 9, 10, 11, and 12.<br />
Figure 2. Number (N) of Teachers<br />
by Years of Teaching French<br />
Table 1<br />
% CEFR/DELF Professional Learning<br />
Table 2<br />
% Grade Taught<br />
Number of Teachers<br />
40<br />
35<br />
30<br />
25<br />
20<br />
15<br />
10<br />
5<br />
0<br />
1-7 8-15 16-23 24+<br />
Years of Teaching<br />
100 % DELF examinateur-correcteur training<br />
66 % DELF examinateur-correcteur refresher<br />
56 % School/board conferences or workshops<br />
43 %<br />
Other conferences or workshops (e.g., ACPI,<br />
APPIPC, AQELFS, CASLT)<br />
34 % Self-directed<br />
29 % Job-embedded professional learning<br />
27 % CEFR provincial meetings<br />
2 % CEGEP<br />
2 % Secondaire 5<br />
1 % Secondaire 4<br />
39 % Grade 12<br />
41 % Grade 11<br />
37 % Grade 10<br />
50 % Grade 9<br />
26 % Grade 8<br />
23 % Grade 7<br />
Figure 3. Number (N) of Teachers<br />
by Years of Involvement in CEFR/DEFLrelated<br />
Professional Learning<br />
27 % CEFR regional learning events<br />
22 % Coaching/mentoring<br />
8 % DELF formateur training<br />
16 % Grade 6<br />
17 % Grade 5<br />
11 % Grade 4<br />
Number of Teachers<br />
40<br />
30<br />
20<br />
10<br />
0<br />
1-3 4-5 6+<br />
8 % Grade 3<br />
8 % Grade 2<br />
7 % Grade 1<br />
3 % Kindergarten<br />
Years of Professional Learning<br />
12 | The Classroom Practices of DELF Teacher-Correcteurs: A Pan-Canadian Perspective DELF Centres of Canada | 13


