Climate change and water resources in the Murray Darling Basin ...
Climate change and water resources in the Murray Darling Basin ...
Climate change and water resources in the Murray Darling Basin ...

You also want an ePaper? Increase the reach of your titles
YUMPU automatically turns print PDFs into web optimized ePapers that Google loves.
ABARE CONFERENCE PAPER 02.11<br />
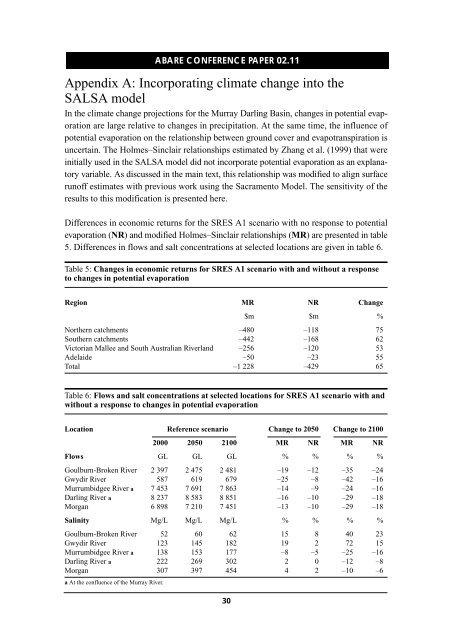
Appendix A: Incorporat<strong>in</strong>g climate <strong>change</strong> <strong>in</strong>to <strong>the</strong><br />
SALSA model<br />
In <strong>the</strong> climate <strong>change</strong> projections for <strong>the</strong> <strong>Murray</strong> Darl<strong>in</strong>g Bas<strong>in</strong>, <strong>change</strong>s <strong>in</strong> potential evaporation<br />
are large relative to <strong>change</strong>s <strong>in</strong> precipitation. At <strong>the</strong> same time, <strong>the</strong> <strong>in</strong>fluence of<br />
potential evaporation on <strong>the</strong> relationship between ground cover <strong>and</strong> evapotranspiration is<br />
uncerta<strong>in</strong>. The Holmes–S<strong>in</strong>clair relationships estimated by Zhang et al. (1999) that were<br />
<strong>in</strong>itially used <strong>in</strong> <strong>the</strong> SALSA model did not <strong>in</strong>corporate potential evaporation as an explanatory<br />
variable. As discussed <strong>in</strong> <strong>the</strong> ma<strong>in</strong> text, this relationship was modified to align surface<br />
runoff estimates with previous work us<strong>in</strong>g <strong>the</strong> Sacramento Model. The sensitivity of <strong>the</strong><br />
results to this modification is presented here.<br />
Differences <strong>in</strong> economic returns for <strong>the</strong> SRES A1 scenario with no response to potential<br />
evaporation (NR) <strong>and</strong> modified Holmes–S<strong>in</strong>clair relationships (MR) are presented <strong>in</strong> table<br />
5. Differences <strong>in</strong> flows <strong>and</strong> salt concentrations at selected locations are given <strong>in</strong> table 6.<br />
Table 5: Changes <strong>in</strong> economic returns for SRES A1 scenario with <strong>and</strong> without a response<br />
to <strong>change</strong>s <strong>in</strong> potential evaporation<br />
Region MR NR Change<br />
$m $m %<br />
Nor<strong>the</strong>rn catchments –480 –118 75<br />
Sou<strong>the</strong>rn catchments –442 –168 62<br />
Victorian Mallee <strong>and</strong> South Australian Riverl<strong>and</strong> –256 –120 53<br />
Adelaide –50 –23 55<br />
Total –1 228 –429 65<br />
Table 6: Flows <strong>and</strong> salt concentrations at selected locations for SRES A1 scenario with <strong>and</strong><br />
without a response to <strong>change</strong>s <strong>in</strong> potential evaporation<br />
Location Reference scenario Change to 2050 Change to 2100<br />
2000 2050 2100 MR NR MR NR<br />
Flows GL GL GL % % % %<br />
Goulburn-Broken River 2 397 2 475 2 481 –19 –12 –35 –24<br />
Gwydir River 587 619 679 –25 –8 –42 –16<br />
Murrumbidgee River a 7 453 7 691 7 863 –14 –9 –24 –16<br />
Darl<strong>in</strong>g River a 8 237 8 583 8 851 –16 –10 –29 –18<br />
Morgan 6 898 7 210 7 451 –13 –10 –29 –18<br />
Sal<strong>in</strong>ity Mg/L Mg/L Mg/L % % % %<br />
Goulburn-Broken River 52 60 62 15 8 40 23<br />
Gwydir River 123 145 182 19 2 72 15<br />
Murrumbidgee River a 138 153 177 –8 –5 –25 –16<br />
Darl<strong>in</strong>g River a 222 269 302 2 0 –12 –8<br />
Morgan 307 397 454 4 2 –10 –6<br />
a At <strong>the</strong> confluence of <strong>the</strong> <strong>Murray</strong> River.<br />
30