Climate change and water resources in the Murray Darling Basin ...
Climate change and water resources in the Murray Darling Basin ...
Climate change and water resources in the Murray Darling Basin ...

You also want an ePaper? Increase the reach of your titles
YUMPU automatically turns print PDFs into web optimized ePapers that Google loves.
ABARE CONFERENCE PAPER 02.11<br />
The focus <strong>in</strong> this study is to exam<strong>in</strong>e how different global warm<strong>in</strong>g trends may affect <strong>the</strong><br />
hydrological cycle <strong>and</strong> agricultural production <strong>in</strong> <strong>the</strong> <strong>Murray</strong> Darl<strong>in</strong>g Bas<strong>in</strong>. It is not specifically<br />
concerned with <strong>the</strong> assumptions of economic, technological, demographic or o<strong>the</strong>r<br />
forces that underlie a specific emissions scenario. At <strong>the</strong> same time, it is useful to contrast<br />
a scenario that reflects an extension of <strong>the</strong> current trend <strong>in</strong> emissions to one <strong>in</strong> which <strong>the</strong>re<br />
has been a significant reduction <strong>in</strong> emissions.<br />
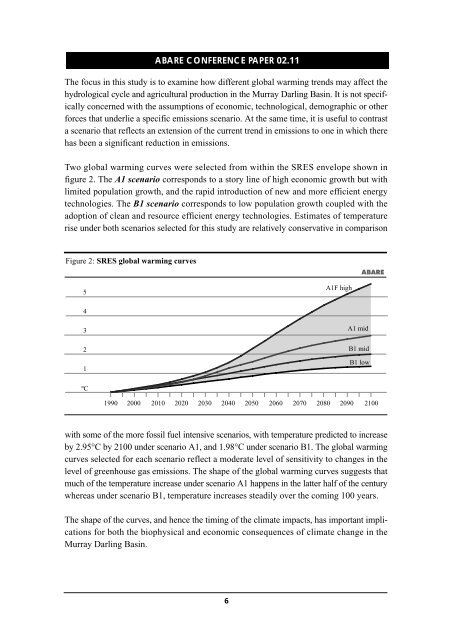
Two global warm<strong>in</strong>g curves were selected from with<strong>in</strong> <strong>the</strong> SRES envelope shown <strong>in</strong><br />
figure 2. The A1 scenario corresponds to a story l<strong>in</strong>e of high economic growth but with<br />
limited population growth, <strong>and</strong> <strong>the</strong> rapid <strong>in</strong>troduction of new <strong>and</strong> more efficient energy<br />
technologies. The B1 scenario corresponds to low population growth coupled with <strong>the</strong><br />
adoption of clean <strong>and</strong> resource efficient energy technologies. Estimates of temperature<br />
rise under both scenarios selected for this study are relatively conservative <strong>in</strong> comparison<br />
Figure 2: SRES global warm<strong>in</strong>g curves<br />
5<br />
4<br />
3<br />
2<br />
1<br />
ºC<br />
1990 2000 2010 2020 2030 2040 2050 2060 2070 2080 2090 2100<br />
with some of <strong>the</strong> more fossil fuel <strong>in</strong>tensive scenarios, with temperature predicted to <strong>in</strong>crease<br />
by 2.95°C by 2100 under scenario A1, <strong>and</strong> 1.98°C under scenario B1. The global warm<strong>in</strong>g<br />
curves selected for each scenario reflect a moderate level of sensitivity to <strong>change</strong>s <strong>in</strong> <strong>the</strong><br />
level of greenhouse gas emissions. The shape of <strong>the</strong> global warm<strong>in</strong>g curves suggests that<br />
much of <strong>the</strong> temperature <strong>in</strong>crease under scenario A1 happens <strong>in</strong> <strong>the</strong> latter half of <strong>the</strong> century<br />
whereas under scenario B1, temperature <strong>in</strong>creases steadily over <strong>the</strong> com<strong>in</strong>g 100 years.<br />
The shape of <strong>the</strong> curves, <strong>and</strong> hence <strong>the</strong> tim<strong>in</strong>g of <strong>the</strong> climate impacts, has important implications<br />
for both <strong>the</strong> biophysical <strong>and</strong> economic consequences of climate <strong>change</strong> <strong>in</strong> <strong>the</strong><br />
<strong>Murray</strong> Darl<strong>in</strong>g Bas<strong>in</strong>.<br />
6<br />
A1F high<br />
A1 mid<br />
B1 mid<br />
B1 low