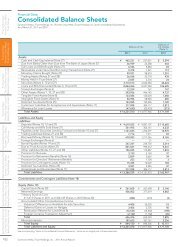
Balance and ratio to total loan balance of NPLs
Balance and ratio to total loan balance of NPLs
Balance and ratio to total loan balance of NPLs

You also want an ePaper? Increase the reach of your titles
YUMPU automatically turns print PDFs into web optimized ePapers that Google loves.
The Sumi<strong>to</strong>mo Trust<br />
& B Banking ki C Co., Ltd. Ltd<br />
Information Meeting<br />
on<br />
Financial Results for 1HFY2009<br />
November 26 26, 2009
This presentation material contains information that constitutes forwardlooking<br />
g statements. Such forward-looking g statements are not gguarantees<br />
<strong>of</strong> future performance <strong>and</strong> involve risks <strong>and</strong> uncertainties, <strong>and</strong> actual<br />
results may differ from those in the forward-looking statements as a result<br />
<strong>of</strong> various fac<strong>to</strong>rs including changes in managerial circumstances.<br />
This presentation does not constitute an <strong>of</strong>fer <strong>to</strong> sell or a solicitation <strong>of</strong> an<br />
<strong>of</strong>fer <strong>to</strong> subscribe for or purchase any securities.
Meeting agenda<br />
1HFY2009 financial results <strong>and</strong> financial condition<br />
Status <strong>of</strong> capital<br />
Forecast for FY2009<br />
Strategy <strong>and</strong> performance <strong>of</strong> group companies<br />
Credit portfolio<br />
(F (For reference) f ) Division Di i i performance f<br />
1
中表紙<br />
1HFY2009 financial results<br />
<strong>and</strong> financial condition<br />
2
1HFY2009 financial results (April 2009 – September 2009)<br />
Net business pr<strong>of</strong>it (non-consolidated): Increased by 8.8 billion yen from 1HFY2008 <strong>to</strong> 81.6 billion yen mainly<br />
due <strong>to</strong> the dividend income from a subsidiary resulting from the gain on retirement <strong>of</strong> perpetual subordinated<br />
bonds (9.4 billion yen)<br />
(*) () Net business ppr<strong>of</strong>it: Denotes “Net business ppr<strong>of</strong>it before credit costs” in this ppresentation<br />
Net income (consolidated): Decreased by 9.0 billion yen from 1HFY2008 <strong>to</strong> 19.2 billion yen, mainly due <strong>to</strong> the<br />
increase in <strong>to</strong>tal credit costs as a result <strong>of</strong> a higher allowance for doubtful <strong>loan</strong>s on non-consolidated basis<br />
<br />
(in billions <strong>of</strong> Yen)<br />
1HFY2009 1HFY2008 Change % change<br />
Net business pr<strong>of</strong>it before credit costs 87 87.7 7 95 95.3 3 -77.5 5 -8% 8%<br />
(Total substantial credit costs) (*1) (-40.8) (-24.5) (-16.2) (-66%)<br />
Ordinary pr<strong>of</strong>it 33.4 54.7 -21.3 -39%<br />
Extraordinary pr<strong>of</strong>it (*2) 9.5 2.1 7.4 344%<br />
Net income 19.2 28.3 -9.0 -32%<br />
(in billions <strong>of</strong> Yen)<br />
Net business pr<strong>of</strong>it before credit costs 81.6 72.7 8.8 12%<br />
Net interest income (Including net trust fees <strong>of</strong> principal guaranteed trust a/c ) (*2) 90.7 81.6 9.0 11%<br />
NNet tf fees & commissions i i (Including other trust fees) 41 41.7 7 44 44.7 7 -2.9 29 -7% 7%<br />
Other pr<strong>of</strong>its 13.7 13.5 0.1 1%<br />
General <strong>and</strong> administrative expenses -64.6 -67.2 2.5 4%<br />
Total credit costs -27.2 -3.4 -23.8 -697%<br />
(Total substantial credit costs) (*1) (Total substantial credit costs) (-32.7) ( 32.7) (-10.3) ( 10.3) (-22.3) ( 22.3) (-217%) ( 217%)<br />
Net gains on sales <strong>of</strong> s<strong>to</strong>cks <strong>and</strong> other securities -6.3 -9.3 3.0 32%<br />
Ordinary pr<strong>of</strong>it 31.1 47.5 -16.3 -34%<br />
Extraordinary pr<strong>of</strong>it 0.1 0.9 -0.8 -81%<br />
Net income 19.3 30.3 -11.0 -36%<br />
Dividend per share (Yen) (Interim) 5.0 8.5 - -<br />
(*1) "Total substantial credit costs" is a sum <strong>of</strong> "Total credit costs", costs in "Net gains on sales <strong>of</strong> s<strong>to</strong>cks <strong>and</strong> other securities" <strong>and</strong> "Other non-recurring<br />
pr<strong>of</strong>it" which are related <strong>to</strong> investment in securities <strong>of</strong> domestic <strong>and</strong> overseas credit, <strong>and</strong> affiliates' <strong>to</strong>tal credit costs included in "Net income from<br />
affiliates by equity method".<br />
(*2) The gain on retirement <strong>of</strong> perpetual subordinated bonds (9.4 billion yen) which was posted in “Extraordinary pr<strong>of</strong>it” on consolidated basis was posted<br />
i in “N “Net t iinterest t t i income” ” as di dividend id d iincome ffrom a subsidiary b idi on non-consolidated lid t d bbasis. i<br />
3
Contribution <strong>of</strong> major group companies <strong>to</strong> consolidated financial results<br />
Net business pr<strong>of</strong>it decreased by 5.5 billion yen from 1HFY 2008 <strong>to</strong> 17.5 billion yen mainly due <strong>to</strong> the decline in fee<br />
revenue <strong>of</strong> group companies (nominal contribution <strong>to</strong> consolidated results was 6.1 billion yen mainly because the gain on<br />
retirement <strong>of</strong> perpetual subordinated bonds was posted in extraordinary income on consolidated basis)<br />
Contribution <strong>to</strong> net income (-0.04 billion yen): Improved by 2.0 billion yen from 1HFY2008 partly due <strong>to</strong> the decrease in<br />
<strong>to</strong>tal substantial credit costs <strong>of</strong> First Credit (improved by 33.5 5 billion yen before consolidated adjustments adjustments, excluding the<br />
effect <strong>of</strong> special fac<strong>to</strong>r mentioned in the second line from the bot<strong>to</strong>m on below chart)<br />
Business<br />
group<br />
Group's Group s<br />
ownership<br />
Consolidated<br />
Net business pr<strong>of</strong>it<br />
before credit costs<br />
1H<br />
FY2009<br />
1H<br />
FY2008 Change<br />
Consolidated Net income<br />
before amortization <strong>of</strong><br />
d ill (*) goodwill (*)<br />
1H<br />
FY2009<br />
1H<br />
FY2008 Change<br />
MMajor j ffac<strong>to</strong>r t <strong>of</strong> f the th difference diff (net ( t income) i )<br />
(in billions <strong>of</strong> Yen)<br />
Sumishin Guaranty Co., Ltd. Retail 100% 1.38 1.13 0.24 0.70 0.42 0.28 0.31 Guaranty fees +0.27<br />
STB Leasing g Co., , Ltd. Wholesale 100% % 4.17 3.69 0.48 0.85 1.05 -0.20 -0.55 Total substantial credit costs -0.99, , Leasing g pr<strong>of</strong>it p +0.46 +<br />
Sumishin Matsushita Financial<br />
Services Co., Ltd.<br />
Wholesale 66% 3.35 3.14 0.20 1.02 0.32 0.70 1.84 Gain on sales <strong>of</strong> au<strong>to</strong> lease receivables +1.61<br />
First Credit Corpo<strong>ratio</strong>n Wholesale 100% 2.60 4.59 -1.99 1.12 -4.10 5.23 4.96 Total substantial credit costs +6.97, Loan interest, <strong>loan</strong> fees -2.43<br />
Life Housing Loan, Ltd. Wholesale 100% 2.84 1.66 1.17 1.64 0.96 0.67 1.14 Gain on securitization <strong>of</strong> residential mortgage <strong>loan</strong>s +1.03<br />
BUSINEXT CORPORATION Wh Wholesale l l 40% 117 1.17 127 1.27 -0.09 009 000 0.00 019 0.19 -0.19 019 -0.19 019<br />
Japan TA Solution, Ltd.<br />
S<strong>to</strong>ck transfer<br />
agency<br />
80% -0.68 1.57 -2.26 -0.57 0.75 -1.32 -2.26<br />
Preceding decrease in subcontracting fees through paperless<br />
s<strong>to</strong>ck -2.67, Decrease in expenses +0.39<br />
STB Asset Management Co., Ltd. Fiduciary 100% 0.34 0.68 -0.34 0.19 0.39 -0.19 -0.34 Fees -0.56, Decrease in expenses +0.23<br />
Sumi<strong>to</strong>mo Trust <strong>and</strong> Banking Co.<br />
(USA) (U.S.A.)<br />
Fiduciaryy 100% 0.90 2.64 -1.73 0.55 1.55 -1.00 -1.73 Lending g fees <strong>and</strong> cus<strong>to</strong>dy y fees -1.69<br />
Japan Trustee Services Bank, Ltd. Fiduciary 33% -0.54 0.09 -0.64 -0.34 0.05 -0.40 -0.04 Fees -0.49<br />
Sumishin Realty Co., Ltd. Real estate 100% -0.37 0.06 -0.43 -0.23 0.00 -0.24 -0.41 Brokerage fees -0.86, decrease in expenses +0.46<br />
STB Real Estate Investment<br />
Management Co., Ltd.<br />
Real estate 100% 0.31 0.32 -0.01 0.18 0.19 0.00 -0.10<br />
SBI Sumishin Net Bank, Ltd. Other 50% 0.68 -1.50 2.19 0.64 -1.53 2.18 2.18 Loan interest +1.24, Sales <strong>of</strong> bonds +0.39<br />
Total 17.54 23.10 -5.56 15.82 2.84 12.98<br />
(Exc. STB Finance Cayman Ltd.) (17.54) (23.10) (-5.56) (6.35) (2.84) (3.51) Gain on retirement <strong>of</strong> perpetual subordinated bonds 9.4<br />
Total (Consolidated difference, after consolidated adjustments)<br />
6.12 22.52 -16.40 -0.04 -2.07 2.02 Elimination: dividend income from a leasing subsidiary -1.8<br />
(*) Goodwill amortization 4.2 bn yen: Sumishin Matsushita Financial Services 1.0 bn yen,<br />
First Credit 2.6 bn yen, Life Housing Loan 0.5 bn yen<br />
4
Breakdown <strong>of</strong> pr<strong>of</strong>it by business<br />
Retail financial services: Gross business pr<strong>of</strong>it (non-consolidated) decreased by 4.1 billion yen from 1HFY2008,<br />
as <strong>loan</strong>-deposit margin shrunk <strong>and</strong> mutual fund related fees decreased<br />
Wholesale financial services: Gross business pr<strong>of</strong>it (non-consolidated) increased by 4.3 billion yen from<br />
1HFY2008, including g a 5.4 billion yyen <strong>of</strong> ggain<br />
on sales <strong>of</strong> overseas credit investment securities<br />
Fiduciary services: Gross business pr<strong>of</strong>it (non-consolidated) decreased by 6.5 billion yen from 1HFY2008,<br />
mainly due <strong>to</strong> the decline in trust fees caused by the decline in market value <strong>of</strong> entrusted assets<br />
Real estate: Gross business pr<strong>of</strong>it (non-consolidated) decreased by 2.5 billion yen from 1HFY2008, mainly due<br />
<strong>to</strong> the drop in brokerage volume<br />
<br />
<br />
(i billi f Y )<br />
1HFY<br />
2009<br />
1HFY<br />
2008<br />
Change<br />
1HFY<br />
2009<br />
1HFY<br />
2008<br />
Change<br />
1HFY<br />
2009<br />
1HFY<br />
2008<br />
Change<br />
<br />
<br />
Gross business pr<strong>of</strong>it Net business pr<strong>of</strong>it Net business pr<strong>of</strong>it<br />
before credit costs before credit costs before credit costs<br />
(in billions <strong>of</strong> Yen) 2009 2008<br />
g<br />
2009 2008<br />
g<br />
2009 2008<br />
g<br />
Retail financial services 36.3 40.5 -4.1 5.9 10.8 -4.8 7.5 12.1 -4.6<br />
Wholesale financial services 53.9 49.6 4.3 38.9 31.3 7.5 50.9 49.6 1.2<br />
S<strong>to</strong>ck transfer agency services 7.7 9.2 -1.4 3.1 2.0 1.1 2.4 3.6 -1.1<br />
Treasury <strong>and</strong> financial products 34.9 33.1 1.8 29.5 27.4 2.0 29.5 27.4 2.0<br />
Fiduciary services 23.5 30.0 -6.5 9.0 14.9 -5.8 10.0 18.5 -8.5<br />
Pension asset management 17.6 19.7 -2.1 5.8 8.2 -2.3 6.2 8.9 -2.7<br />
Securities processing services 5.99<br />
10 10.3 3 -4.33<br />
32 3.2 66.7 -3.5 3 38 3.8 96 9.6 -5.88<br />
Real estate 4.4 7.0 -2.5 0.9 2.9 -1.9 0.7 3.1 -2.4<br />
Fees paid for outsourcing (*1) -10.4 -13.2 2.7 - - - - - -<br />
Others (*2)<br />
Others 36 3.6 -77.0 0 10 10.6 6 -22.5 5 -14 14.4 4 11 11.9 9 -10 10.8 8 -15 15.5 5 47 4.7<br />
Total 146.2 139.9 6.2 81.6 72.7 8.8 87.7 95.3 -7.5<br />
(*1) Breakdown by business for 1HFY2009 with changes from 1HFY2008 in parenthesis: S<strong>to</strong>ck transfer<br />
agency services -3.6 bn yen (+2.4 bn yen), Fiduciary services -6.8 bn yen (+0.3 bn yen)<br />
(*2) Include cost <strong>of</strong> capital funding, dividend <strong>of</strong> shares for cross-shareholdings, general <strong>and</strong> administrative<br />
expenses <strong>of</strong> headquarters headquarters, etc<br />
Include dividend income resulting from the gain on retirement <strong>of</strong> perpetual subordinated bonds<br />
(9.4 billion yen) on non-consolidated basis<br />
Redemption pr<strong>of</strong>it <strong>of</strong> mutual funds (9.0 billion yen) in 1HFY2008 is posted in “Treasury <strong>and</strong> financial<br />
products” , which was originally posted in “Others”<br />
5
Breakdown <strong>of</strong> net interest income<br />
Loan-deposit margin dropped by 4bp from 2HFY2008 <strong>to</strong> 1HFY2009, as both <strong>loan</strong> <strong>and</strong> deposit yields decreased mainly due<br />
<strong>to</strong> the decline in market interest rates<br />
Net interest income increased by 9.0 billion yen from 1HFY2008, because international net interest income substantially<br />
increased mainly due <strong>to</strong> the dividend income from a subsidiary resulting from the gain on retirement <strong>of</strong> perpetual<br />
subordinated bonds, while domestic net interest income decreased due <strong>to</strong> the decline in securities related income<br />
<br />
FY2009<br />
1H<br />
1HFY09-<br />
2HFY08<br />
Change<br />
1HFY09-<br />
1HFY08<br />
FY2008<br />
2H 1H<br />
Average yield on Loans <strong>and</strong> bills discounted 1.48% -0.10% -0.11% 1.58% 1.59%<br />
AAverage yield i ldon DDeposits it & TTrust t principal i i l 052% 0.52% -0.06% 006% -0.05% 005% 058% 0.58% 057% 0.57%<br />
Loan-deposit margin 0.96% -0.04% -0.06% 1.00% 1.02%<br />
<br />
(Income: in billions <strong>of</strong> Yen)<br />
(Average <strong>balance</strong>: in trillions <strong>of</strong> Yen)<br />
Domestic banking a/c <strong>and</strong><br />
Principal guaranteed trust a/c combined<br />
1HFY2009 1HFY2008<br />
Income Average<br />
<strong>balance</strong><br />
Yield Income Average<br />
<strong>balance</strong><br />
69.8 73.5 -3.6<br />
Change<br />
Yield Income Average<br />
<strong>balance</strong> Yield<br />
Interest te est income co e 110.6 06 15.38 538 1.43% 3% 119.2 9 15.18 5 8 1.56% 56% -8.6 86 0.20 0 0 -0.13% 0 3%<br />
Loans 78.4 10.53 1.48% 81.3 10.17 1.59% -2.9 0.36 -0.11%<br />
Securities (*1) 23.9 3.25 1.47% 32.2 3.31 1.94% -8.2 -0.06 -0.47%<br />
Swaps 4.0 1.9 2.1<br />
Interest expenses 41.1 15.50 0.52% 47.4 15.44 0.61% -6.3 0.05 -0.08%<br />
Deposits & Trust principal 31.3 11.87 0.52% 33.7 11.61 0.57% -2.3 2.3 0.26 -0.05% 0.05%<br />
Negotiable certificate <strong>of</strong> deposit 3.4 2.13 0.31% 8.3 2.31 0.71% -4.9 -0.18 -0.39%<br />
Call money, etc. (*2) 0.5 0.57 0.17% 2.0 0.77 0.53% -1.5 -0.19 -0.36%<br />
International 20.8 8.1 12.7<br />
Total 90.7 81.6 9.0<br />
2.0%<br />
1.5%<br />
1.0%<br />
0.5%<br />
0.0%<br />
Average yield on Loans <strong>and</strong> bills discounted<br />
Average yield on Deposits & Trust principal<br />
Loan-deposit margin<br />
2HFY2007 1HFY2008 2HFY2008 1HFY2009<br />
- Redemption pr<strong>of</strong>it <strong>of</strong> mutual funds -7.0 bn<br />
(1HFY08 11.0 bn � 1HFY09 4.0 bn)<br />
- Dividend from s<strong>to</strong>cks -1.0 bn<br />
(7.0 bn � 6.0 bn)<br />
- Securities -15.0 bn (47.0 bn� 32.0 bn)<br />
Dividend income from an overseas<br />
subsidiary resulting from the gain on<br />
retirement <strong>of</strong> perpetual subordinated<br />
bonds +9.4 bn<br />
- Loan spread -9.5 bn (19.0 bn� 9.5 bn)<br />
- Swaps +12.0 bn (-14.5 bn� -2.5 bn)<br />
- Interest expenses -29.0 bn<br />
(47.0 bn� 18.0)<br />
(*1) Sum <strong>of</strong> securities <strong>and</strong> purchased <strong>loan</strong>s<br />
(*2) Include Call money, Bills sold, Loans from trust a/c, Buy/sell, Repo <strong>and</strong> Short term bonds<br />
6
Fee revenue breakdown<br />
Other trust fees (consolidated): Decreased by 7.8 billion yen from 1HFY2008 due <strong>to</strong> the decrease in<br />
market value <strong>of</strong> entrusted assets (including 2.1 billion yen decrease owing <strong>to</strong> the dissolution <strong>of</strong> the effect<br />
resulting from the revision <strong>of</strong> accrual method in the previous fiscal year)<br />
Net fees <strong>and</strong> commissions (consolidated): Decreased by 22.2 2 billion yen from 1HFY2008 due <strong>to</strong> the<br />
decline in administ<strong>ratio</strong>n fees <strong>of</strong> mutual funds <strong>and</strong> individual annuities <strong>of</strong> retail financial services, in<br />
addition <strong>to</strong> the decrease in real estate brokerage volume<br />
Non-consolidated Consolidated<br />
(in billions <strong>of</strong> Yen)<br />
1H<br />
FY2009<br />
1H<br />
FY2008 Change<br />
1H<br />
FY2009<br />
1H<br />
FY2008<br />
Change Major contributing fac<strong>to</strong>rs (Consolidated)<br />
Other trust fees 23.3 31.1 -7.8 23.2 31.1<br />
Dissolution <strong>of</strong> the effect resulting from the revision <strong>of</strong> accrual method<br />
-7.8<br />
in FY2008 -2.1<br />
Pension trust(*1), Public pension 14.0 18.2 -4.2 14.0 18.2 -4.2 Pension trust -2.8 (Market value -1.2, fac<strong>to</strong>r mentioned above -1.1)<br />
Securities processing services 6.2 9.3 -3.1 6.2 9.3 -3.1 Mutual fund -3.0 (Market value -1.1, fac<strong>to</strong>r mentioned above -1.1)<br />
Real estate 1.5 2.1 -0.5 1.5 2.1 -0.5 Securitization -0.3<br />
Net fees <strong>and</strong> commissions 18.4 13.6 4.8 36.1 38.3 -2.2<br />
Domestic business 18.2 14.4 3.8 32.5 34.0 -1.4<br />
Retail financial services 5.6 6.6 -1.0 8.4 9.2<br />
Mutual fund <strong>and</strong> Individual annuity -1.3 1 3<br />
-0.8<br />
(Sales fee -0.2, administ<strong>ratio</strong>n fee -1.1)<br />
Wholesale financial services 13.2 10.2 2.9 20.0 21.0<br />
Non-consolidated +2.9 (Arrangement fee for syndicated <strong>loan</strong>s <strong>and</strong><br />
-1.0<br />
project finance +2.9), Consolidated -3.9 (S<strong>to</strong>ck transfer agency -2.6)<br />
S<strong>to</strong>ck transfer agency services 4.1 3.1 0.9 8.4 10.1 -1.7 Non-consolidated +0.9, Consolidated -2.6(fees <strong>of</strong> outsorcing<br />
subsidiary y -2.6) )<br />
Real estate 2.7 4.5 -1.8 6.6 9.4 -2.7 Real estate brokerage -2.7 (Non-consolidated -1.8, subsidiary -0.9)<br />
Fees paid for outsourcing<br />
(cus<strong>to</strong>dy & pension administ<strong>ratio</strong>n)<br />
-6.8 -7.1 0.3 -6.8 -7.1 0.3<br />
International business 0.1 -0.8 1.0 3.5 4.3 -0.7 Non-consolidated +1.0, STB (U.S.A.) -1.7<br />
Total (A) 41.7 44.7 -2.9 59.3 69.4 -10.1<br />
Gross pr<strong>of</strong>its before credit costs (B) 146.2 139.9 6.2 183.8 193.4 -9.6<br />
Fee <strong>ratio</strong> (A)/(B)(%) 28.6% 32.0% -3.4% 32.2% 35.9% -3.7%<br />
(*1) ( ) Lead manager g fees from p pension trusts are included ( (amount affected 1HFY2009: 2.1 bn yyen, 1HFY2008: 1.7 bn y yen) )<br />
7
Breakdown <strong>of</strong> <strong>to</strong>tal substantial credit costs 1. Group companies, domestic (non-consolidated)<br />
Total substantial credit costs <strong>of</strong> group companies for 1HFY2009 were -8.1 billion yen, mainly due <strong>to</strong> the worsening<br />
conditions <strong>of</strong> some clients <strong>of</strong> leasing subsidiaries <strong>and</strong> their increased reserve <strong>ratio</strong>. Those <strong>of</strong> First Credit decreased <strong>to</strong><br />
-1.1 billion yen because the effects <strong>of</strong> declining collateral values peaked out<br />
Domestic <strong>to</strong>tal substantial credit costs (non-consolidated) amounted <strong>to</strong> -24.1 billion yen, mainly due <strong>to</strong> the higher<br />
reserve <strong>ratio</strong> ti in i response <strong>to</strong> t the th increase i in i doubtful d btf l <strong>loan</strong>s l (96% coverage <strong>ratio</strong> ti with ith collateral ll t l value l <strong>and</strong> d specific ifi<br />
allowance for <strong>loan</strong> losses)<br />
<br />
FY2008 FY2009<br />
(in billions <strong>of</strong> Yen) 1H 2H Full 1H<br />
Consolidated -24.5 -145.5 -170.0 -40.8<br />
Non-consolidated -10.3 -110.9 -121.3 -32.7<br />
Overseas fac<strong>to</strong>rs -10.0 10.0 -63.1 63.1 -73.1 73.1 -8.5 8.5<br />
Group companies -14.1 -34.5 -48.7 -8.1<br />
Major fac<strong>to</strong>rs <strong>of</strong> change (1HFY2009)<br />
STB Leasing -1.9 -2.2 -4.2 -2.9 Change <strong>of</strong> reserve <strong>ratio</strong> -1.1, w orsened conditions <strong>of</strong> some clients, etc.<br />
Sumishin Matsushita Financial Services -1.9 -0.8 -2.8 -2.0 Change <strong>of</strong> reserve <strong>ratio</strong> -0.5, w orsened conditions <strong>of</strong> some clients, etc.<br />
First CCredit -8.1 81 -29.2 29 2 -37.3 37 3 -1.1 11DDow ngrade d <strong>of</strong> f classification l ifi i -3.9、collection 3 9 ll i <strong>of</strong> f NPL etc. 22.7 7<br />
<br />
Account (in billions <strong>of</strong> Yen)<br />
FY2008 FY2009<br />
1H 2H Full 1H<br />
Total credit costs -0.3 -46.5 -46.8 -24.0<br />
Major fac<strong>to</strong>rs <strong>of</strong> change (FY2009)<br />
General allowance for <strong>loan</strong> losses 2.6 -1.5 1.0 20.5<br />
Decrease in <strong>loan</strong>s <strong>to</strong> special mention deb<strong>to</strong>rs 24.6, increse in <strong>loan</strong>s <strong>to</strong><br />
special mention deb<strong>to</strong>rs -1.6, increase in <strong>loan</strong>s <strong>to</strong> subst<strong>and</strong>ard<br />
deb<strong>to</strong>rs -3.6<br />
SSpecific ifi allowance ll ffor l<strong>loan</strong> llosses -3.0 30 -36.4 36 4 -39.4 39 4 -42.6 42 6 IIncrease in i doubtful d b f ll<strong>loan</strong>s -59.1, 9 1 ddecrease iin ddoubtful b f ll<strong>loan</strong>s 16 16.5<br />
Written <strong>of</strong>f <strong>and</strong> losses on sales <strong>of</strong> <strong>loan</strong>s -0.6 -8.7 -9.3 -2.4<br />
Other non-recurring pr<strong>of</strong>it 0.0 -1.2 -1.2 -0.0<br />
Domestic fac<strong>to</strong>rs -0.2 -47.8 -48.1 -24.1<br />
8
Breakdown <strong>of</strong> <strong>to</strong>tal substantial credit costs 2. Overseas (non-consolidated)<br />
Overseas <strong>to</strong>tal substantial credit costs (non-consolidated) for 1HFY2009 were -8.5 billion yen, including<br />
-4.5 billion yen <strong>of</strong> impairment loss on asset-backed securities <strong>and</strong> losses on sales for risk reduction<br />
(corporate <strong>loan</strong>s -2.3 billion yen, asset-backed securities -0.8 billion yen)<br />
On the other h<strong>and</strong>, 5.4 billion yen <strong>of</strong> gain on sale <strong>of</strong> impaired securities was posted in net gains on<br />
bonds, showing the appropriateness <strong>of</strong> our market valuation<br />
< Breakdown <strong>of</strong> <strong>to</strong>tal substantial credit costs (Overseas, non-consolidated) ><br />
FY2008 FY2009<br />
Account (in billions <strong>of</strong> Yen) 1H 2H Full 1H<br />
Total credit costs -3.1 -4.9 -8.0 -3.2<br />
General allowance for <strong>loan</strong> losses 8.8 -2.3 6.5 0.3<br />
Specific allowance for <strong>loan</strong> losses -7.8 0.2 -7.5 -1.0<br />
Major fac<strong>to</strong>rs <strong>of</strong> change (1HFY2009)<br />
Written <strong>of</strong>f <strong>and</strong> losses on sales <strong>of</strong> <strong>loan</strong>s -4.1 -2.8 -7.0 -2.4 Sales <strong>of</strong> corporate <strong>loan</strong>s -2.3<br />
Net gains on sales <strong>of</strong> s<strong>to</strong>cks <strong>and</strong> other securities -0.1 -13.6 -13.7 -0.6<br />
Losses on sale <strong>of</strong> s<strong>to</strong>cks <strong>and</strong> other securities -0.1 - -0.1 -<br />
Losses on devaluation <strong>of</strong> s<strong>to</strong>cks <strong>and</strong> other securities - -13.6 -13.6 -0.6 CLO equities -0.6<br />
Others -6.7 -44.5 -51.2 -4.7<br />
Allowance for contingencies - -0.1 -0.1 -<br />
Impairment loss related <strong>to</strong><br />
overseas asset-backed securities<br />
-6.7 -44.3 -51.1 -4.7<br />
Losses on sales -3.7 0.1 -3.5 -0.8 Asset-backed securities -0.8<br />
Write-<strong>of</strong>fs -2.9 -44.5 -47.5 -3.8 Asset-backed securities -3.8<br />
Total -10.0 -63.1 -73.1 -8.5<br />
Asset-backed<br />
Securities<br />
impairment<br />
-4.5<br />
9
Mig<strong>ratio</strong>n analysis <strong>and</strong> Non-performing <strong>loan</strong>s (NPL) by industry<br />
NPL volume increased, mainly due <strong>to</strong> the downgrades <strong>of</strong> <strong>loan</strong>s in some industries from special mention<br />
category <strong>to</strong> doubtful category<br />
Loans <strong>to</strong> special mention deb<strong>to</strong>rs (excluding <strong>loan</strong>s <strong>to</strong> subst<strong>and</strong>ard deb<strong>to</strong>rs) decreased by 224.0 billion<br />
yen ffrom 2009/3, 2009/3 owing i t<strong>to</strong> th the repayments t <strong>and</strong> d upgrades d especially i ll iin th the fi financial i l iindustry, d t as well ll as<br />
the downgrades<br />
(non-consolidated; banking a/c <strong>and</strong> principal guaranteed trust a/c combined)><br />
(in billions <strong>of</strong> Yen)<br />
Mar. 2009 Sep. 2009 Change<br />
Downgrade<br />
(+)<br />
Downgrade<br />
(-)<br />
Bankrupt / practically bankrupt 28.0 26.1 -1.9 2.5 -<br />
Upgrade<br />
(+)<br />
-<br />
Upgrade<br />
(-)<br />
Repayment,<br />
etc.<br />
-0.5 -3.9<br />
Doubtful 73.7 242.2 168.5 (*1) ( ) 202.9 -0.3 0.4 (*2) ( ) -19.1 -15.3<br />
Loans <strong>to</strong> subst<strong>and</strong>ard deb<strong>to</strong>rs 27.9 51.8 23.9 10.5 -0.8 18.7 -2.3 -2.2<br />
Loans <strong>to</strong> special mention deb<strong>to</strong>rs<br />
(excluding <strong>loan</strong>s <strong>to</strong> subst<strong>and</strong>ard deb<strong>to</strong>rs)<br />
832.1 608.1 -224.0 (*4) 72.7 (*5) -213.7 2.6 (*6) -42.8 -42.8<br />
<br />
(non-consolidated; banking a/c <strong>and</strong> principal guaranteed trust a/c combined)<br />
(in billions <strong>of</strong> Yen)<br />
Mar. 2009 Sep. 2009 Change fm<br />
Mar. 2009<br />
Domestic Branches<br />
(excluding <strong>of</strong>fshore)<br />
112 112.2 2 303 303.6 6 191 191.5 5<br />
(in billions <strong>of</strong> yen)<br />
Manufacturing<br />
Construction<br />
5.6<br />
6.4<br />
6.2<br />
5.0<br />
0.6<br />
-1.4<br />
(*1) Major fac<strong>to</strong>r : Finance <strong>and</strong> insurance 144.8, Transportation,<br />
postal service 39.0, <strong>and</strong> Real estate 12.5 in left chart.<br />
Communication 27.0 23.2 -3.8 (*2)(*3) Upgrade from doubtful <strong>loan</strong>s <strong>to</strong> subst<strong>and</strong>ard <strong>loan</strong>s<br />
Transportation, postal service<br />
Finance <strong>and</strong> insurance<br />
Real estate<br />
Overseas branches<br />
<strong>and</strong> <strong>of</strong>fshore<br />
Total<br />
-<br />
0.1<br />
52.6<br />
4.3<br />
116.4<br />
39.0<br />
144.9<br />
65.0<br />
5.5<br />
309.2<br />
39.0<br />
144.8<br />
12.5<br />
1.2<br />
192.7<br />
(*4) ( ) Manufacturing a u actu g appx. app 22.0, 0, Finance a ce a<strong>and</strong> d insurance su a ce app appx. 17.0, 0,<br />
Real estate appx. 10.0, Overseas appx. 10.0, etc.<br />
(*5) Correspond <strong>to</strong> (1*)<br />
(*6) Finance <strong>and</strong> insurance appx. -44.0, Real estate appx. -24.0,<br />
Construction appx. -5.0, Transportation, postal service appx.<br />
-4.0, etc.<br />
(*3)<br />
10
Non-performing <strong>loan</strong>s: Collaterals <strong>and</strong> allowances<br />
NPL volume increased by 192.7 billion yen from 2009/3, mainly due <strong>to</strong> the increase in doubtful <strong>loan</strong>s,<br />
while <strong>loan</strong>s <strong>to</strong> special mention deb<strong>to</strong>rs decreased by 226.2 billion yen.<br />
As <strong>to</strong> doubtful <strong>loan</strong>s, we conservatively evaluated collaterals, <strong>and</strong> set aside high reserve <strong>ratio</strong> <strong>of</strong> 88%<br />
against i t unsecured d portion ti<br />
<br />
(non-consolidated; banking a/c <strong>and</strong> principal guaranteed trust a/c combined)<br />
(in billions <strong>of</strong> Yen)<br />
Assets classified under the Financial<br />
Reconstruction eco s uc o Law a<br />
Mar. 2009 Sep. 2009<br />
Change fm<br />
Mar. 2009<br />
116.4 309.2 192.7<br />
(Ratio <strong>to</strong> <strong>to</strong>tal <strong>loan</strong> <strong>balance</strong>) (0.9%) (2.5%) (1.6%)<br />
Loans in bankrupt <strong>and</strong> practically bankrupt<br />
28.0 26.1 -1.9<br />
Doubtful <strong>loan</strong>s 73.7 242.2<br />
Subst<strong>and</strong>ard <strong>loan</strong>s 14.7 40.9<br />
168.5<br />
26.1<br />
Loans <strong>to</strong> subst<strong>and</strong>ard deb<strong>to</strong>rs (27.9) ( ) (51.8) ( ) (23.9) ( )<br />
Special mention (exc. Subst<strong>and</strong>ard) 845.3 619.1 -226.2<br />
Total <strong>loan</strong> <strong>balance</strong> 12,479.8 12,268.6 -211.2<br />
Collateral / Reserve<br />
Reserve <strong>ratio</strong> (*1)<br />
(Coverage <strong>ratio</strong> (*2) )<br />
Specific allowance for <strong>loan</strong> losses 10.3 100%<br />
Collateral value 15.8 (100%)<br />
Uncovered 9.5<br />
88%<br />
Specific allowance for <strong>loan</strong> losses 71.3<br />
Collateral value 161.4 (96%)<br />
Uncovered 20 20.8 8<br />
20%<br />
General allowance for <strong>loan</strong> losses 5.4<br />
Collateral value 14.6 (49%)<br />
(*1) Reserve <strong>ratio</strong> = allowance for <strong>loan</strong> losses / ( <strong>loan</strong> <strong>balance</strong> – collateral value )<br />
(*2) Coverage C <strong>ratio</strong> ti = ( collateral ll t l value l + allowance ll for f <strong>loan</strong> l losses l ) / <strong>loan</strong> l <strong>balance</strong>) b l )<br />
11
Securities portfolio <strong>and</strong> interest rate risk<br />
Unrealized gain on held-<strong>to</strong>-maturity debt securities increased by 36.9 billion yen from 2009/3 <strong>to</strong> 41.4 billion yen,<br />
mainly due <strong>to</strong> improved valuations <strong>of</strong> overseas asset-backed securities (-44.7 billion yen including the unamortized<br />
<strong>balance</strong> <strong>of</strong> unrealized loss on securities resulting from reclassification in the previous fiscal year)<br />
Valuation difference <strong>of</strong> available-for-sale securities increased by y 148.2 billion yen y from 2009/3 <strong>to</strong> 79.1 billion yen, y<br />
mainly due <strong>to</strong> improved unrealized gain on s<strong>to</strong>cks<br />
<br />
Market value Book value<br />
Unrealized gains/losses<br />
(in billions <strong>of</strong> Yen) Sep-09 Mar-09 Change Sep-09 Mar-09 Change Sep-09 Mar-09 Change<br />
Held-<strong>to</strong>-maturity debt securities 601 601.2 2 661 661.6 6 -60 -60.3 3 559 559.8 8 657 657.2 2 -97 -97.3 3 41 41.4 4 44 4.4 36 36.9 9<br />
Japanese Government Bonds,<br />
Corporate Bonds<br />
283.3 363.3 -80.0 274.6 356.0 -81.3 8.6 7.3 1.3<br />
Others (Foreign bonds) (Note1,2) 317.9 298.2 19.6 285.1 301.1 -16.0 32.7 -2.8 35.6<br />
(Note1) Unamortized <strong>balance</strong> <strong>of</strong> unrealized loss on asset-backed securities which were reclassified from "Available-for-sale securities" <strong>to</strong> "Held-<strong>to</strong>-maturity debt securities"<br />
(2009/9: -86.1 bn yen, 2009/3: -95.5 bn yen)<br />
(Note2) Effect on book value <strong>of</strong> applying theoretical price <strong>to</strong> overseas asset-backed securities; "Others (Foreign bonds)" (2009/9: 7.7 bn yen, 2009/3: 24.4 bn yen)<br />
Book value<br />
Cost Valuation difference<br />
(in billions <strong>of</strong> Yen) Sep-09 Mar-09 Change Sep-09 Mar-09 Change Sep-09 Mar-09 Change<br />
Available-for-sale securities 3,729.3 4,030.8 -301.5 3,650.1 4,099.8 -449.7 79.1 -69.0 148.2<br />
S<strong>to</strong>cks 491.1 408.2 82.9 422.5 432.6 -10.1 68.6 -24.4 93.1<br />
Japanese Government Bonds,<br />
Corporate Bonds (Note 2)<br />
1,378.0 1,561.1 -183.1 1,352.1 1,540.8 -188.6 25.8 20.3 5.5<br />
Foreign bonds <strong>and</strong> others (Note1) 1,860.1 2,061.4 -201.3 1,875.4 2,126.3 -250.9 -15.3 -64.9 49.5<br />
(Note1) Effect on book value <strong>of</strong> applying theoretical price ; "JGB" (2009/9: 13.5 bn yen, 2009/3: 14.2 bn yen), "Foreign bonds <strong>and</strong> others" (2009/9: 0.9 bn yen,<br />
2009/3: 3.9 bn yen)<br />
<br />
Cost Unrealized gains/losses 10BPV<br />
(in billions <strong>of</strong> Yen) Sep-09 Mar-09 Change Sep-09 Mar-09 Change Sep-09 Mar-09 Change<br />
(in billions <strong>of</strong> Yen) Sep-09 Mar-09 Change<br />
JPY 1,606.6 1,838.5 -231.9 34.6 27.9 6.6 4.2 6.4 -2.2 Total interest rate risk 77.9 137.8 -59.9<br />
Oth 945 5 11046 159 0 05 99 10 4 37 43 06<br />
(*2)<br />
Other 945.5 1,104.6 -159.0 -0.5 9.9 -10.4 3.7 4.3 -0.6<br />
JPY 25.9 74.6 -48.7<br />
USD 551.1 577.0 -25.8 -4.9 3.2 -8.1 2.4 2.4 - Tier I +Tier II 1,901.5 1,745.4 156.1<br />
EUR, etc. 394.3 527.5 -133.1 4.4 6.7 -2.3 1.5 1.9 -0.4 Outlier <strong>ratio</strong> 4.10% 7.90% -3.80%<br />
(*1) Managerial reporting basis; Held-<strong>to</strong>-maturity debt securities <strong>and</strong> Available-for-sale securities are combined.<br />
(*2) Exclude Japanese bonds which are hedged individually by asset swaps (<strong>balance</strong> as <strong>of</strong> 2009/9: 309.0 billion<br />
yen 2009/3: 247 5 billion yen)<br />
(*3) Regarding the explanation <strong>of</strong> the calculation method,<br />
please p refer <strong>to</strong> the notes in ppage g 14 <strong>of</strong> our Explana<strong>to</strong>ry p y<br />
Material for the 2nd yen, 2009/3: 247.5 billion yen)<br />
quarter <strong>of</strong> FY2009.<br />
12
中表紙<br />
Status <strong>of</strong> capital<br />
13
Regula<strong>to</strong>ry capital<br />
Due <strong>to</strong> the increase in Tier I capital <strong>and</strong> the large decrease in risk-weighted assets (-1.1 trillion yen), Tier I capital <strong>ratio</strong><br />
improved by 2.25% from 2009/3 <strong>to</strong> 9.88%, which is over 9% even after taking in<strong>to</strong> account the impact <strong>of</strong> “goodwill" <strong>of</strong> Nikko<br />
Asset Management (Nikko AM) (appx. -0.6%) which was consolidated on Oc<strong>to</strong>ber 1, 2009.<br />
The decrease in risk-weighted assets was due <strong>to</strong> the decrease in the <strong>loan</strong>s <strong>to</strong> large-lot special mention deb<strong>to</strong>rs, the decrease<br />
in amount <strong>of</strong> market related risk, <strong>and</strong> revision <strong>of</strong> risk-weights <strong>of</strong> sovereign bonds<br />
<br />
Sep-09 Mar-09<br />
(in billions <strong>of</strong> Yen) (Preliminary) (Actual)<br />
Change<br />
Total qualifying capital 1,818.9 1,682.8 136.0 Major fac<strong>to</strong>rs <strong>of</strong> change in capital from 2009/3<br />
Tier I<br />
Shareholders' equity<br />
1,268.7<br />
1,110.0<br />
1,061.8<br />
990.4<br />
206.9<br />
119.6<br />
(1) Shareholders’ equity: +119.6 billion yen<br />
Preferred shares issuance +109.0 billion yen<br />
Preferred shares<br />
Noncumulative preferred securities<br />
issued by overseas SPV<br />
Less: Goodwill equivalents<br />
Less: Unrealized loss on available-for-sale securities<br />
Less: (EL - Eligible provisions) x 50%<br />
Tier II<br />
45% <strong>of</strong> unrealized gain on available-for-sale<br />
securities<br />
109.0<br />
280.0<br />
102.7<br />
9.6<br />
25.3<br />
632.8<br />
-<br />
-<br />
280.0<br />
106.9<br />
109.6<br />
7.8<br />
683.6<br />
-<br />
109.0<br />
-<br />
-4.2<br />
-99.9<br />
17.4<br />
-50.7<br />
-<br />
(2) Unrealized loss on available-for-sale available for sale securities: -99 99.9 9 billion<br />
yen<br />
Decreased unrealized loss on available-for-sale securities,<br />
due <strong>to</strong> higher s<strong>to</strong>ck prices etc.<br />
(3) Subordinated debts: -49.8 billion yen<br />
Retirement <strong>of</strong> perpetual subordinated bonds ( (-250 250 million<br />
pounds), domestic subordinated bonds issuance (+55.0<br />
billion yen), redemption etc. (appx. -70.0 billion yen)<br />
Subordinated debts 623.7 673.6 -49.8<br />
Upper Tier II 207.8 292.7 -84.8 Major fac<strong>to</strong>rs <strong>of</strong> change in risk-weighted assets from 2009/3<br />
LLower Ti Tier II<br />
Less: Deduction (double gearing)<br />
BIS capital adequacy <strong>ratio</strong><br />
Tier I capital <strong>ratio</strong><br />
415 415.8 8<br />
82.6<br />
14.17%<br />
9.88%<br />
380 380.8 8<br />
62.5<br />
12.09%<br />
7.63%<br />
35 35.0 0<br />
20.1<br />
+2.08%<br />
+2.25%<br />
(1) Amount <strong>of</strong> credit risk-weighted assets: -0.91 trillion yen<br />
• Corporate, etc. -0.52 trillion yen<br />
(The decrease in <strong>loan</strong>s <strong>to</strong> large-lot special mention deb<strong>to</strong>rs<br />
(downgrades <strong>and</strong> repayments) -0.41 trillion yen)<br />
• Sovereign So e e g risk-weights s eg srevision e so (JGB, (JG , etc.) e c ) -0.18 0 8 trillion o ye yen<br />
• Purchased receivables <strong>and</strong> securitization -0.13 trillion yen<br />
Total risk-weighted assets<br />
Amount <strong>of</strong> credit risk-weighted assets<br />
12,834.3<br />
12,029.9<br />
13,911.4<br />
12,943.8<br />
-1,077.1<br />
-913.9<br />
(2) Amount <strong>of</strong> market risk equivalents: -0.15 trillion yen<br />
Decreased high interest rate volatility + reduced position<br />
Amount <strong>of</strong> market risk equivalents 131.6 284.7 -153.1<br />
Amount <strong>of</strong> ope<strong>ratio</strong>nal p risk equivalents q 672.7 682.8 -10.0 10.0<br />
14
Quality <strong>and</strong> quantity <strong>of</strong> capital, reduction <strong>of</strong> shareholding risk<br />
Consolidated core Tier I capital <strong>ratio</strong> is 6.85%, which is above 6% even after taking in<strong>to</strong> account the impact <strong>of</strong><br />
"goodwill" <strong>of</strong> Nikko AM (appx. -0.6%)<br />
�Considering the relatively stable risk-weighted assets (FIRB Approach), we have a relatively strong<br />
position p in terms <strong>of</strong> <strong>to</strong>lerance for risk<br />
The leverage <strong>ratio</strong> (consolidated <strong>to</strong>tal assets / consolidated Tier I capital) is at a relatively low level among<br />
major banks. Though the details <strong>of</strong> new regulations are undecided, their introduction is expected <strong>to</strong> have a<br />
relatively limited impact<br />
Cost <strong>of</strong> s<strong>to</strong>ck holdings (422.5 billion yen) represents 33.3% <strong>of</strong> Tier I capital, <strong>and</strong> we will continue <strong>to</strong> work on its<br />
ffurther th reduction d ti in i the th 2HFY2009 <strong>and</strong> d llater t<br />
(Preliminary)<br />
Sep-09 Mar-09<br />
(in billions <strong>of</strong> Yen) (Preliminary) (Actual)<br />
Change<br />
Tier I capital 1,268.7 1,061.8 206.9<br />
Preferred shares 109.0 - 109.0<br />
Noncumulative preferred securities<br />
280.0 280.0 -<br />
NNet t deferred d f d ttax assets t 132 132.3 3 207 207.7 7 -75.4 75 4<br />
(Ratio <strong>to</strong> Tier I capital) (10.4%) (19.6%) (-9.2%)<br />
Core Tier I capital 879.7 781.8 97.9<br />
Core Tier I capital (excl. DTA) 747.4 574.1 173.3<br />
Total risk-weighted assets 12,834.3 13,911.4 -1,077.1<br />
Tier I capital <strong>ratio</strong> 9.88% 7.63% +2.25%<br />
Core Tier I capital <strong>ratio</strong> 6.85% 5.61% +1.24%<br />
<br />
STB<br />
Mega-bank<br />
A B C<br />
Leverage <strong>ratio</strong>* (Times) 16.6 22.8 22.1 30.2<br />
(Ref.) Risk-weighted assets / Total assets (%)<br />
*Leverage <strong>ratio</strong> = Total assets / Tier I capital<br />
60.8 48.0 47.1 37.9<br />
<br />
(in billions <strong>of</strong> Yen) Sep-09 Mar-09 Change<br />
Cost (a) 422.5 432.6 -10.1<br />
(valuation difference) (68.6) (-24.4) (93.1)<br />
Tier I capital (b) 1,268.7 1,061.8 206.9<br />
Core Tier I capital <strong>ratio</strong> (excl. DTA) 5.88% 4.18% +1.70% Ratio <strong>to</strong> Tier I capital (a) / (b) 33.3% 40.7% -7.4%<br />
Core Tier I capital <strong>ratio</strong> = Core Tier I capital / Total risk-weighted assets<br />
(Core Tier I capital = Tier I capital - Preferred shares - preferred securities)<br />
Core Tier I capital <strong>ratio</strong> (excl. DTA) = Core Tier I capital (excl. DTA) / (Total risk-weighted assets-Net differed tax assets)<br />
(Core Tier I capital (excl. DTA)= DTA) Core Tier I capital - Net deferred tax assets)<br />
15
中表紙<br />
Forecast for FY2009<br />
16
Forecast for FY2009<br />
Net business pr<strong>of</strong>it is forecasted <strong>to</strong> be 175.0 billion yen on consolidated basis (unchanged) <strong>and</strong><br />
155.0 billion yen on non-consolidated basis (increased by 10 billion yen from the previous forecast),<br />
based on the performance in the 1HFY2009<br />
Net income is forecasted <strong>to</strong> be 45.0 billion yen on consolidated basis (unchanged), <strong>and</strong> 45.0 billion<br />
yen on non-consolidated basis (increased by 5.0 billion yen from the previous forecast), due <strong>to</strong> the<br />
review <strong>of</strong> non-consolidated <strong>to</strong>tal substantial credit costs <strong>and</strong> those <strong>of</strong> group companies etc.<br />
FY2009<br />
<br />
FY2009<br />
1H 2H (Forecast) Change (Previous forecast)<br />
(in billions <strong>of</strong> Yen) (Actual) (Forecast) (A) (A) - (B)<br />
(B)<br />
Net business pr<strong>of</strong>it before credit costs 87 87.7 7 87 87.3 3 175 175.0 0 - 175 175.0 0<br />
(Total substantial credit costs) (-40.8) (-29.2) (-70.0) (10.0) (-80.0)<br />
Ordinary pr<strong>of</strong>it 33.4 46.6 80.0 -5.0 85.0<br />
Net income 19.2 25.8 45.0 -<br />
<br />
Net business pr<strong>of</strong>it before credit costs 81.6 73.4 155.0 10.0 145.0<br />
Total credit costs -27.2 -17.8 -45.0 5.0 -50.0<br />
(Total ( substantial credit costs) ) (-32.7) ( ) (-22.3) ( ) (-55.0) ( ) (15.0) ( ) (-70.0) ( )<br />
(Domestic) (-24.1) (-15.9) (-40.0) (10.0) (-50.0)<br />
(International) (-8.5) (-6.5) (-15.0) (5.0) (-20.0)<br />
Other non-recurring pr<strong>of</strong>it -22.7 -12.3 -35.0 -5.0 -30.0<br />
Ordinary pr<strong>of</strong>it 31 31.1 1 43 43.9 9 75 75.0 0 10 10.0 0 65 65.0 0<br />
Net income 19.3 25.7 45.0 5.0 40.0<br />
Full year dividend per share (Yen) 5 5 10 -<br />
Consolidated dividend payout <strong>ratio</strong> - - 39.5% 2.3% 37.2%<br />
45.0<br />
10<br />
17
中表紙<br />
Strategy <strong>and</strong> performance <strong>of</strong><br />
group g p companies p<br />
18
Acquisition <strong>of</strong> Nikko AM<br />
– Drastic reinforcement <strong>of</strong> investment sales strategy<br />
<br />
Tie-up Tie up with Nikko AM<br />
Tie-up with<br />
fiduciary y business<br />
Reinforce sales<br />
personnel<br />
(1) Extensive product lineup & highly estimated asset management capabilities (*)<br />
(2) Strong marketing support capabilities *)<br />
( ) g g pp p<br />
(3) Significant product marketing <strong>and</strong> development capabilities (*)<br />
Take advantage <strong>of</strong> our consulting know-how for institutional inves<strong>to</strong>rs<br />
(1) Deploy “core + satellite” sales model<br />
(2) Portfolio consulting etc.<br />
Plan <strong>to</strong> increase sales staff by about 30 in 2HFY2009<br />
(focused on front-line sales managers)<br />
<br />
(1) Sales <strong>of</strong> exclusive mutual funds for us<br />
• Two <strong>of</strong> exclusive products p for us have been launched in Oct.2009<br />
“Sumishin Wallet <strong>of</strong> the World” & “Natural Resources Equity Fund Currency<br />
Selection Series”<br />
(2) Utilize training function <strong>of</strong> Nikko AM<br />
• Execute training g program g for our sales staff at the Nikko AM’s “Fund Academy” y<br />
(3) Sales promotion support by exclusive staff for us<br />
• Individual sales support for all our branches by 8 exclusive staff for us (including<br />
joint sales visits <strong>and</strong> creating proposal documents)<br />
(4) Hold joint seminars on asset management<br />
• Plan <strong>to</strong> hold proposal-type seminars 90 times for 4,000 clients at our company’s<br />
57 locations<br />
(*) Fund information survey by R&I<br />
Exp<strong>and</strong> client base<br />
Develop clients with new pr<strong>of</strong>iles<br />
Exp<strong>and</strong> sales volume<br />
In 2HFY2009, ,p plan <strong>to</strong><br />
double the investment trust<br />
sales <strong>of</strong> 1HFY2009<br />
1HFY2009 results<br />
87.2 billion yen y<br />
EEvaluation l ti <strong>of</strong> f asset t managementt capability bilit NNo.2 2<br />
Evaluation <strong>of</strong> service <strong>and</strong> support system No.2<br />
Evaluation <strong>of</strong> product development capability NNo.1 1<br />
Notes: “Fund Information” issued by R&I on Mar.9, 2009<br />
as <strong>to</strong> cus<strong>to</strong>mer satisfaction survey <strong>of</strong> investment trust<br />
companies<br />
19
(For reference) Nikko AM<br />
<br />
Due <strong>to</strong> the recovery <strong>of</strong> market conditions, assets under management increased by about 1.1 trillion yen from 2009/3<br />
<strong>and</strong> interim net income in 1HFY2009 was 1.4 billion yen y as pplanned<br />
(in trillion yen)<br />
Mar. 2009 Sep. 2009 Change<br />
Retail inves<strong>to</strong>rs 5.90 6.71 0.81<br />
Domestic institutional inves<strong>to</strong>rs 239 2.39 241 2.41 002 0.02<br />
International institutional inves<strong>to</strong>rs 0.52 0.81 0.29<br />
Total AUM 8.81 9.94 1.13<br />
(in billions <strong>of</strong> y en)<br />
<br />
� Acquisition price: 112.4 billion yen<br />
� Enterprise value: 87.7 billion yen (acquisition price less excess cash <strong>of</strong> 24.7 billion yen)<br />
�� Goodwill: Appx Appx. 76 76.0 0 billion yen<br />
⇒ Assume straight-line amortization over a period <strong>of</strong> 15-20 years from 2HFY2009<br />
<br />
AUM (in trillions <strong>of</strong> yen )<br />
Net income (in billions <strong>of</strong> yen)<br />
FY2008(actual) FY2009(plan) FY2011(plan)<br />
1HFY2009(actual)<br />
8.8 9.9 9.0 - 11.0 11.0 - 15.0<br />
3.6 1.4 4.0 - 6.0 8.0 - 12.0<br />
1HFY2009<br />
Change<br />
1HFY2008<br />
Net business pr<strong>of</strong>it 17 1.7 -2.2 22 39 3.9<br />
Ordinary pr<strong>of</strong>it 2.2 -2.8 4.9<br />
Net income 1.4 -1.6 3.0<br />
(Note) This forecast does not reflect an effect <strong>of</strong> on-time costs accompanied by the<br />
acquisition. These costs have been already adjusted in calculating the acquisition<br />
price, <strong>and</strong> will not have any effect on STB’s consolidated earnings.<br />
20
Integ<strong>ratio</strong>n <strong>of</strong> two leasing companies<br />
Plan <strong>to</strong> merge Sumishin Matsushita Financial Services Co., Ltd. <strong>and</strong> STB Leasing Co., Ltd. on April 1, 2010<br />
(planned name <strong>of</strong> the merged company is Sumishin Panasonic Financial Services Co., Ltd.)<br />
Reallocate managerial resources in<strong>to</strong> the promising business areas so as <strong>to</strong> solidify the foundations <strong>of</strong> its<br />
earnings earnings, in addition <strong>to</strong> the streamlining measures executed in FY2008<br />
<br />
(1) Reallocate staff by integrating HQ <strong>and</strong> sales units,<br />
thereby th b putting tti managerial i l resources in<strong>to</strong> i t promising i i<br />
businesses<br />
(2) By merging <strong>of</strong> individual characteristics <strong>of</strong> bank <strong>and</strong><br />
manufacturer, share <strong>and</strong> utilize both companies’ know-<br />
how <strong>and</strong> business infrastructures<br />
(3) Maintain close tie-up with Panasonic Group<br />
Promising <strong>and</strong> high pr<strong>of</strong>itability business areas<br />
(1) Dealer leasing (small-amount vendor leasing)<br />
(2) Credit, <strong>and</strong> housing related <strong>loan</strong>s through tie-up<br />
with Panasonic Group (including solar <strong>loan</strong>s for<br />
home solar power gene<strong>ratio</strong>n)<br />
Sumi<strong>to</strong>mo Trust Panasonic<br />
85% <strong>of</strong> shares<br />
(in billions <strong>of</strong> y en)<br />
Sumishin Panasonic Financial<br />
Services<br />
<br />
FY2008<br />
(actual)<br />
15% <strong>of</strong> shares<br />
An affiliated company <strong>of</strong><br />
Panasonic<br />
FY2009<br />
(plan)<br />
FY2011<br />
(plan)<br />
Transaction volume 502.5 465.6 470.0 - 480.0<br />
User leasing 264.8 257.7 255.0 - 260.0<br />
Dealer leasing 61.5 73.6 75.0 - 80.0<br />
Credit 49.8 51.6 50.0 - 55.0<br />
CCard d 38 38.7 7 40 40.4 4 45 45.0 0 - 50 50.0 0<br />
Housing related <strong>loan</strong> 29.8 26.6 25.0 - 30.0<br />
Others 57.6 15.7 10.0 - 15.0<br />
Net business pr<strong>of</strong>it 7.5 6.6 10.0 - 11.0<br />
Personnel / Non-personnel<br />
expenses exc.tax<br />
(22.0) (20.5) (21.0 - 22.0)<br />
Net income 4.8 5.2 6.0 - 6.5<br />
21
Financial related business in group companies 1. Leasing<br />
STB Leasing Group (STBL): Net income decreased by 0.2 billion yen from 1HFY2008 <strong>to</strong> 0.8 billion yen, mainly due <strong>to</strong> the<br />
increase in <strong>to</strong>tal substantial credit costs (-0.9 billion yen)<br />
Sumishin Matsushita Financial Services (SMFC): Net income increased by 0.9 billion yen from 1HFY2008 <strong>to</strong> 1.7 billion yen,<br />
mainly due <strong>to</strong> the expense reduction by promoting streamlining (0.9 billion yen)<br />
Two companies’ combined NPL <strong>ratio</strong> s<strong>to</strong>od at appx. 2.2% (*) . STBL’s <strong>loan</strong>s are focused on ship finance, <strong>and</strong> SMFC’s <strong>loan</strong>s are<br />
focused on <strong>loan</strong>s <strong>to</strong> individual. (*) Managerial reporting basis: Include Leasing assets which are not the subjects <strong>of</strong> NPL<br />
<br />
(in billions <strong>of</strong><br />
600<br />
450<br />
300<br />
150<br />
yen) Loans Leasing/installment<br />
0<br />
479.5 497.9 522.2 503.8<br />
45.8 58.5 61.5 62.2<br />
433.6 439.3 460.6 441.5<br />
(in billions<br />
<strong>of</strong> yen)<br />
600<br />
450<br />
Loans Credit (Retail) Leasing/installment<br />
574.5 578.8 560.0 536.5<br />
55.2<br />
92 92.2 2<br />
55.0<br />
95 95.4 4<br />
64.8<br />
95 95.4 4<br />
59.9<br />
94 94.9 9<br />
427.0 428.4 399.8 381.5<br />
0<br />
2007/3 2008/3 2009/3 2009/9 2007/3 2008/3 2009/3 2009/9<br />
(in billions <strong>of</strong> Yen)<br />
1HFY2009 1HFY2008<br />
Change<br />
Net business pr<strong>of</strong>it 1.4 -0.2 1.6<br />
Leasing pr<strong>of</strong>it 6.8 0.5 6.3<br />
Leasing expense -2.5 0.0 -2.5<br />
G&A expense -5.0 50 -0.4 04 -4.6 46<br />
Ordinary pr<strong>of</strong>it 1.2 -0.5 1.8<br />
Net income 0.8 -0.2 1.0<br />
Total substantial credit costs -2.9 -0.9 -1.9<br />
300<br />
150<br />
1HFY2009 1HFY2008<br />
(in billions <strong>of</strong> Yen) Change<br />
Net business pr<strong>of</strong>it 1.0 0.4 0.5<br />
Leasing pr<strong>of</strong>it 7.9 0.0 7.8<br />
Leasing expense -2.4 0.2 -2.7<br />
G&A expense -7.3 73 09 0.9 -8.2 82<br />
Ordinary pr<strong>of</strong>it 1.1 0.4 0.7<br />
Net income 1.7 0.9 0.7<br />
Total substantial credit costs -22.0 0 -00.1 1 -11.9 9<br />
22
Financial related business in group companies<br />
2. Real estate-related finance, mortgage <strong>loan</strong>s<br />
Total credit costs <strong>of</strong> First Credit decreased from 1HFY2008 because the effects <strong>of</strong> declining collateral<br />
values peaked out, <strong>and</strong> thus net income turned out <strong>to</strong> be positive (1.1 billion yen)<br />
Life Housing Loan had 2.2 billion yen <strong>of</strong> net income, mainly due <strong>to</strong> 2.0 billion yen <strong>of</strong> extraordinary income<br />
by securitization<br />
<br />
(in billions <strong>of</strong> yen )<br />
200<br />
150<br />
100<br />
50<br />
0<br />
Loans<br />
153 153.5 5<br />
194.9<br />
164.0<br />
140.4<br />
2007/3 2008/3 2009/3 2009/9<br />
(in billions <strong>of</strong><br />
yen) )<br />
150<br />
100<br />
50<br />
0<br />
123.0<br />
Loans (before securitization) Loans<br />
142.8<br />
164.0<br />
95.9 118.4 132.3 141.8<br />
2007/3 2008/3 2009/3 2009/9<br />
1HFY2009 1HFY2008<br />
1HFY2009 1HFY2008<br />
(i (in billi billions <strong>of</strong> f Y Yen) ) Ch Change<br />
(i (in billi billions <strong>of</strong> f Y Yen) ) Ch Change<br />
Net business pr<strong>of</strong>it 1.4 5.0 -3.5 Net business pr<strong>of</strong>it 1.7 -0.0 1.7<br />
Loan pr<strong>of</strong>it 4.3 -2.4 6.7 Loan pr<strong>of</strong>it 2.3 0.0 2.3<br />
G&A expense -2.8 2.8 7.4 -10.2 10.2 G&A expense -0.6 0.6 -0.0 0.0 -0.6 0.6<br />
Ordinary pr<strong>of</strong>it 1.4 5.0 -3.5 Ordinary pr<strong>of</strong>it 1.7 0.0 1.7<br />
Net income 1.1 5.2 -4.1 Net income 2.2 1.2 1.0<br />
Total substantial credit costs -1.1 6.9 -8.1 Total substantial credit costs -0.0 -0.0 -0.0<br />
173.4<br />
23
Financial related business in group companies 3. Internet banking<br />
Net income <strong>of</strong> SBI Sumishin Net Bank turned out <strong>to</strong> be positive (1.2 billion yen) in just two years from the<br />
start-up <strong>of</strong> the business in Sep. 2007<br />
SBI Sumishin Net Bank has successfully exp<strong>and</strong>ed cus<strong>to</strong>mer base <strong>to</strong> 560 thous<strong>and</strong> accounts, deposits<br />
<strong>to</strong> over 800 billion yen <strong>and</strong> execution <strong>of</strong> residential mortgage <strong>loan</strong>s <strong>to</strong> over 300 billion yen<br />
<br />
<br />
2009/9 Change 2009/3<br />
Number <strong>of</strong> account (thous<strong>and</strong>s) ( ) 560 150 410<br />
Deposits (in billions <strong>of</strong> Yen) 827.3 197.4 629.9<br />
Loans (in billions <strong>of</strong> Yen) 327.3 107.6 219.7<br />
1HFY2009<br />
(in ( billions <strong>of</strong> Yen) ) Change g<br />
1HFY2008<br />
With SBI SECURITIES account<br />
Without SBI SECURITIES account<br />
61%<br />
39%<br />
11.95 95 million accounts<br />
(as <strong>of</strong> 2009/9)<br />
Net business pr<strong>of</strong>it 1.3 4.3 -3.0<br />
Ordinary pr<strong>of</strong>it 1.2 4.3 -3.0<br />
Net income 1.2 4.3 -3.0 <br />
-Hybrid deposit: Outst<strong>and</strong>ing <strong>balance</strong> is reflected <strong>to</strong> the SBI SECURITIES’s<br />
account <strong>to</strong> enhance the availability <strong>of</strong> purchasing securities<br />
-Real time settlement service: Au<strong>to</strong>mated deposit <strong>and</strong> withdrawal service <strong>of</strong><br />
securities selling <strong>and</strong> purchasing amount<br />
-Aggregation service: View format <strong>of</strong> SBI Sumishin Net Bank’s <strong>and</strong> SBI<br />
SECURITIES’s account <strong>balance</strong>s<br />
24
中表紙<br />
Credit portfolio<br />
25
<strong>Balance</strong> <strong>of</strong> credit portfolio (non-consolidated)<br />
In accordance with the credit portfolio restructuring policy in the new midterm management plan, while reducing market-based<br />
<strong>loan</strong> (international), promote the shift <strong>to</strong>wards corporate <strong>loan</strong>s (Japanese) including those <strong>to</strong> overseas Japanese companies<br />
<strong>and</strong> <strong>to</strong>wards <strong>loan</strong>s <strong>to</strong> individual<br />
Corporate <strong>loan</strong>s (Japanese) decreased by 0.08 trillion yen, mainly due <strong>to</strong> the decrease in <strong>loan</strong>s <strong>to</strong> nonbanks (-0.06 trillion yen)<br />
Due <strong>to</strong> the recovery <strong>of</strong> CP <strong>and</strong> corporate bond markets, dem<strong>and</strong> for funding fell back, especially for short term funding<br />
<br />
(in trillions <strong>of</strong> Yen)<br />
Mar-09 Sep-09 Major fac<strong>to</strong>rs <strong>of</strong> change<br />
CChange ffrom<br />
Mar-09<br />
Credit portfolio 13.50 13.20 - 0.29 Loans -0.17, Securities -0.11<br />
Loans <strong>to</strong> individual 2.04 2.10 0.06 Housing g <strong>loan</strong> +0.04 ( (1.44 -->1.48) )<br />
Market-based <strong>loan</strong><br />
(international)<br />
Market-based <strong>loan</strong><br />
(domestic; exc. Real estate NRL)<br />
1.01 0.89 - 0.12<br />
065 0.65 059 0.59 -006 - 0.06<br />
Real estate NRL (inc. CMBS <strong>and</strong> <strong>loan</strong>s <strong>to</strong> REITs) 1.23 1.20 - 0.02<br />
(Real ( estate NRL) )<br />
(0.90) (0.88) (- 0.02)<br />
Securities -0.07 (0.70 -->0.63)<br />
Loans -0.04 (0.31 -->0.26)<br />
STB Group companies 0.55 0.49 - 0.06 First Credit -0.02, Leasing subsidiaries (2 companies) -0.02<br />
Corporate <strong>loan</strong> (Japanese) 7.99 7.90 - 0.08 Manufacturing +0.05 (1.81 -->1.87)<br />
(Japanese companies operated in<br />
overseas)<br />
(0.51) (0.60) (0.08) Real estate ±0.00 (0.62 -->0.62)<br />
Nonbank financial -0.06 (1.84 -->1.78)<br />
(*) Figures for each industries include not only for domestic corporate but also for Japanese companies operated in overseas. (Managerial accounting base)<br />
26
Overview <strong>of</strong> international credit investment 1. Available-for-sale securities<br />
Total <strong>balance</strong> decreased by 48.7 billion yen from 2009/3 <strong>to</strong> 329.5 billion yen (including 64.8 billion yen <strong>of</strong><br />
asset-backed securities): Sales -17.5 billion yen, redemption -16.6 billion yen, impairment -4.5 billion yen<br />
Unrealized loss improved by 39.1 billion yen from 2009/3 <strong>to</strong> -0.6 billion yen: Loss on sales was -3.1 billion<br />
yen, while gain on sales <strong>of</strong> impaired securities was 5.4 billion yen<br />
<br />
Cost (after impairment) Valuation difference<br />
North<br />
America<br />
Europe<br />
Change f rom<br />
Mar-09<br />
Change f rom<br />
Mar-09<br />
Credit ratings (*)<br />
% change AAA AA A BBB<br />
BB <strong>and</strong> below/<br />
(Non rating)<br />
(in billions <strong>of</strong> yen)<br />
Securities backed by non non-securitized securitized assets 63 63.3 3 80 8.0 53 53.0 0 -22.4 22 4 -2.1 21 10 10.2 2 -3.4% 34% 25 25.2 2 19 19.5 5 82 8.2 98 9.8 04 0.4 -3.3 33<br />
RMBS exc. Subprime related RMBS 21.9 -<br />
CMBS 18.7 -<br />
CARDS 5.1 5.1 -<br />
20.6 -2.7 -2.1 0.3 -9.7% 16.1 3.1 0.8 1.9 -<br />
18.7 -4.8 -2.3 3.4 -12.6% 4.5 10.9 2.2 1.0<br />
-0.4 1.0 1.7 21.0% -<br />
-<br />
Impariment<br />
CLO - - - -00.0 0 - - - - - - - - -<br />
Other ABS 12.3 1.9 9.5 -6.0 0.2 2.2 2.2% 4.0 2.0 4.7 1.2 0.3<br />
Subprime related RMBS -<br />
-<br />
-<br />
-4.7 -<br />
CDO mezzanine 1.2 0.8 0.4 -2.1 1.1<br />
0.6 -<br />
1.1 95.1% -<br />
Synthetic y CDO 3.8 0.1 3.7 -1.3 -0.1 0.6 -4.9% 0.4 2.9 0.3<br />
ABS-CDO 0.7 0.7 -<br />
CLO equities 0.6 0.6 0.0<br />
SIV Capital notes 0.0<br />
0.0<br />
-<br />
-2.2 -0.0 0.4 -2.1% -<br />
-0.7 1.7<br />
-0.4 -<br />
1.7 272.1% -<br />
0.1 0.0% -<br />
-<br />
-<br />
-<br />
-<br />
-<br />
5.1<br />
0.5 0.1 0.5 -<br />
-<br />
-<br />
-<br />
-<br />
-0.1<br />
-3.0<br />
0.1 -0.1<br />
0.5 0.0 0.1 0.0 -<br />
-<br />
-<br />
-<br />
-<br />
-<br />
-<br />
0.6 -0.6<br />
0.0 -0.4<br />
Asset-backed securities 64.8 9.5 53.0 -25.9 -0.4 12.5 -0.6% 25.2 20.0 8.2 10.0 1.2 -4.5<br />
Corporate bonds 264.7 21.2 108.8 -22.7 -0.2 26.6 -0.1% -<br />
Bonds issued by financial institutions 68.9 11.3 33.5 -8.0 -4.1 10.1 -6.0% -<br />
31.2 126.7 79.4 27.2 -<br />
27.7 35.8 5.3 -<br />
Securities with fair value 329.5 30.8 161.8 -48.7 -0.6 39.1 -0.2% 25.2 51.3 134.9 89.5 28.4 -4.5<br />
(*) On internal credit ratings basis (show n by rating marks based on the general correspondence <strong>to</strong> external credit ratings)<br />
-<br />
-<br />
-<br />
-<br />
-<br />
27
Overview <strong>of</strong> international credit investment<br />
2. Held-<strong>to</strong>-maturity debt securities, corporate <strong>loan</strong>s, etc.<br />
Cost <strong>of</strong> “Held-<strong>to</strong>-maturity debt securities” was 284.9 billion yen <strong>and</strong> unrealized gain was 32.7 billion yen (increased by 35.6<br />
billion yen from 2009/3)<br />
⇒ Unrealized loss including unamortized <strong>balance</strong> <strong>of</strong> unrealized loss at the time <strong>of</strong> reclassification was -53.4 billion yen<br />
(unrealized loss <strong>ratio</strong> -18 18.7%) 7%)<br />
Corporate <strong>loan</strong>s (non-Japanese) decreased by 49.3 billion yen from 2009/3 <strong>to</strong> 263.3 billion yen: Collection etc. -29.7 billion<br />
yen , sales -6.5 billion yen etc.<br />
<br />
North<br />
AAmerica i<br />
RMBS exc. Subprime related RMBS 104.5 -<br />
(in billions <strong>of</strong> yen)<br />
Cost Unrealized gains/losses<br />
Credit ratings (*1)<br />
Europe u ope<br />
change f rom<br />
change f rom<br />
MMar-09 09<br />
MMar-09 09<br />
104.5 -3.1 7.7 2.0 7.4% 48.2<br />
CARDS 47.9 42.6 5.3 -5.2 9.8 5.5 20.5% 16.6<br />
CLO (Corporate <strong>loan</strong>s) 129.3 91.1 38.1 -6.7 15.2 27.8 11.8% 0.9<br />
% change g AAA AA A BBB<br />
26.5<br />
4.2<br />
111.5<br />
17.9<br />
4.1<br />
14.3<br />
11.8<br />
22.8<br />
2.5<br />
BB <strong>and</strong> below/<br />
(N (Non rating) ti )<br />
Other ABSs 30 3.0 30 3.0 - -0 -0.8 8 -0 -0.0 0 01 0.1 -0 -0.2% 2% - 11 1.1 - 19 1.9 -<br />
Asset-backed securities 284.9 136.8 148.0 -16.0 32.7 35.6 11.5% 65.9<br />
(*1) On internal credit ratings basis (show n by rating marks based on the general correspondence <strong>to</strong> external credit ratings)<br />
(*2) Unamortized <strong>balance</strong> <strong>of</strong> unrealized loss on asset-backed securities w hich w ere reclassified <strong>to</strong> "Held-<strong>to</strong>-maturity debt securities" w as -86.1 billion yen as <strong>of</strong> 2009/9<br />
<br />
(in billions <strong>of</strong> y en)<br />
<strong>Balance</strong><br />
Change<br />
Internal credit ratings (*1)<br />
North America Europe f rom Mar-09 1-4 5-6 7-8<br />
Corporate <strong>loan</strong>s (*2) 263.3 133.8 56.9 -49.3 79.8 149.2 31.6<br />
(*1) Internal credit ratings: 1-6: Ordinary deb<strong>to</strong>rs, 7-8: Special mention deb<strong>to</strong>rs (excluding subst<strong>and</strong>ard deb<strong>to</strong>rs)<br />
(*2) There are no subprime related <strong>loan</strong>s.<br />
143.5<br />
36.3<br />
39.1<br />
<br />
(in billions <strong>of</strong> y en)<br />
-<br />
-<br />
-<br />
-<br />
<strong>Balance</strong><br />
Change<br />
f rom Mar-09<br />
Securities with no available fair value 21.2 -6.5<br />
28
Loans <strong>to</strong> nonbank financial industry 1. Overall<br />
Outst<strong>and</strong>ing <strong>loan</strong> <strong>balance</strong> <strong>to</strong> nonbank financial industry continuously decreased, by 0.06 trillion yen<br />
from 2009/3 <strong>to</strong> 1.78 trillion yen<br />
We decreased our exposure <strong>to</strong> independent nonbanks <strong>and</strong> <strong>to</strong> nonbanks related <strong>to</strong> ordinary industries<br />
( (-130.3 130 3 billion yen from 2009/3), 2009/3) while we actively increased our exposure <strong>to</strong> manufacturing manufacturing-related related<br />
nonbanks which take roles <strong>of</strong> group finance <strong>and</strong> sales finance (+57.5 billion yen from 2009/3)<br />
<br />
(in billions <strong>of</strong><br />
Yen) 2,336.5<br />
2,000<br />
1,500<br />
1,000<br />
500<br />
0<br />
258.2<br />
299.9<br />
886.2<br />
667.3<br />
Others<br />
Business finance<br />
Leasing<br />
Credit card & other consumer credit<br />
Consumer finance<br />
2,064.3<br />
204.3<br />
258.6<br />
779.7<br />
652.9<br />
1,845.5<br />
1,784.2<br />
181.5<br />
164.3<br />
243.3 210.5<br />
719.8<br />
562.9<br />
664.2<br />
622.7<br />
224.7 168.6 137.7 122.3<br />
2007/3 2008/3 2009/3 2009/9<br />
(*1)Managerial reporting basis: Loans <strong>to</strong> subsidiaries <strong>and</strong> SPC for securitization purpose are excluded.<br />
(*2)Ordinary ( 2)Ordinary industry: Retail / Services etc etc.<br />
<br />
<br />
Ordinary industry(*2)<br />
industry( 2)<br />
100%<br />
80%<br />
60%<br />
40%<br />
20%<br />
0%<br />
Financial institution Manufacturing<br />
16% 20%<br />
39%<br />
13%<br />
<br />
100%<br />
80%<br />
60%<br />
40%<br />
20%<br />
0%<br />
41%<br />
10%<br />
32% 29%<br />
2009/3 2009/9<br />
Rating 1-4 Rating 5 Rating 6 Rating 7-8<br />
9% 8%<br />
3%<br />
9%<br />
7%<br />
15%<br />
79%<br />
70%<br />
2009/3 2009/9<br />
29
Loans <strong>to</strong> nonbank financial industry 2. Loans <strong>to</strong> Consumer finance sec<strong>to</strong>r<br />
Outst<strong>and</strong>ing <strong>loan</strong> <strong>balance</strong> <strong>to</strong> consumer finance sec<strong>to</strong>r continuously decreased by 15.4 billion yen from 2009/3 <strong>to</strong> 122.3<br />
billion yen due <strong>to</strong> the market contraction<br />
Exposure <strong>to</strong> credit card <strong>and</strong> other consumer credit companies excluding those related <strong>to</strong> manufacturing continuously<br />
decreased by 21.9 21 9 billion yen from 2009/3 2009/3, while we actively increased our exposure <strong>to</strong> manufacturing-related manufacturing related companies companies,<br />
such as overseas Japanese companies with high credit ratings (+81.7 billion yen from 2009/3)<br />
<br />
<br />
(i (in billi billions <strong>of</strong> f<br />
Yen)<br />
892.1<br />
Credit card & other consumer credit (Manufacturing)<br />
Creditcard Credit card & other consumer credit(Other)<br />
credit (Other)<br />
Consumer finance<br />
900<br />
821.5<br />
148.3<br />
745 745.0 0<br />
750<br />
143.2 700.7<br />
600<br />
450<br />
300<br />
150<br />
0<br />
518.9<br />
224.7<br />
509.6<br />
107.5 189.2<br />
455.4<br />
433.4<br />
168.6 137.7 122 122.3 3<br />
2007/3 2008/3 2009/3 2009/9<br />
(*1)Managerial reporting basis: Loans <strong>to</strong> subsidiaries <strong>and</strong> SPC for securitization purpose are excluded.<br />
(*2)Ordinary industry: Retail / Services etc etc.<br />
100%<br />
80%<br />
60%<br />
40%<br />
20%<br />
0%<br />
Nonbank financial (Independent) Ordinary industry(*2)<br />
industry( 2)<br />
Financial institution Manufacturing<br />
15%<br />
47%<br />
8%<br />
<br />
100%<br />
80%<br />
60%<br />
40%<br />
20%<br />
0%<br />
26%<br />
43%<br />
5%<br />
30% 26%<br />
2009/3 2009/9<br />
Rating 1-4 Rating 5 Rating 6 Rating 7-8<br />
15% 12%<br />
1% 6%<br />
9% 4%<br />
75%<br />
78%<br />
2009/3 2009/9<br />
30
Real estate-related <strong>loan</strong>s 1. Overall, Real estate non-recourse <strong>loan</strong> (“NRL”)<br />
Outst<strong>and</strong>ing <strong>balance</strong> <strong>of</strong> NRL (excluding <strong>loan</strong>s <strong>to</strong> REIT <strong>and</strong> investments in CMBS) as <strong>of</strong> September 2009 was<br />
882.2 billion yen, decreased by 23.7 billion yen from March 2009<br />
Maintained quality <strong>of</strong> the overall portfolio as a result <strong>of</strong> early refinancing <strong>and</strong> so on, while some <strong>loan</strong>s were<br />
downgraded<br />
<br />
(in billions <strong>of</strong> Yen)<br />
1,800<br />
1,500<br />
1200 1,200<br />
900<br />
600<br />
300<br />
0<br />
11,531.0 531 0<br />
115.4<br />
185.4<br />
664.8<br />
Corporate NRL REIT CMBS<br />
1,725.5<br />
81 81.7 7<br />
234.5<br />
836.1<br />
1,858.2 1,834.4<br />
46.6 34.0<br />
282 282.0 0 289 289.8 8<br />
905.9 882.2<br />
565.4 573.2 623.7 628.3<br />
2007/3 2008/3 2009/3 2009/9<br />
(Total 882.2 billion yen)<br />
100%<br />
80%<br />
60%<br />
40%<br />
20%<br />
0%<br />
<br />
1% 2%<br />
18% 16%<br />
42%<br />
39%<br />
41%<br />
41%<br />
2009/3 2009/9<br />
<br />
Sep.<br />
2008<br />
Mar.<br />
2009<br />
Change f m<br />
Sep. 2008<br />
New lending<br />
(+)<br />
Collection,<br />
etc. (-)<br />
【Upper level <strong>of</strong> LTV by rating】<br />
■Below Rating 7 : over 90%<br />
■Rating 6 <strong>to</strong> 6- : 70%-90%<br />
■Rating5+ <strong>to</strong> 6+ : 60%-70%<br />
■Rating 1 <strong>to</strong> 4 : 60% or below<br />
*Ratings are given based on the<br />
quantitative i i evaluation l i (LTV (LTV, DSCR DSCR,<br />
etc.) <strong>of</strong> underlying assets, in addition<br />
<strong>to</strong> qualitative fac<strong>to</strong>rs such as<br />
structure <strong>and</strong> sponsor supports<br />
Sep.<br />
2009<br />
Change f m<br />
Mar. 2009<br />
(in billions <strong>of</strong> Yen)<br />
New lending<br />
(+)<br />
Collection,<br />
etc. (-)<br />
871.2 905.9 34.6 147.9 -113.3 882.2 -23.7 130.5 -154.1<br />
* New lending g includes the amount <strong>of</strong> refinancing g<br />
31
Real estate-related <strong>loan</strong>s 2. Loans <strong>to</strong> REIT, corporate <strong>loan</strong>s<br />
Loans <strong>to</strong> REIT, even with a continued declining trend <strong>of</strong> property values, still keeps conservatively low LTV<br />
Over 60% <strong>of</strong> corporate <strong>loan</strong>s have rating <strong>of</strong> 5 (equivalent <strong>to</strong> BBB <strong>of</strong> credit rating agency) or higher, <strong>and</strong><br />
most <strong>of</strong> them are <strong>to</strong> large corpo<strong>ratio</strong>ns or group companies <strong>of</strong> large corpo<strong>ratio</strong>ns<br />
<br />
(<strong>Balance</strong>: 289.8 billion yen)<br />
* Calculated from each REIT’s latest financial data<br />
首<br />
50-60%<br />
17%<br />
over<br />
60%<br />
17%<br />
50% or<br />
below<br />
66%<br />
LTV = Outst<strong>and</strong>ing interest-bearing<br />
debt / External appraisal value<br />
Appx. 66% <strong>of</strong> <strong>loan</strong>s <strong>to</strong><br />
REIT have LTV <strong>of</strong> 50% or<br />
below among <strong>to</strong>tal <strong>loan</strong>s <strong>to</strong><br />
REIT <strong>of</strong> 289.8 billion yen<br />
Loans <strong>to</strong> REIT sponsored<br />
by domestic real estate,<br />
trading <strong>and</strong> financial<br />
companies account for<br />
80% or more <strong>of</strong> <strong>to</strong>tal <strong>loan</strong>s<br />
t<strong>to</strong> REIT<br />
<br />
<br />
Rating 6<br />
-<strong>Balance</strong>: appx. 152.0 bn<br />
yen<br />
-Loans <strong>to</strong> companies that<br />
have parent companies with<br />
credit rating <strong>of</strong> 5 or higher:<br />
appx. 79.0 bn yen<br />
25%<br />
4%<br />
7% Rating<br />
9-10<br />
Rating<br />
7-8<br />
Rating<br />
1-4<br />
<br />
首<br />
Rating 7-8<br />
3%<br />
Rating 6<br />
Rating 9-10 9 10<br />
2%<br />
12% RRating ti 11-44 Rating 5<br />
49%<br />
34%<br />
Low LTV + support<br />
capability <strong>of</strong> sponsors<br />
�83% <strong>of</strong> <strong>loan</strong>s <strong>to</strong> REIT<br />
have credit rating <strong>of</strong> 5 or<br />
higher<br />
(in billions <strong>of</strong><br />
yen )<br />
50<br />
40<br />
30<br />
20<br />
10<br />
0<br />
44.1<br />
32.2<br />
Loans<br />
Rating 6<br />
Reserve, collaterals<br />
22 22.9 9 20 20.6 6<br />
Rating 7-8 Rating 9-10<br />
7%<br />
Rating 5<br />
57%<br />
32
Real estate-related <strong>loan</strong>s <strong>of</strong> group companies: First Credit<br />
NPL volume decreased by 14.3 billion yen from 2009/3 <strong>to</strong> 90.7 billion yen due <strong>to</strong> the repayment, etc.<br />
Loans <strong>to</strong> real estate/construction industry, the major fac<strong>to</strong>r <strong>of</strong> credit costs, were reduced <strong>to</strong> 86.0<br />
billion yen<br />
<br />
* Loan <strong>balance</strong> <strong>and</strong> Assets classified under the Financial Reconstruction Law: First Credit<br />
(in billions <strong>of</strong> yen)<br />
200<br />
150<br />
100<br />
50<br />
0<br />
194.9<br />
42.7<br />
23.7<br />
128 128.4 4<br />
7.2<br />
164.0<br />
39.6<br />
20.5<br />
103.9<br />
non-consolidated basis, before direct written-<strong>of</strong>f<br />
(Direct written-<strong>of</strong>f: FY2008 24.5 24 5 bn yen, yen 1HFY2009 31.2 31 2 bn yen)<br />
Reserve <strong>ratio</strong> (*2)<br />
(in billions <strong>of</strong> yen) Change (Coverage <strong>ratio</strong> (*3) Individual<br />
Corporate (other industries)<br />
Real estate/Construction<br />
Allowance for <strong>loan</strong> losses<br />
Mar. 2009<br />
Sep.<br />
2009<br />
Collateral / Reserve<br />
)<br />
Loans in bankrupt/<br />
55 4 59 4 40<br />
Reserve<br />
Collateral<br />
33.8 100%<br />
(*1) 25.5 (100%)<br />
Reserve<br />
Collateral<br />
9.2 78.2%<br />
(*1) p<br />
practically bankrupt<br />
55.4 59.4 4.0<br />
140.4<br />
Doubtful <strong>loan</strong>s<br />
43.1 29.5 -13.6<br />
17.6 (91.3%)<br />
S b t d d l<br />
65 19<br />
Reserve<br />
47<br />
Collateral<br />
0.1 100%<br />
(*1) 1.8 (100%)<br />
Reserve<br />
Collateral<br />
43.1 94.6%<br />
(*1) 37.0<br />
Subst<strong>and</strong>ard <strong>loan</strong>s 6.5 1.9 -4.7<br />
17.3<br />
Asset classif ied under the<br />
Financial Reconstruction<br />
Law<br />
(*1) 70% <strong>of</strong> collateral value<br />
105.0 90.7 -14.3<br />
45.0 (97.3%)<br />
(*2) Reserve / (<strong>loan</strong> <strong>balance</strong> - collateral value) (*3) (collateral value + reserve) / <strong>loan</strong> <strong>balance</strong><br />
86.0<br />
44 44.1 1 45.2<br />
2008/3 2009/3 2009/9<br />
<br />
1. Strengthening credit management<br />
- SSupport from f STB group in i valuation l i <strong>of</strong> f collaterals ll l <strong>and</strong> d credit di screening i process<br />
- Strengthened earlier sales activity <strong>of</strong> collateralized properties<br />
2. Restructuring business model<br />
- EExpansion i <strong>of</strong> f guarantee t business b i<br />
- Enhancement <strong>of</strong> good-quality leasehold property collateralized <strong>loan</strong><br />
33
中表紙<br />
Division performance<br />
34
Retail financial services<br />
Total depositary assets increased by 0.4 trillion yen from 2009/3 <strong>to</strong> 10.7 trillion yen, due <strong>to</strong> the increase in time<br />
deposits <strong>and</strong> recovery <strong>of</strong> sales <strong>of</strong> mutual funds <strong>and</strong> individual annuities<br />
Fees related <strong>to</strong> sales <strong>of</strong> mutual funds <strong>and</strong> individual annuities decreased by 1.3 billion yen from 1HFY2008, mainly<br />
ddue t<strong>to</strong> the th decrease d in i administ<strong>ratio</strong>n d i i t ti ffees resulting lti from f the th decline d li iin market k t value l <strong>of</strong> f mutual t l ffunds d<br />
<br />
(in trillions<br />
<strong>of</strong> yen)<br />
10<br />
8<br />
6<br />
4<br />
2<br />
0<br />
Mutual fund, individual annuity<br />
Time deposits (Fixed rate)<br />
Loan trust, money trust + Time deposits (Variable rate)<br />
Ordinary deposits<br />
10.0 10.3 10.3<br />
19 19 1.6<br />
1.9 1.9<br />
10.7<br />
1.8<br />
5.3 5.7 6.1 6.5<br />
2.0 1.8 1.6 1.5<br />
0.8 0.9 1.0 0.9<br />
2007/3 2008/3 2009/3 2009/9<br />
<br />
FY2007 FY2008 FY2009<br />
(in billions <strong>of</strong> Yen) (1H) (2H) (1H)<br />
Outst<strong>and</strong>ing 2,002.9 1,989.3 2,044.2 2,108.9<br />
(before securitization) (2,002.9) (1,989.3) (2,097.0) (2,114.6)<br />
Execution 301.3 120.3 201.7 186.3<br />
Mutual funds sales volume (Left) ( ) Annuity y sales volume ( (Left) )<br />
Admin fee (Right)<br />
in billions<br />
<strong>of</strong> yen<br />
Sales fee (Right)<br />
in billions<br />
<strong>of</strong> yen<br />
150 138.9<br />
127.2<br />
137.2 15<br />
100<br />
36.2<br />
33.0<br />
76.8<br />
50.0<br />
50<br />
4.3<br />
102.7<br />
3.9<br />
94.2<br />
36 36.3 3<br />
2.2<br />
37 3.7<br />
87.2<br />
0<br />
5.0 4.8 40.5 3.4 3.7<br />
2HFY2007 1HFY2008 2HFY2008 1HFY2009<br />
<br />
Managerial reporting basis; before transfer pricing<br />
among business divisions<br />
(in billions <strong>of</strong> Yen) 1HFY2009 1HFY2008 Change<br />
Gross business pr<strong>of</strong>it 22.6 27.7 -5.1<br />
Net interest income 17.0 21.1 -4.1<br />
Deposits 8.9 13.1 -4.1<br />
Loans 8.1 8.0 0.0<br />
Net fees <strong>and</strong> commissions 5.6 6.6 -1.0<br />
Mutual fund/individual annuity 7.5 8.8 -1.3<br />
Less: Insurance premium -2.0 -2.3 0.3<br />
10<br />
5<br />
0<br />
35
Wholesale financial services & Loan portfolio (Non-consolidated)<br />
Net interest income decreased by 3.0 billion yen from 1HFY2008 <strong>to</strong> 42.2 billion yen, mainly due <strong>to</strong> the<br />
decline in earnings resulting from the decrease in the <strong>balance</strong> <strong>of</strong> international credit investment<br />
Net fees <strong>and</strong> commissions increased by 3.3 billion yen from 1HFY2008, due <strong>to</strong> the increase in<br />
arrangement tf fees <strong>of</strong> fsyndicated di t dl <strong>loan</strong>s <strong>and</strong> dreal lestate t t non-recourse l<strong>loan</strong>s etc. t<br />
<br />
(in trillions<br />
<strong>of</strong> yen)<br />
15<br />
12<br />
9<br />
6<br />
3<br />
0<br />
Individual <strong>loan</strong>s<br />
Market-based <strong>loan</strong> (international)<br />
Market-based <strong>loan</strong> (domestic: exc. Real estate NRL)<br />
Real estate NRL (inc. CMBS <strong>and</strong> <strong>loan</strong>s <strong>to</strong> REITs)<br />
Sumi<strong>to</strong>mo Trust's group companies<br />
Corporate <strong>loan</strong> (Japanese)<br />
13.4<br />
13.3 13.5 13.2<br />
2.0<br />
2.0 2.0 2.1<br />
1.3<br />
11 1.1<br />
1.0<br />
0.5<br />
1.3<br />
08 0.8<br />
1.1<br />
0.5<br />
1.0<br />
0.6<br />
1.2<br />
0.4<br />
0.8<br />
0.5<br />
1.2<br />
0.4<br />
7.6 7.3 7.9 7.9<br />
2007/3 2008/3 2009/3 2009/9<br />
Managerial reporting basis; before transfer pricing<br />
among g business divisions<br />
(in billions <strong>of</strong> Yen) 1HFY2009 1HFY2008 Change<br />
Net interest income etc 49.4 45.2 4.3<br />
Net interest income 42.2 45.2 -3.0<br />
Deposits p<br />
1.9 3.0 -1.1<br />
Credit investment 40.3 42.2 -1.8<br />
Domestic 32.9 28.4 4.5<br />
International 7.5 13.8 -6.3<br />
Others 7.2 - 7.2<br />
<br />
Managerial reporting basis; including net trust fee<br />
(in billions <strong>of</strong> Yen) 1HFY2009 1HFY2008 Change<br />
Fee revenue 14.2 10.9 3.3<br />
Real estate NRL 2.0 0.8 1.1<br />
Other Market-based <strong>loan</strong><br />
& syndicated <strong>loan</strong><br />
50 5.0 25 2.5 26 2.6<br />
Securitization 1.7 2.6 -0.9<br />
S<strong>to</strong>ck transfer agency services 7.7 9.2 -1.4<br />
Fees paid for outsourcing* -3.6 -6.0 2.4<br />
* Fees paid for outsourcing <strong>of</strong> s<strong>to</strong>ck agency services ope<strong>ratio</strong>n<br />
36
Treasury <strong>and</strong> financial products<br />
“Financial ope<strong>ratio</strong>ns” realized the pr<strong>of</strong>it <strong>of</strong> 26.9 billion yen due <strong>to</strong> improved interest rate margins caused by lower<br />
short term interest rates, while “Investment ope<strong>ratio</strong>ns” resulted in the loss <strong>of</strong> -5.0 billion yen mainly due <strong>to</strong> the<br />
loss on sales in reducing hedge fund investment positions<br />
“M “Marketing k ti ffunctions” ti ” realized li d th the pr<strong>of</strong>it fit <strong>of</strong> f 13.0 13 0 billi billion yen. CCombining bi i th the above b th three areas, t<strong>to</strong>tal t l pr<strong>of</strong>it fit was 34 34.9 9<br />
billion yen<br />
<br />
<br />
(in billions <strong>of</strong> yen )<br />
200<br />
(in billions<strong>of</strong> billions <strong>of</strong> Yen)<br />
Loan/deposit marketing<br />
40<br />
Interest (<strong>of</strong>f-<strong>balance</strong>)/forex marketing<br />
Market products<br />
150<br />
142.7<br />
30<br />
20<br />
10<br />
100 149.7<br />
0<br />
50<br />
0<br />
-50<br />
50.9<br />
49.3<br />
13.8<br />
10.7 34 34.3 3<br />
26.4 27.0 29.6<br />
-11.9<br />
-36.8<br />
26.9<br />
13.0<br />
-5.0<br />
34.9<br />
FY2006 FY2007 FY2008 1HFY2009<br />
Marketing functions: Market-making ope<strong>ratio</strong>ns for interest rate <strong>and</strong> forex<br />
products; p Creation & Sales <strong>of</strong> financial pproducts<br />
Financial ope<strong>ratio</strong>ns: Financial ope<strong>ratio</strong>ns managing potential market risks (*)<br />
involved in the overall <strong>balance</strong> sheet<br />
(*) Interest rate risk associated with liquid deposits, equity risk, etc.<br />
Investment ope<strong>ratio</strong>ns: Proprietary investment pursuing absolute return<br />
Total<br />
FY2006 FY2007 FY2008 1HFY2009<br />
ti<br />
(in billions <strong>of</strong> Yen)<br />
15<br />
0<br />
-15<br />
-30<br />
-45<br />
-60<br />
S<strong>to</strong>ck<br />
Forex<br />
Interest rate<br />
Total<br />
FY2006 FY2007 FY2008 1HFY2009<br />
<br />
<strong>Balance</strong> MTM<br />
Change fm Change fm<br />
(in billions <strong>of</strong> Yen) Mar. 2009 Mar. 2009<br />
Hedge funds investment 37.0 -23.9 -1.7 8.1<br />
37
Fiduciary business (Total entrusted assets, Securities processing)<br />
Total entrusted assets increased by 4.2 trillion yen from March 2009 <strong>to</strong> 59.1 trillion yen, mainly due <strong>to</strong> the<br />
increase in market value <strong>and</strong> the steady inflow <strong>of</strong> entrusted s<strong>to</strong>ck investment trusts<br />
With the increase in the <strong>balance</strong> <strong>of</strong> entrusted assets such as mutual funds, the <strong>balance</strong> <strong>of</strong> global cus<strong>to</strong>dy<br />
also continue <strong>to</strong> be stable<br />
<br />
(in trillions<br />
<strong>of</strong> yen)<br />
80<br />
70<br />
60<br />
50<br />
40<br />
30<br />
20<br />
10<br />
0<br />
72.4<br />
20.6<br />
19.9<br />
Mutual fund<br />
Tokkin<br />
Pension trust<br />
Securities trust, etc<br />
Pension <strong>to</strong>kkin<br />
Public pension<br />
(in trillions<br />
<strong>of</strong> yen)<br />
74.7<br />
25<br />
20<br />
19.0%<br />
21.2<br />
20.6<br />
54.9<br />
15 15.5 5<br />
59.1<br />
18.0<br />
(*1) Mark-<strong>to</strong>-market basis (excluding Tokkin)<br />
(*2) Pension trust includes nonqualified pension plans <strong>and</strong> national pension funds<br />
(appx 0 5 trillion yen) from this time<br />
15<br />
10<br />
5<br />
0<br />
15.5<br />
<strong>Balance</strong> (left) *cost basis<br />
Market share (right) *estimate<br />
20.5% 20.6% 20.5%<br />
19.7 20.0 20.4<br />
2007/3 2008/3 2009/3 2009/9<br />
4.2<br />
38 3.8<br />
5.2<br />
48 4.8<br />
19.6 20.8<br />
<br />
7.6<br />
16.0<br />
7.1<br />
15.5<br />
5.1<br />
3.9<br />
6.0<br />
4.2<br />
4.0<br />
6.6<br />
75<br />
4.5<br />
5.33<br />
2007/3 2008/3 2009/3 2009/9<br />
50<br />
179<br />
162<br />
145<br />
164<br />
(appx. 0.5 trillion yen) from this time<br />
25<br />
43 42 41<br />
28<br />
25%<br />
20%<br />
15%<br />
10%<br />
5%<br />
0%<br />
(in USD millions)<br />
Gross pr<strong>of</strong>it (left)<br />
Cus<strong>to</strong>dial asset (right) (in USD billions)<br />
100<br />
200<br />
0<br />
2HFY2007 1HFY2008 2HFY2008 1HFY2009<br />
150<br />
100<br />
50<br />
0<br />
38
Fiduciary business (Pension, Investment management)<br />
Assets under management <strong>of</strong> our group increased by 2.3 trillion yen from 2009/3 <strong>to</strong> 28.4 trillion yen, due<br />
<strong>to</strong> new entrusted assets <strong>of</strong> public pensions <strong>and</strong> investment advisories, <strong>and</strong> the increase in market value<br />
Change <strong>of</strong> pension trust <strong>balance</strong> due <strong>to</strong> market share changes among trustees has been positive for 14<br />
consecutive half years y since 2HFY2002<br />
<br />
(in trillions <strong>of</strong> Yen)<br />
30<br />
25<br />
20<br />
15<br />
10<br />
27.4<br />
1.4 1.55<br />
7.6<br />
Mutual fund (by STB Asset Management)<br />
Pension trust<br />
Investment advisory (inc. crossborder)<br />
Public pension<br />
27.6<br />
7.1<br />
2.3 3.3<br />
16.0 15.5<br />
26.1<br />
1.2<br />
6.0<br />
14.2<br />
28.4<br />
1.4<br />
6.6<br />
15.0<br />
5<br />
4.5 5.3<br />
0<br />
2007/3<br />
(*1) Mark-<strong>to</strong>-market basis<br />
2008/3 2009/3 2009/9<br />
(*2) Pension trust includes nonqualified pension plans <strong>and</strong> national pension<br />
funds (appx. 0.5 trillion yen) from this presentation<br />
<br />
(in trillions <strong>of</strong> Yen)<br />
0.3<br />
0.2<br />
0.1<br />
0.0<br />
Change <strong>of</strong> <strong>balance</strong> by share change (Left)<br />
*Cost basis<br />
Market share (right) *estimate<br />
19.9%<br />
19 19.5% 5%<br />
19 19.7% 7% 19 19.7% 7%<br />
0.12<br />
0.18<br />
0.08 006 0.06<br />
2HFY2007 1HFY2008 2HFY2008 1HFY2009<br />
22%<br />
20%<br />
18%<br />
16%<br />
<br />
<br />
(in billions <strong>of</strong> Yen)<br />
1,200<br />
900<br />
600<br />
53 53.0% 0% 52 52.6% 6%<br />
991.4<br />
<strong>Balance</strong> in alternative investment (Left) *Mark-<strong>to</strong>-market<br />
basis<br />
Ratio <strong>of</strong> active investment (Right)<br />
1,045.0<br />
50.0%<br />
944 944.8 8<br />
48.0%<br />
897.8<br />
2HFY2007 1HFY2008 2HFY2008 1HFY2009<br />
50%<br />
35%<br />
20%<br />
39
Real estate business<br />
Gross business pr<strong>of</strong>it for group real estate business declined by 3.6 billion yen from 1HFY2008 <strong>to</strong> 8.2 billion yen, mainly<br />
due <strong>to</strong> the significant decrease in large commercial brokerage deals with a background <strong>of</strong> continued stagnant real estate<br />
market<br />
Real estate assets under management (private funds) increased slightly from March 2009 <strong>to</strong> 211.5 billion yen<br />
�Plan <strong>to</strong> set up a fund jointly with AXA REIM Group in the first half <strong>of</strong> 2010 (aiming at a size <strong>of</strong> 100 billion yen)<br />
<br />
* Transactions in which we acted for either/both seller or purchaser<br />
(i (in billi billions <strong>of</strong>f Y Yen) )<br />
500 50<br />
400 40<br />
300 30<br />
200 20<br />
100 10<br />
0<br />
43.1<br />
1.9<br />
3.0<br />
6.1<br />
44.2<br />
17 1.7<br />
3.3<br />
7.1<br />
11.2 10.7<br />
Assetmanagement<br />
Asset management<br />
Investment<br />
Securitization<br />
Brokerage (residential)<br />
BBrokerage k (commercial)<br />
( i l)<br />
22.4<br />
1.5<br />
0.8<br />
52 5.2<br />
0.7 11.8<br />
20.8 21.2<br />
8.2<br />
8.0<br />
0.4<br />
2.6 0.7<br />
0.2<br />
4.2 2.2<br />
6.7 3.3<br />
3.9<br />
1.8<br />
FY2006 FY2007 FY2008<br />
Full/1H<br />
FY2009<br />
1H<br />
100%<br />
80%<br />
60%<br />
40%<br />
20%<br />
0%<br />
<br />
Other<br />
Kinki District (Osaka Pref.)<br />
Kan<strong>to</strong> District (Tokyo Met. Area)<br />
Tokyo 23 wards<br />
10%<br />
31%<br />
14%<br />
45%<br />
1%<br />
20%<br />
9%<br />
70%<br />
1HFY2008 1HFY2009<br />
<br />
(in billions <strong>of</strong> Yen)<br />
200<br />
150<br />
100<br />
50<br />
0<br />
157.4<br />
130.8<br />
Private fund<br />
J-REIT<br />
206.8 207.5 211.5<br />
157.1 162.3 162.3<br />
2007/3 2008/3 2009/3 2009/9<br />
* Cost basis<br />
100%<br />
80%<br />
60%<br />
40%<br />
20%<br />
0%<br />
<br />
Other Development<br />
Commercial, logistics Multifamily<br />
Office<br />
14%<br />
11%<br />
14%<br />
62%<br />
29%<br />
9%<br />
6%<br />
17%<br />
39%<br />
1HFY2008 1HFY2009<br />
<br />
Entrusted assets (Left)<br />
Number <strong>of</strong> trustagreements trust agreements (Right)<br />
(in trillions <strong>of</strong> Yen)<br />
6.0<br />
4.5<br />
3.0<br />
1.5<br />
0.0<br />
823<br />
3.78<br />
913 912 884<br />
4.28 4.54 4.52<br />
2008/3 2009/3 2009/3 2009/9<br />
(Transactions)<br />
1,000<br />
750<br />
500<br />
250<br />
0<br />
40