PCS-150 / PCI-200 High Speed Boxcar Modules - Becker & Hickl ...
PCS-150 / PCI-200 High Speed Boxcar Modules - Becker & Hickl ...
PCS-150 / PCI-200 High Speed Boxcar Modules - Becker & Hickl ...

You also want an ePaper? Increase the reach of your titles
YUMPU automatically turns print PDFs into web optimized ePapers that Google loves.
<strong>Becker</strong> & <strong>Hickl</strong> GmbH <strong>PCS</strong>APP.DOC<br />
Kolonnenstr. 29<br />
10829 Berlin<br />
Tel. 030 / 787 56 32<br />
Fax. 030 / 787 57 34<br />
email: info@becker-hickl.de<br />
http://www.becker-hickl.de<br />
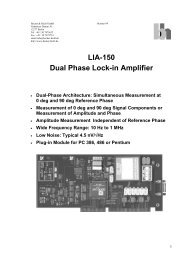
<strong>PCS</strong>-<strong>150</strong> / <strong>PCI</strong>-<strong>200</strong> <strong>High</strong> <strong>Speed</strong> <strong>Boxcar</strong> <strong>Modules</strong><br />
Recovery of Signals from Noise<br />
Resolution down to <strong>150</strong> ps<br />
Recording of <strong>High</strong> <strong>Speed</strong> Optical Signals<br />
Luminescence Decay Measurements<br />
Energy Measurement of ps and fs Pulses<br />
Nonlinear Optical Absorption Measurements<br />
Introduction<br />
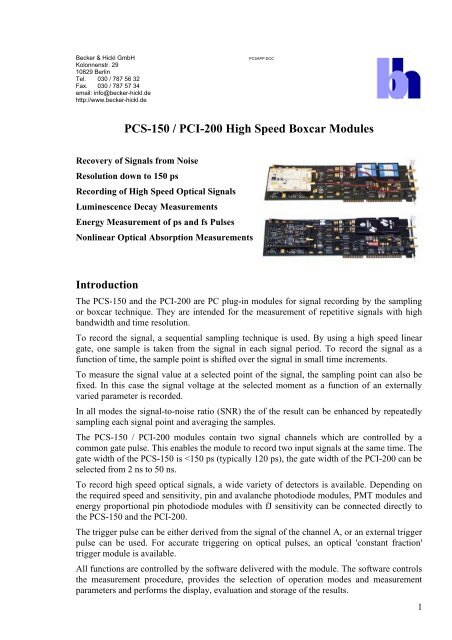
The <strong>PCS</strong>-<strong>150</strong> and the <strong>PCI</strong>-<strong>200</strong> are PC plug-in modules for signal recording by the sampling<br />
or boxcar technique. They are intended for the measurement of repetitive signals with high<br />
bandwidth and time resolution.<br />
To record the signal, a sequential sampling technique is used. By using a high speed linear<br />
gate, one sample is taken from the signal in each signal period. To record the signal as a<br />
function of time, the sample point is shifted over the signal in small time increments.<br />
To measure the signal value at a selected point of the signal, the sampling point can also be<br />
fixed. In this case the signal voltage at the selected moment as a function of an externally<br />
varied parameter is recorded.<br />
In all modes the signal-to-noise ratio (SNR) the of the result can be enhanced by repeatedly<br />
sampling each signal point and averaging the samples.<br />
The <strong>PCS</strong>-<strong>150</strong> / <strong>PCI</strong>-<strong>200</strong> modules contain two signal channels which are controlled by a<br />
common gate pulse. This enables the module to record two input signals at the same time. The<br />
gate width of the <strong>PCS</strong>-<strong>150</strong> is
Method of Signal Recording<br />
Sampling<br />
The principle of the sampling method is shown in the figure below.<br />
In each signal period one sample is taken<br />
from the signal. From period to period the<br />
sample location is shifted by a small amount,<br />
to sample a somewhat later point of the signal.<br />
After n signal periods n samples have been<br />
taken to recover the waveform of the signal. If<br />
the sample point is shifted in sufficiently<br />
small steps the signal bandwidth is<br />
determined by the gate width only. Because<br />
the processing time of the particular samples<br />
does not affect the time resolution, the<br />
sampling method provides a very high<br />
bandwidth and an extremely high virtual<br />
sample rate at a moderate hardware effort. In fact, the virtual sample rate and the signal<br />
bandwidth can be 10 to 100 times higher than with digital oscilloscopes of comparable price.<br />
To improve the signal to noise ratio the sampling method can be combined with signal<br />
averaging. For that purpose, the procedure described above is repeated several times and the<br />
obtained curves are averaged. Averaging of n curves improves the signal to noise ratio by a<br />
factor of √n.<br />
<strong>Boxcar</strong><br />
The boxcar method uses the same principle as the sampling method. It differs only in the<br />
strategy of signal averaging. While the sampling method immediately proceeds to the next<br />
signal point and averages the complete curves, the boxcar method averages the samples of<br />
one signal point first and than proceeds to the<br />
next point. The method is shown in the next<br />
figure.<br />
At each sample point several (in the figure<br />
100) samples are taken and averaged with the<br />
same delay setting. When the averaging for<br />
this signal point is complete the delay is<br />
increased. The SNR improvement is n1/2. The<br />
practical difference compared to the sampling<br />
method is the different effect of a possible<br />
amplitude or time drift of the signal.<br />
<strong>Boxcar</strong> with Fixed Delay<br />
Signal<br />
period:<br />
1<br />
2<br />
3<br />
4<br />
5<br />
6<br />
7<br />
8<br />
In some applications only one particular point of the signal rather than the complete<br />
waveform is recorded. The signal value at this point is recorded as a function of the time or<br />
any other externally variable parameter. For such applications the <strong>PCS</strong>-<strong>150</strong> and <strong>PCI</strong>-<strong>200</strong><br />
modules can be operated in the 'Fixed Delay' mode. The principle is shown in the figure<br />
below.<br />
9<br />
10<br />
Sample<br />
Sampling Method<br />
Signal<br />
period:<br />
1..100<br />
101..<strong>200</strong><br />
201..300<br />
301..400<br />
401..500<br />
501..600<br />
601..700<br />
701..800<br />
801..900<br />
901..1000<br />
Sample<br />
Signal<br />
Signal<br />
<strong>Boxcar</strong> method: 100 samples / step averaged<br />
Result<br />
Result<br />
after 100 signal periods<br />
2
In the example shown the signal has a different<br />
shape in the signal periods 3 to 8. This results<br />
in a different sample value at the fixed sample<br />
point. In the result the sample value as a<br />
function of the signal period number is<br />
displayed. The method can be combined with a<br />
signal averaging technique in the same way as<br />
the boxcar method.<br />
Applications<br />
Basic Measurement Setup<br />
The <strong>PCS</strong>-<strong>150</strong> and <strong>PCI</strong>-<strong>200</strong> modules can be used in the same way as a normal sampling<br />
oscilloscope. Thus, the modules need a trigger signal as a reference for the temporal location<br />
of the signal. The trigger signal must appear at least 20 to 40 ns preceding the signal in order<br />
to compensate the internal delay of the trigger circuit and the delay unit (see figure below).<br />
If the signal has a repetition rate of more<br />
than 50 MHz this delay is no problem. If<br />
Signal<br />
the trigger is too late, simply the next<br />
Recorded Interval<br />
Trigger<br />
signal period is displayed. For signals<br />
with low repetition rates, however,<br />
trigger and signal must be in the correct<br />
Delayed Signal<br />
time relation. This can be achieved by<br />
two different ways. The simplest way is<br />
to delay the measured signals through<br />
Internal Delay<br />
Recorded Interval<br />
delay lines by 20...40 ns. 4...8 m of high<br />
quality 50 Ohm cable is required for that<br />
purpose.<br />
The second way is a delayed triggering of the experiment. This can be achieved by an<br />
external delay generator or simply by delay cables. The signals from the experiment are fed<br />
directly to the <strong>PCS</strong>-<strong>150</strong> or <strong>PCI</strong>-<strong>200</strong> and the external trigger input is connected to the output of<br />
the generator that triggers the experiment. The second method avoids signal distortions by the<br />
delay lines in the signal path.<br />
Experiment<br />
Delay<br />
Trigger<br />
Signal<br />
Signal<br />
period:<br />
1<br />
2<br />
3<br />
4<br />
5<br />
6<br />
7<br />
8<br />
Signal<br />
Delay<br />
Sample<br />
9<br />
10<br />
<strong>Boxcar</strong> measurement with fixed delay<br />
Signal<br />
<strong>PCS</strong> Trigger<br />
Experiment<br />
<strong>PCS</strong><br />
Source<br />
Delaying the Signal Delaying the Experiment Trigger<br />
Trigger<br />
Result<br />
3
Measurement of noisy signals<br />
The next figure shows an example for the measurement of a noisy signal. The investigated<br />
device (experiment) is excited by a pulse generator. The experiment delivers a noisy output<br />
signal on each input pulse. Due to the noise the signal from the experiment cannot be used for<br />
triggering the <strong>PCS</strong>-<strong>150</strong> / <strong>PCI</strong>-<strong>200</strong>. Therefore, the module is triggered externally by the same<br />
pulse generator that triggers the experiment. To compensate the internal delay of the <strong>PCS</strong>-<strong>150</strong><br />
or <strong>PCI</strong>-<strong>200</strong>, the experiment trigger is delayed in relation to the <strong>PCS</strong>-<strong>150</strong> / <strong>PCI</strong>-<strong>200</strong> trigger.<br />
Pulse Generator<br />
Experiment<br />
Signal A<br />
Trigger<br />
Measurement of a noisy signal<br />
<strong>PCS</strong>-<strong>150</strong><br />
The figure above shows an example of the noise suppression which is achieved by signal<br />
averaging. By averaging 4096 samples per delay step the signal-to-noise ratio improved by a<br />
factor of 64.<br />
Measurements with PMTs<br />
Photomultiplier tubes (PMTs) are used to record low level<br />
light signals with a resolution down to 1ns (FWHM). The<br />
typical gain of a PMT is in the order of 10 5 to 10 7 . With this<br />
gain one single photon yields an output pulse from 16 uA to<br />
1.6 mA or 0.8 mV to 80 mV at a load resistor of 50 Ω.<br />
Thus, only a few photons can be detected within the linear<br />
range of the PMT and the signal is very noisy. Often the<br />
PMT output signal consists only of random current pulses<br />
due to the detection of the individual photons of the light<br />
signal (Figure right).<br />
Any attempt to improve the signal by additional amplifiers<br />
or by increasing the gain of the PMT in this situation results<br />
in increased noise or decreased dynamic range. There is<br />
only one remedy: To detect more photons either by<br />
decreasing the PMT gain while increasing the light<br />
intensity or by averaging many periods of the signal. In the<br />
figure right a typical example is shown. A fast PMT was<br />
illuminated with a light pulse of 0.3 ns FWHM from a laser<br />
diode. The intensity was reduced to keep the PMT signal<br />
within the linear range of the output current. The upper<br />
recording shows the noise due to the sampling of the<br />
random single photon pulses of the PMT. By averaging<br />
4096 signal periods the number of photons is increased<br />
accordingly, and the shape of the PMT response is shown<br />
clearly.<br />
Light Pulse<br />
PMT Output Signal<br />
PMT output signal for a low level light signal<br />
PMT signal recorded without and with 4096<br />
accumulations per point<br />
4
Fluorescence Lifetime Measurements<br />
In the figure below a simple setup for the measurement of fluorescence decay functions is<br />
shown.<br />
N2 Laser<br />
PC with <strong>PCS</strong>-<strong>150</strong><br />
Trg<br />
P1 P2 C<br />
M<br />
F1 F2 F3<br />
OCF-400 PDM-400 PDM-400<br />
APM-400 APM-400<br />
A<br />
Del1 Del2<br />
Flourescence Decay Measurement with the <strong>PCS</strong>-<strong>150</strong><br />
The nitrogen laser generates light pulses with less than 1ns duration and a repetition rate of<br />
10...100Hz. The light pulses excite the sample cell C. The fluorescence light from the sample<br />
cell is detected by a photodiode module PDM-400 or APM-400. The signal is fed to channel<br />
B of the <strong>PCS</strong>-<strong>150</strong>. P1 and P2 are glass plates which reflect a part of the laser radiation to the a<br />
second photodiode module and to the 'Optical Constant Fraction Trigger' OCF-400. The<br />
signal from OCF-400 is used as a trigger for the <strong>PCS</strong>-<strong>150</strong>. The signal from the second PDM-<br />
400 (or APM-400) is used to record the shape of the excitation pulse. The filters F1..F3 are<br />
provided to adjust the signal amplitudes, and the monochromator M selects an appropriate<br />
wavelength of the fluorescence light.<br />
The apparatus shown records fluorescence decay functions, time resolved fluorescence<br />
spectra or multiple decay curves at different wavelengths i.e. the complete wavelength-time<br />
behaviour of the fluorescence. For recording decay functions the sampling or boxcar mode is<br />
used. To suppress noise and amplitude fluctuations of the laser pulses 'Samples averaged' is<br />
chosen as high as possible with regard to the measuring time. The measurement delivers the<br />
decay function at the selected wavelength and the shape of the exciting laser pulse. A typical<br />
result is shown in the figure below.<br />
B<br />
5
Recording of time resolved spectra is achieved in the 'Fixed Delay' mode of the <strong>PCS</strong>-<strong>150</strong>. The<br />
sample point is set to the desired point of the decay function. Instead of the sample point the<br />
wavelength of the monochromator is scanned during the measurement, thus recording of the<br />
fluorescence intensity at the selected time as a function of the wavelength.<br />
The operation mode 'Block Increment' can be used to obtain the entire wavelength-time<br />
dependence of the fluorescence. In this mode the <strong>PCS</strong> / <strong>PCI</strong> performs subsequent<br />
measurements of the input waveform using the sampling or boxcar method. The curves are<br />
stored in different memory blocks. By scanning the wavelength, full information about the<br />
fluorescence behaviour of the sample is obtained.<br />
Transient Absorption Measurements<br />
In the figure below a simple arrangement for transient absorption measurements is shown.<br />
Pulsed Laser<br />
M1<br />
P1<br />
Dye Laser<br />
Pump<br />
Beam<br />
Optical<br />
Delay<br />
<strong>PCI</strong>-<strong>200</strong><br />
M2<br />
P2<br />
Sample<br />
P3<br />
Probe<br />
Beam<br />
Filter<br />
Channel A<br />
Channel B<br />
Trigger<br />
Transient Absorption Measurement<br />
D1<br />
PDM-400<br />
D2<br />
PDI-400<br />
D3<br />
PDI-400<br />
The output of a high power pulsed laser (i.e. N2 laser, excimer laser or frequency multiplied<br />
diode laser pumped YAG) is divided into two parts. One part is used to pump the sample, the<br />
other part pumps a dye laser which generates a light pulse of the appropriate wavelength to<br />
probe the absorption of the excited molecules in the sample. The detector D1 is a fast PDM-<br />
400 photodiode module which generates a trigger pulse for the <strong>PCI</strong>-<strong>200</strong> <strong>Boxcar</strong> Module. The<br />
absorption in the sample is measured by the detectors D2 and D3. D1 and D2 are PDI-400<br />
integrating photodiode modules and deliver energy proportional output pulses of some 100ns<br />
duration. The amplitudes of these pulses are recorded by the two signal channels of the<br />
<strong>PCI</strong>-<strong>200</strong> <strong>Boxcar</strong> module. The <strong>PCI</strong>-<strong>200</strong> is run in the ‘Fixed Delay’ mode. Thus, it records a<br />
curve consisting of subsequent averages over a selectable number of D2 and D3 intensity<br />
values. If the optical delay is continuously changed during the measurement and the quotient<br />
A/B is displayed the result shows the decay of the abasorption of the excited state species in<br />
the sample.<br />
Prism<br />
6
Nonlinear Optical Absorption Measurements<br />
Another example for the fixed delay mode and the wide gate width of the <strong>PCI</strong>-<strong>200</strong> is given in<br />
the next figure. The shown setup is used for the measurement of the intensity-dependence of<br />
the light absorption in organic dyes.<br />
A high power pulsed laser (i.e. nitrogen laser or pulsed dye laser) generates short pulses<br />
(< 1ns) with high energy (1mJ). The intensity is controlled by a suitable optical attenuator.<br />
The beam is split into two parts by the glass plate P2. The main part of the light is focused<br />
into the sample cell C1. The other part is fed through the reference cell C2. Both light signals<br />
are fed through a filter to the Detectors D1 and D2. D1 and D2 are PDI-400 integrating<br />
photodiode modules and deliver energy proportional output pulses of some 100ns duration.<br />
These pulses are recorded by the two signal channels of the <strong>PCI</strong>-<strong>200</strong>. The trigger pulse for the<br />
<strong>PCI</strong>-<strong>200</strong> is generated by the photodiode PD3. Due to the long duration of the signal pulses,<br />
delay lines in the signal path are not required. The gate width and the delay of the <strong>PCI</strong>-<strong>200</strong><br />
are set to sample a signal portion near the peak of the input pulses.<br />
The main problem in non-linear optical absorption measurements is, that an absorption<br />
accuracy of better than one percent over several orders of magnitude of the intensity is<br />
required. To reach the required absorption accuracy, the shown setup uses a second signal<br />
path trough a reference cell and the detector module D3. By using a common replaceable<br />
filter for both channels the signal intensity can be held inside the useful input voltage range of<br />
the <strong>PCI</strong>-<strong>200</strong> without degrading the accuracy of the measured absorption values.<br />
Pulsed Laser<br />
P1<br />
optical<br />
Attenuator<br />
P2<br />
D3<br />
PDM-400<br />
Trigger<br />
<strong>PCI</strong>-<strong>200</strong><br />
Measurement of non-linear absorption<br />
M<br />
Channel A<br />
C1<br />
C2<br />
Channel B<br />
Filter<br />
D1<br />
D2<br />
PDI-400<br />
PDI-400<br />
The measurement delivers pairs of signal values from which the intensity and the ratio of<br />
small signal and large signal absorption can be derived. By referring the A value (large signal<br />
absorption) to the B value (intensity and small signal absorption) the influence of the laser<br />
instability and the error of the optical attenuator do not appear in the measured absorption<br />
values. The apparatus is able to measure absorption variations as small as 1 %.<br />
7
Accessories<br />
DCA Series Preamplifiers<br />
These DC coupled preamplifiers have an excellent input offset<br />
stability and a bandwidth of up to 400 MHz. Inverting and<br />
noninverting versions with gains up to 10 (20 dB) are available.<br />
ACA Series Preamlifiers<br />
The ACA preamplifiers are AC coupled and have a bandwidth up to<br />
2 GHz and a gain up to 70 (37 dB).<br />
PDM-400 Photodiode <strong>Modules</strong><br />
The PDM-400 is a PIN photodiode module with 400 ps FWHM and<br />
a spectral range from 330 to 1000 nm. The modules do not require a<br />
special power supply, the operating voltage is taken from a connector<br />
at the <strong>PCS</strong> / <strong>PCI</strong> module.<br />
APM-400 Avalanche Photodiode <strong>Modules</strong><br />
The APM-400 is an avalanche photodiode module with an internal<br />
gain up to 100. Different versions with detector areas from 0.03 to<br />
7 mm 2 are available. Depending on the detector area, the speed is<br />
from 0.32 to 3 ns FWHM.<br />
PDI-400 Integrating Photodiode <strong>Modules</strong><br />
The PDI-400 is an integrating detector for pulsed light<br />
signals in the fJ range. The PDI-400 includes a high<br />
performance photodiode, a low noise charge sensitive<br />
amplifier and an active high pass filter. Due to filtering, most<br />
of the amplifier noise and low frequency background signals<br />
are rejected and the PDI-400 is insensitive to roomlight. Its<br />
high sensitivity, low noise and wide dynamic range makes it<br />
extremely useful in all applications where accurate and<br />
reproducable measurements of light pulse energies are<br />
essential.<br />
OCF-400 Optical Constant Fraction Trigger<br />
The OCF-400 is used to derive electrical trigger pulses from optical<br />
pulses with variable amplitude. Due to the constant fraction trigger<br />
principle the trigger point is widely independent of the pulse<br />
amplitude. Compared to a simple photodiode, the OCF-400 offers<br />
negligible influence of the light pulse energy on the trigger delay. It<br />
is used for measurements with Nitrogen Lasers or Dye Lasers with<br />
unstable pulse energy.<br />
8