Picosecond Laser Scanning Microscopy - Becker & Hickl GmbH
Picosecond Laser Scanning Microscopy - Becker & Hickl GmbH
Picosecond Laser Scanning Microscopy - Becker & Hickl GmbH

Create successful ePaper yourself
Turn your PDF publications into a flip-book with our unique Google optimized e-Paper software.
<strong>Becker</strong> & <strong>Hickl</strong> <strong>GmbH</strong><br />
Nahmitzer Damm 30<br />
D-1277 Berlin<br />
Tel. +49 30 787 56 32<br />
Fax +49 30 787 57 34<br />
email: info@becker-hickl.de<br />
http://www.becker-hickl.de<br />
<strong>Picosecond</strong> <strong>Laser</strong> <strong>Scanning</strong> <strong>Microscopy</strong><br />
Upgrade Your Leica TCS SP-2 for Lifetime Imaging<br />
Fluorescence Lifetime Imaging (FLIM) has<br />
become a new powerful method to investigate<br />
molecular interactions, metabolic reactions and<br />
energy transfer in cells and subcellular structures.<br />
These effects cause changes in the fluorescence<br />
quantum efficiency and thus in the fluorescence<br />
lifetime. Since the fluorescence lifetime does not<br />
depend on the unknown dye concentration it is a<br />
direct measure for the quantum efficiency. It<br />
therefore gives a more direct access to the<br />
investigated effects than the fluorescence<br />
intensity. Furthermore, the fluorescence lifetime<br />
can be used to separate the fluorescence of<br />
different luminophores in the cells if the<br />
components cannot be distinguished by their<br />
fluorescence spectra..<br />
Recording time-resolved fluorescence images can<br />
be achieved by combining the Leica TCS SP2<br />
<strong>Laser</strong> <strong>Scanning</strong> Microscope with Ti:Sa laser<br />
excitation and a new Time-Correlated Single<br />
Photon Counting (TCSPC) Imaging technique<br />
introduced by <strong>Becker</strong> & <strong>Hickl</strong>.<br />
TCSPC Imaging<br />
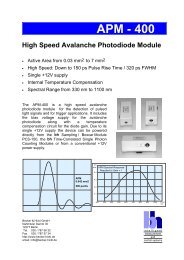
The principle the SPC-730 TCSPC Imaging<br />
module is shown in fig. 2.<br />
The module employs an advanced TCSPC<br />
technique featuring both high count rate and<br />
low differential nonlinearity. It contains the<br />
usual building blocks (CFDs, TAC, ADC) in<br />
the ‘reversed start-stop’ configuration<br />
together with a scanning interface and a large<br />
histogram memory integrated on one board.<br />
The TCSPC module receives the single<br />
photon pulses from the photomultiplier<br />
(PMT) of the microscope, the reference<br />
Leica Microsystems Heidelberg <strong>GmbH</strong><br />
Am Friedensplatz 3<br />
D-68165 Mannheim<br />
Tel. +49 621 7028 1100<br />
Fax +49 621 7028 1180<br />
email: martin.hoppe@leica-microsystems.com<br />
http://www.leica-microsystems.com<br />
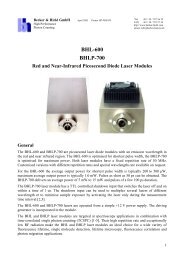
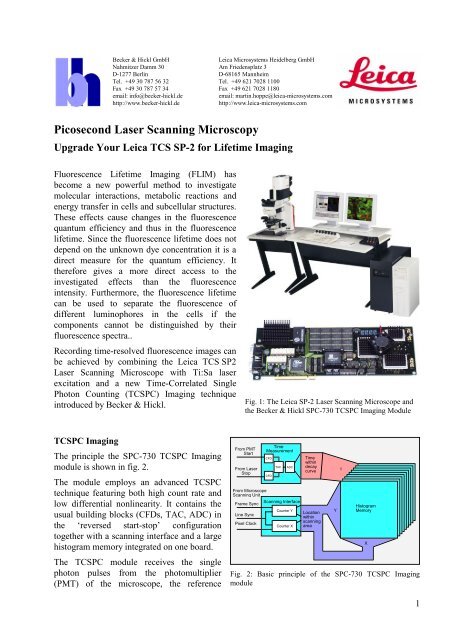
Fig. 1: The Leica SP-2 <strong>Laser</strong> <strong>Scanning</strong> Microscope and<br />
the <strong>Becker</strong> & <strong>Hickl</strong> SPC-730 TCSPC Imaging Module<br />
From PMT<br />
Start<br />
From <strong>Laser</strong><br />
Stop<br />
From Microscope<br />
<strong>Scanning</strong> Unit<br />
Frame Sync<br />
Line Sync<br />
Pixel Clock<br />
Time<br />
Measurement<br />
CFD<br />
CFD<br />
TAC ADC<br />
<strong>Scanning</strong> Interface<br />
Counter Y<br />
Counter X<br />
Time<br />
within<br />
decay<br />
curve<br />
Location<br />
within<br />
scanning<br />
area<br />
Y<br />
t<br />
Histogram<br />
Memory<br />
Fig. 2: Basic principle of the SPC-730 TCSPC Imaging<br />
module<br />
X<br />
1
pulses from the laser and the Frame Sync, Line Sync and Pixel Clock signals from the scanning unit<br />
of the microscope. For each PMT pulse, i.e. for each photon, the TCSPC module determines the<br />
time of the photon within the laser pulse sequence and the location within the scanning area. These<br />
values are used to address the histogram memory in which the events are accumulated. Thus, in the<br />
memory the distribution of the photon density over x, y, and the time within the fluorescence decay<br />
function builds up. The result can be interpreted as a two-dimensional (x, y) array of fluorescence<br />
decay curves or as a sequence of fluorescence images for different times (t) after the excitation<br />
pulse.<br />
Interestingly, there is practically no loss of photons in the TCSPC imaging process. As long as the<br />
photon detection rate is not too high all detected photons are processed and accumulated in the<br />
histogram, thus providing maximum sensitivity. This is a key advantage of the TCSPC <strong>Scanning</strong><br />
Microscope over gated photon counting or gated image intensifiers which gate away the majority of<br />
the fluorescence photons.<br />
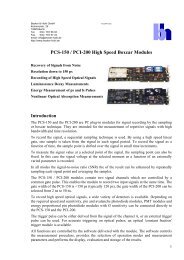
The TCSPC <strong>Laser</strong> <strong>Scanning</strong> Microscope<br />
The general setup is shown in figure 3. A Spectra Physics MAI TAI Ti:Sa laser delivers<br />
femtosecond pulses over a wavelength range from 780 nm to 920 nm. The repetition rate is<br />
80 MHz, the typical pulse width is below 160 fs FWHM. The short excitation pulses in conjunction<br />
with the high power density in the focus of the microscope lens enable effective two-photon<br />
excitation of typical fluorescence marker dyes and of the autofluorescence of biological samples.<br />
The near-infrared excitation light easily penetrates deeply into the sample. Fluorescence images can<br />
be recorded from sample layers as deep as 100 um. Furthermore, living cells are surprisingly stable<br />
under the NIR radiation of the Ti:Sa laser.<br />
Ti:Sa <strong>Laser</strong><br />
160 fs, 80 MHz<br />
SPC-730 TCSPC Imaging Module<br />
SYNC<br />
System Computer<br />
Pixel Clock, Line Sync, Frame Sync<br />
780 nm to 920 nm, 160fs<br />
Stop<br />
Start<br />
Fig. 2: Basic setup of the TCSPC <strong>Laser</strong> <strong>Scanning</strong> Microscope<br />
Preamp<br />
Scan Control<br />
Unit of<br />
Microscope<br />
Preamp<br />
internal PMT<br />
Scan Control<br />
external PMT,<br />
non-descanned<br />
<strong>Scanning</strong> Head<br />
TCS<br />
SP2<br />
Microscope<br />
The SP-2 microscope scans the sample in the x-y plane giving an image of the sample in the focal<br />
plane of the objective lens. By changing the depth of the focus in the sample, 3 D imaging of the<br />
sample is achieved. Furthermore, the full flexibility of the SP-2 scanning modes can be used.<br />
2
The scanning head of the SP-2 microscope has several detection channels equipped with separate<br />
confocal pinholes, monochromators, and photomultipliers (PMTs). The PMTs are small sidewindow<br />
tubes which give good sensitivity but are not optimised for time resolution. With a<br />
<strong>Becker</strong> & <strong>Hickl</strong> HFAC-26-10 preamplifier the detectors can be used in the TCSPC mode, but the<br />
time resolution is only 300 to 500 ps FWHM.<br />
For two-photon excitation, which does not require a pinhole, attaching a fast detector to the nondescanned<br />
port of the microscope is therefore a better solution. We recommend the PMH-100-1<br />
detector head of <strong>Becker</strong> & <strong>Hickl</strong> (resolution 150 ps FWHM) and the Hamamatsu R3809U-50<br />
(resolution < 30 ps FWHM). To get best performance from the R3809U-50 a <strong>Becker</strong> & <strong>Hickl</strong><br />
HFAC-26-01 preamplifier is used. The TCSPC instrument response functions for these detectors are<br />
shown in fig. 4 and fig. 5.<br />
fwhm=150ps<br />
Fig 4: System response for the PMH-100 detector<br />
fwhm=27ps<br />
Fig 5: System response for the R3809U-50 MCP<br />
Liftime data acquisition is accomplished by the <strong>Becker</strong> & <strong>Hickl</strong> SPC-730 TCSPC Imaging module.<br />
The CFD input receives the single photon pulses from the PMT. Synchronisation with the laser<br />
pulse sequence is achieved by the SYNC signal from the reference photodiode of the Ti:Sa laser.<br />
The SPC-730 module gets the scan control signals, Pixel Clock, Line Sync, and Frame Sync, from<br />
the scan controller of the microscope. Connecting the TCSPC module does not require any<br />
modifications in the microscope hardware and software. The scan parameters are controlled in the<br />
usual way via the microscope software. The normal scan speed, the zoom function, region of<br />
interest setting, etc. can be used also when recording lifetime images. Furthermore, the SPC-730 can<br />
be run in parallel with the standard image recording electronics of the microscope. Basically, steady<br />
state images and lifetime images in different spectral ranges can be obtained at the same time. Due<br />
to the simple interfacing the SPC-730 TCSPC Imaging module can be adapted also to existing<br />
microscopes including the SP-1, provided that pulsed excitation is available.<br />
Results<br />
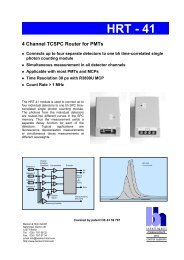
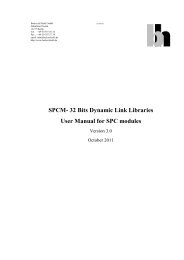
Fig. 6 (next page) shows the fluorescence images of a nematode containing GFP. The sequence<br />
shows eight subsequent images within time windows of 0.5 ns starting from the excitation pulse.<br />
The decay curves over a horizontal stripe of the image are shown in fig. 7 (next page).<br />
3
Fig. 6: Sequence of fluorescence images in intervals of 0.5ns starting from the excitation<br />
Fig. 7: Fluorescence decay curves over a 20 pixel wide horizontal stripe of the image<br />
Fig. 8 shows a lifetime image of cortex neurons after Calcium<br />
Green injection. The image data were processed by the<br />
<strong>Becker</strong> & <strong>Hickl</strong> SPCImage lifetime imaging software. The<br />
fluorescence intensity is displayed as brightness, the<br />
fluorescence lifetime as colour. The lifetime differences are<br />
clearly visible. The lifetime of Calcium Green is a direct<br />
measure of the calcium ion concentration. Therefore, lifetime<br />
images can avoid the intensity calibration normally used for Ca<br />
imaging.<br />
Conclusions<br />
0-0.5ns 0.5-1.0ns 1.0-1.5ns 1.5-2.0ns<br />
2.0-2.5ns 2.5-3.0ns 3.0-3.5ns 3.5-4.0ns<br />
The results show the potential of TCSPC <strong>Laser</strong> <strong>Scanning</strong><br />
<strong>Microscopy</strong> as a new method of fluorescence lifetime imaging.<br />
The field of application covers FRET (resonance energy<br />
1 ns Lifetime<br />
5 ns<br />
Fig. 8: Ca lifetime image of rat cortex<br />
neurons. Leica SP-1, 2-photon excitation<br />
transfer) measurements, Ca imaging, separation of multiple fluorescent labels and autofluorescence<br />
components, and other fluorescence imaging applications of microscopic samples.<br />
We are indebted to Dr. Thomas Behnisch, Neurophysiologisches Institut Magdeburg, for the Ca imaging measurements.<br />
4