


You also want an ePaper? Increase the reach of your titles
YUMPU automatically turns print PDFs into web optimized ePapers that Google loves.
AVIATION<br />
Think Differently: Who Is Doing Well<br />
Many analysts in the world compare any two<br />
categories as a linear column or graph, as<br />
shown in the figure.<br />
The idea of gap analysis is to convert the linear<br />
analysis of one axis to a plane analysis of two axes, by<br />
creating one relative reference values (averages), to<br />
get a clear and complete picture for all the categories<br />
of the study.<br />
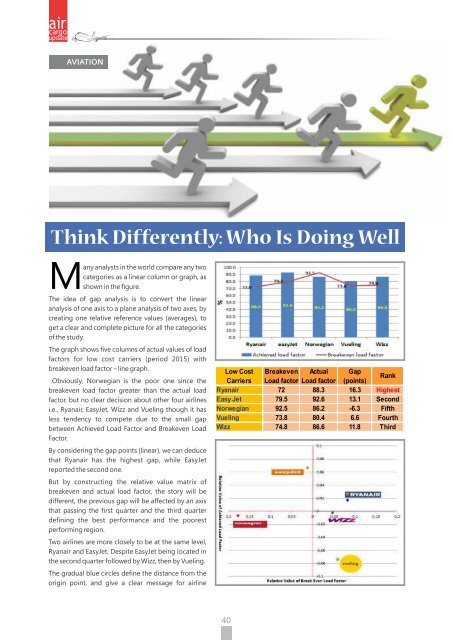
The graph shows five columns of actual values of load<br />
factors for low cost carriers (period 2015) with<br />
breakeven load factor – line graph.<br />
Obviously, Norwegian is the poor one since the<br />
breakeven load factor greater than the actual load<br />
factor, but no clear decision about other four airlines<br />
i.e., Ryanair, EasyJet, Wizz and Vueling though it has<br />
less tendency to compete due to the small gap<br />
between Achieved Load Factor and Breakeven Load<br />
Factor.<br />
By considering the gap points (linear), we can deduce<br />
that Ryanair has the highest gap, while EasyJet<br />
reported the second one.<br />
But by constructing the relative value matrix of<br />
breakeven and actual load factor, the story will be<br />
different, the previous gap will be affected by an axis<br />
that passing the first quarter and the third quarter<br />
defining the best performance and the poorest<br />
performing region.<br />
Two airlines are more closely to be at the same level,<br />
Ryanair and EasyJet. Despite EasyJet being located in<br />
the second quarter followed by Wizz, then by Vueling.<br />
The gradual blue circles define the distance from the<br />
origin point, and give a clear message for airline


