the trader's classroom collection
the trader's classroom collection
the trader's classroom collection

Create successful ePaper yourself
Turn your PDF publications into a flip-book with our unique Google optimized e-Paper software.
VI. How To Identify and Use Support and Resistance Levels<br />
Highs, Lows and Gaps<br />
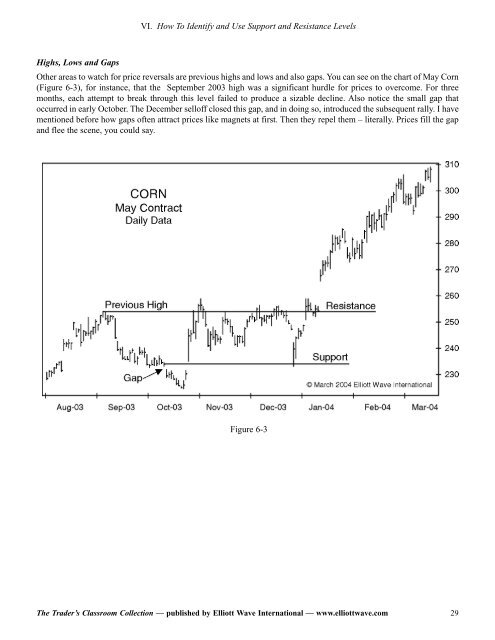
O<strong>the</strong>r areas to watch for price reversals are previous highs and lows and also gaps. You can see on <strong>the</strong> chart of May Corn<br />
(Figure 6-3), for instance, that <strong>the</strong> September 2003 high was a significant hurdle for prices to overcome. For three<br />
months, each attempt to break through this level failed to produce a sizable decline. Also notice <strong>the</strong> small gap that<br />
occurred in early October. The December selloff closed this gap, and in doing so, introduced <strong>the</strong> subsequent rally. I have<br />
mentioned before how gaps often attract prices like magnets at first. Then <strong>the</strong>y repel <strong>the</strong>m – literally. Prices fill <strong>the</strong> gap<br />
and flee <strong>the</strong> scene, you could say.<br />
Figure 6-3<br />
The Trader’s Classroom Collection — published by Elliott Wave International — www.elliottwave.com<br />
29