the trader's classroom collection
the trader's classroom collection
the trader's classroom collection

Create successful ePaper yourself
Turn your PDF publications into a flip-book with our unique Google optimized e-Paper software.
VIII. How Historical Extremes Act Like Price Boundaries<br />
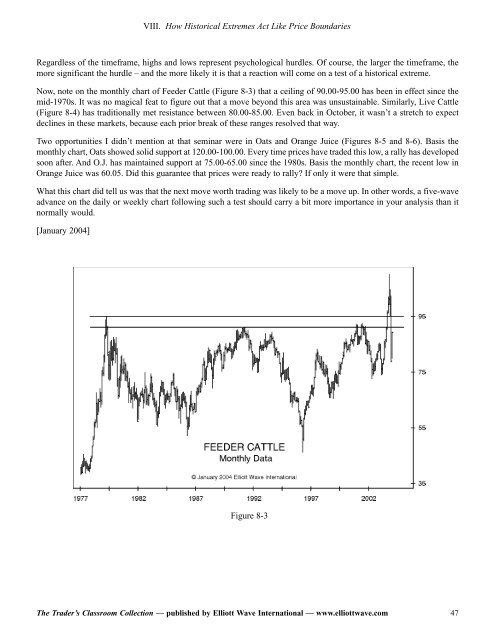
Regardless of <strong>the</strong> timeframe, highs and lows represent psychological hurdles. Of course, <strong>the</strong> larger <strong>the</strong> timeframe, <strong>the</strong><br />
more significant <strong>the</strong> hurdle – and <strong>the</strong> more likely it is that a reaction will come on a test of a historical extreme.<br />
Now, note on <strong>the</strong> monthly chart of Feeder Cattle (Figure 8-3) that a ceiling of 90.00-95.00 has been in effect since <strong>the</strong><br />
mid-1970s. It was no magical feat to figure out that a move beyond this area was unsustainable. Similarly, Live Cattle<br />
(Figure 8-4) has traditionally met resistance between 80.00-85.00. Even back in October, it wasn’t a stretch to expect<br />
declines in <strong>the</strong>se markets, because each prior break of <strong>the</strong>se ranges resolved that way.<br />
Two opportunities I didn’t mention at that seminar were in Oats and Orange Juice (Figures 8-5 and 8-6). Basis <strong>the</strong><br />
monthly chart, Oats showed solid support at 120.00-100.00. Every time prices have traded this low, a rally has developed<br />
soon after. And O.J. has maintained support at 75.00-65.00 since <strong>the</strong> 1980s. Basis <strong>the</strong> monthly chart, <strong>the</strong> recent low in<br />
Orange Juice was 60.05. Did this guarantee that prices were ready to rally? If only it were that simple.<br />
What this chart did tell us was that <strong>the</strong> next move worth trading was likely to be a move up. In o<strong>the</strong>r words, a five-wave<br />
advance on <strong>the</strong> daily or weekly chart following such a test should carry a bit more importance in your analysis than it<br />
normally would.<br />
[January 2004]<br />
Figure 8-3<br />
The Trader’s Classroom Collection — published by Elliott Wave International — www.elliottwave.com<br />
47