Download Presentation (PDF) - GN Store Nord
Download Presentation (PDF) - GN Store Nord
Download Presentation (PDF) - GN Store Nord
Create successful ePaper yourself
Turn your PDF publications into a flip-book with our unique Google optimized e-Paper software.
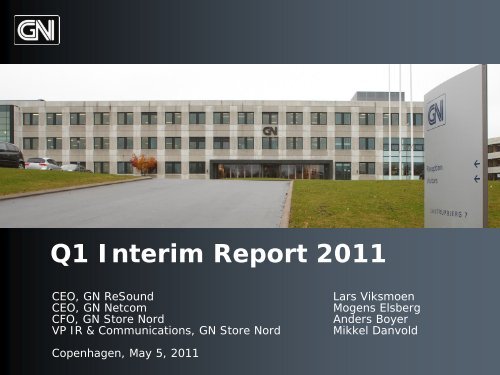
Q1 Interim Report 2011<br />
CEO, <strong>GN</strong> ReSound Lars Viksmoen<br />
CEO, <strong>GN</strong> Netcom Mogens Elsberg<br />
CFO, <strong>GN</strong> <strong>Store</strong> <strong>Nord</strong> Anders Boyer<br />
VP IR & Communications, <strong>GN</strong> <strong>Store</strong> <strong>Nord</strong> Mikkel Danvold<br />
Copenhagen, May 5, 2011
May 5, 2011<br />
Agenda<br />
• Q1 2011 Highlights<br />
• <strong>GN</strong> ReSound<br />
• <strong>GN</strong> Netcom<br />
• Financial Outlook<br />
2<br />
Slide 2
May 5, 2011<br />
Q1 2011 Group Highlights<br />
<strong>GN</strong> <strong>Store</strong> <strong>Nord</strong><br />
• 7% organic growth driven by ReSound Alera<br />
and Unified Communications<br />
• EBITA improved by DKK 11 million compared to<br />
Q1 2010. EBITA impacted by a duty/tax-related DKK<br />
25 million one-time provision<br />
• EBITA guidance maintained at DKK 675-775 million<br />
<strong>GN</strong> ReSound<br />
• 9% organic growth driven by ReSound Alera<br />
• Excluding the duty/tax-related one-time provision,<br />
EBITA increased by DKK 7 million<br />
<strong>GN</strong> Netcom<br />
• 15% organic growth for CC&O. Mobile Headsets<br />
was as expected affected by a weak market in NA<br />
• EBITA more than doubled compared to Q1 2010<br />
Group financials<br />
(DKK million)<br />
0<br />
Q1<br />
2011<br />
Q1<br />
2010<br />
Revenue 1,298 1,174<br />
Organic Growth 7% 2%<br />
Gross profit 774 662<br />
Gross margin 60% 56%<br />
EBITA 97 86<br />
EBITA margin 7% 7%<br />
Net Profit 54 58<br />
Free Cash Flow -27 58<br />
ROIC* 10% 3%<br />
* Excl. TPSA award<br />
3<br />
Slide 3
May 5, 2011<br />
Update on Arbitration Case Against TPSA<br />
Latest development<br />
• TPSA’s challenge of the Arbitrators’ integrity was dismissed by the<br />
President of the Austrian Federal Economic Chamber on April 12, 2011<br />
• The first hearing in the challenge proceedings filed by TPSA in Austria<br />
took place on March 30, 2011. The court ordered a further exchange of<br />
submissions and scheduled the final hearing for September 8, 2011<br />
• The deadline for TPSA to respond to the claim for phase 2 which DPTG<br />
filed in January is set to May 27, 2011. On June 10, 2011 there will be a<br />
planning meeting discussing the upcoming steps in the arbitration<br />
• In relation to DPTG’s enforcement proceedings in Poland, DPTG is in the<br />
process of preparing the submission for the next hearing which will be<br />
conducted in Q3, 2011<br />
4<br />
Slide 4
May 5, 2011<br />
Agenda<br />
• Q1 2011 Highlights<br />
• <strong>GN</strong> ReSound<br />
• <strong>GN</strong> Netcom<br />
• Financial Outlook<br />
5<br />
Slide 5
May 5, 2011<br />
<strong>GN</strong> ReSound – Key Financials<br />
- 9% organic growth in Q1 2011 driven by a strong 23%<br />
growth in North America<br />
DKK million Q1 2010 Q2 2010 Q3 2010 Q4 2010 FY 2010 Q1 2011<br />
Revenue 726 789 794 855 3,164 820<br />
Organic growth (2)% 0% 5% 5% 2% 9%<br />
Gross margin 59% 59% 60% 61% 60% 60%<br />
SG&A, R&D etc. (359) (399) (406) (390) (1,554) (442)<br />
EBITA 70 63 68 128 329 52<br />
EBITA margin 9.6% 8.0% 8.6% 15.0% 10.4% 6.3%<br />
Free cash flow excl.<br />
tax & financials<br />
26 (8) (6) 57 69 (47)<br />
• Strongest quarterly organic growth in more than 2 years<br />
• As expected margins were relatively soft in Q1<br />
• Cash flow was negatively affected by a temporary increase in inventories<br />
6<br />
Slide 6
May 5, 2011<br />
Temporary Soft Margins in Q1<br />
Key comments<br />
EBITA was affected by:<br />
• One-time duty/tax provision of<br />
DKK 25 million<br />
• Launch costs related to ReSound<br />
Alera Wave 2<br />
• Other growth related initiatives,<br />
including R&D<br />
EBITA (DKK million)<br />
0<br />
7<br />
Slide 7
May 5, 2011<br />
The Launch of ReSound Alera Wave 2<br />
- Encouraging initial development<br />
Key comments<br />
• The launch of ReSound Alera<br />
Wave 2 did only have partial<br />
effect in Q1 as the launch was<br />
conducted during the quarter<br />
• The initial launch development is<br />
very encouraging proving that a<br />
full portfolio is pivotal for<br />
capturing new customers<br />
• ReSound Alera Wave 2 will be<br />
available for VA from May, 2011<br />
ReSound Alera Wave 2<br />
ReSound Alera fusion BTE:<br />
• The world’s first fusion BTE Standard<br />
and power BTE in one device<br />
• Size of a standard BTE<br />
makes it an exceptional<br />
small power BTE<br />
• Open and closed fittings<br />
0<br />
ReSound Alera custom remote mic:<br />
• Significant benefits due to the natural<br />
location of the external microphone<br />
• Elimination of<br />
wind noise<br />
• Improved<br />
speech clarity<br />
8<br />
Slide 8
May 5, 2011<br />
Wave 1<br />
ReSound Alera - A Complete Family<br />
- Wave 3 announced at AudiologyNOW! 2011<br />
Launched Q3, 2010<br />
Form factors<br />
- Receiver-In-the-Ear<br />
Wave 2<br />
Launched Q1, 2011<br />
Form factors<br />
- Behind-The-Ear<br />
- Custom Remote Mic<br />
Wave 3<br />
To be launched Q3, 2011<br />
Form factors<br />
- Mini Behind-The-Ear<br />
- Custom Products<br />
Market addressed by ReSound Alera<br />
Wave 3<br />
~25%<br />
Wave 2<br />
~35%<br />
Wave 1<br />
RIE: ~30%<br />
Based on current form factor preferences<br />
9<br />
Slide 9
May 5, 2011<br />
Gaining Market Share in the US<br />
- And the US market grew at healthy rates in Q1<br />
US unit market growth<br />
* Source: Hearing Industries Association<br />
0<br />
<strong>GN</strong> ReSound<br />
US market share in units<br />
* Source: Hearing Industries Association<br />
23% organic Q1 growth in <strong>GN</strong> ReSound North America<br />
0<br />
10<br />
Slide 10
May 5, 2011<br />
Encouraging Performance in Europe<br />
Key comments<br />
Disregarding tender markets,<br />
Germany, and France:<br />
• Europe organic growth was solid,<br />
driven by ReSound Alera<br />
• Solid ReSound Alera volumes in<br />
Europe compared to the US market<br />
Accumulated ReSound Alera<br />
units since launch<br />
100%<br />
> 70% of<br />
US units<br />
*Excluding tender markets, Germany, and France<br />
11<br />
Slide 11
May 5, 2011<br />
Q1 2011<br />
Strong Top-line Momentum<br />
- Driven by successful product launches for both Hearing<br />
Instruments and Otometrics<br />
Revenue split on business areas<br />
11%<br />
89%<br />
Hearing Instruments Otometrics<br />
12<br />
Slide 12
May 5, 2011<br />
Otometrics Product Launches<br />
- The new AURICAL underpins Otometrics’ strong market<br />
position within hearing instrument fitting<br />
Key comments<br />
• Otometrics has conducted a<br />
comprehensive and successful<br />
turnaround<br />
• Average organic growth in the last four<br />
quarters is 12%<br />
• Revenue growth is driven by successful<br />
product launches<br />
• Growth is broadly founded with strong<br />
growth in all three regions<br />
Recent product launches<br />
The new AURICAL<br />
• Audiometer<br />
• Wireless REM unit<br />
• Loudspeaker<br />
• HIT BOX<br />
• OTOsuite Software<br />
MADSEN AccuScreen<br />
• Reliable and fast<br />
• Touch screen display<br />
• Docking station<br />
• Small and lightweight<br />
• Detailed test and result<br />
screens<br />
13<br />
Slide 13
May 5, 2011<br />
Supply Chain Transformation<br />
- Well on track<br />
• The Supply Chain Transformation is<br />
on track<br />
• The first few countries have<br />
implemented the new model<br />
• As previously communicated, the<br />
EBITA impact for the calendar year<br />
2011 is skewed towards the end of<br />
the year<br />
• Net EBITA impact in Q1 was limited<br />
• The expected net EBITA impact is<br />
unchanged:<br />
• 2011: DKK 75 million<br />
• Run rate end 2011: up to DKK<br />
200 million<br />
The transformation project<br />
Manufacturing<br />
• Consolidate 24 sites<br />
• Simplify<br />
• Enhance service<br />
Warehousing<br />
• Consolidate 24 sites<br />
• Simplify<br />
• Direct ship<br />
Service & Repairs<br />
• Establish swap pool<br />
• Consolidate sites<br />
• Enhance service<br />
14<br />
Slide 14
May 5, 2011<br />
Drivers and Challenges for <strong>GN</strong> ReSound<br />
Key Value Drivers<br />
• Solid long-term market growth<br />
in an industry with attractive<br />
margins<br />
• Continued innovation resulting<br />
in new and groundbreaking<br />
products<br />
• Leverage attractive partner<br />
strategy – including VA<br />
• Strong position in Emerging<br />
markets<br />
• Comprehensive transformation<br />
of the supply chain in 2011<br />
Challenges<br />
• Continue winning top-end share<br />
• Pressure on average prices<br />
• Improve profitability; gain<br />
market share at prudent spend<br />
level<br />
• Shorter product life cycles,<br />
demanding more effective R&D<br />
• Turn around the business and<br />
financial performance in<br />
Germany<br />
15<br />
Slide 15
May 5, 2011<br />
Agenda<br />
• Q1 2011 Highlights<br />
• <strong>GN</strong> ReSound<br />
• <strong>GN</strong> Netcom<br />
• Financial Outlook<br />
16<br />
Slide 16
May 5, 2011<br />
<strong>GN</strong> Netcom – Key Financials<br />
- EBITA more than doubled compared to Q1 2010<br />
DKK million Q1 2010 Q2 2010 Q3 2010 Q4 2010 FY 2010 Q1 2011<br />
Revenue 446 495 452 580 1,973 476<br />
Organic growth 9% 8% 3% 17% 9% 5%<br />
Gross margin 52% 53% 55% 52% 53% 58%<br />
SG&A, R&D etc. (205) (211) (200) (203) (819) (222)<br />
EBITA 26 52 50 96 224 56<br />
EBITA margin 5.8% 10.5% 11.1% 16.6% 11.4% 11.8%<br />
Free cash flow excl.<br />
tax & financial items<br />
59 82 45 47 233 44<br />
• Organic growth driven by a healthy 15% growth in CC&O Headsets<br />
• Growth was negatively impacted by a weak market for Mobile Headsets in North<br />
America<br />
• Gross margins increased 6%-points compared to Q1 2010 reflecting margin<br />
improvements for CC&O Headsets and a more attractive revenue mix<br />
17<br />
Slide 17
May 5, 2011<br />
CC&O Headsets Driving <strong>GN</strong> Netcom Growth<br />
Revenue Q1, 2011<br />
0<br />
0<br />
Revenue split on business areas<br />
28%<br />
Q1 2011<br />
0<br />
CC&O Mobile<br />
72%<br />
18<br />
Slide 18
May 5, 2011<br />
Encouraging CC&O Headsets Performance<br />
– Solid growth at attractive margins<br />
• CC&O Headsets revenue increased<br />
15% compared to Q1 2010<br />
• Driven by UC growth<br />
• Growth in traditional CC&O<br />
Headsets remains robust at levels<br />
in line with historic trend<br />
• CC&O Headsets gross margin<br />
improved 4%-points compared to Q1<br />
2010<br />
• Continued optimization of cost<br />
structure<br />
• Attractive ASP development<br />
Organic growth in CC&O Headsets<br />
19<br />
Slide 19
May 5, 2011<br />
CC&O Market Potential<br />
• UC growth outlook remains attractive. In<br />
connection with their latest interim report,<br />
Microsoft stated that its UC solution grew<br />
30% and that they are seeing ”tremendous<br />
reception to the product”<br />
• The UC growth is an immense opportunity<br />
for headset suppliers<br />
• Due to the projected market growth rate,<br />
new entrants to the market are expected 0 –<br />
although partly mitigated by barriers to<br />
entry related to demanding requirements<br />
within software and sound performance<br />
• For the 2013 targets, <strong>GN</strong> has assumed a<br />
decrease in the CC&O market share and a<br />
gross margin decrease of 10%-points<br />
compared to the current level on large UC<br />
deals. Stronger growth in CC&O Headsets<br />
than Mobile Headsets will support margins<br />
Estimated CC&O market in 2014<br />
Key assumptions:<br />
• 30-45 million UC users<br />
• 60-70% headset attachment rate<br />
• Moderate ASP pressure<br />
• 3-4% growth p.a. in the traditional CC&O market<br />
• 2-3 years life-time for a headset<br />
DKK 4 billion<br />
DKK<br />
8-12<br />
billion<br />
2010 2014<br />
20<br />
Slide 20
May 5, 2011<br />
Mobile Headsets Experienced Soft Q1<br />
- Reflecting weak market development in North America<br />
• The Mobile handsfree market continues<br />
to be volatile on a quarterly basis<br />
• The weak market development in North<br />
America is primarily due to destocking<br />
in the channel of competitor products<br />
• The market development appears more<br />
favorable for the remaining part of the<br />
year<br />
• Revenue will be driven by<br />
continued innovative launches in<br />
the high-end segment<br />
Organic growth in Mobile Headsets<br />
21<br />
Slide 21
May 5, 2011<br />
Jabra FREEWAY Launched in Q1 2011<br />
22<br />
Slide 22
May 5, 2011<br />
Drivers and Challenges for <strong>GN</strong> Netcom<br />
Key Value Drivers Challenges<br />
• Significant mid/long-term market<br />
growth from UC<br />
• Limited additional investments are<br />
required to participate in the<br />
attractive UC opportunity<br />
• Attractive margins in the CC&O<br />
industry<br />
• High operational leverage and low<br />
working capital<br />
• Strong product portfolio from both<br />
Mobile and CC&O Headsets<br />
• Build a long-term sustainable<br />
business model for Mobile<br />
Headsets<br />
• UC drives potential structural<br />
changes to the market place. If<br />
executed well, this creates<br />
attractive opportunities<br />
• Potential ASP pressure on headsets<br />
for UC reflecting larger deals and<br />
increased competition<br />
• Gain market share in North<br />
America<br />
23<br />
Slide 23
May 5, 2011<br />
Agenda<br />
• Q1 2011 Highlights<br />
• <strong>GN</strong> ReSound<br />
• <strong>GN</strong> Netcom<br />
• Financial Outlook<br />
24<br />
Slide 24
May 5, 2011<br />
Outlook for 2011<br />
<strong>GN</strong> Netcom<br />
• The unusual weak market conditions<br />
for Mobile Headsets in Q1, 2011 was<br />
expected and the revenue guidance<br />
is maintained<br />
• Strong performance for CC&O<br />
Headsets in Q1 and continued solid<br />
UC demand during the quarter<br />
indicate the current EBITA guidance<br />
is conservative<br />
• The EBITA guidance range is<br />
upgraded from previously “DKK 250-<br />
300 million” to “DKK 275-325 million”<br />
<strong>GN</strong> ReSound<br />
• Solid top-line momentum in Q1 has<br />
resulted in an adjustment of the<br />
revenue guidance (organic growth)<br />
for 2011 to “more than 6%” versus<br />
previously ”more than 4%”<br />
• As expected, Q1 EBITA was soft and<br />
the business outlook remains<br />
unchanged<br />
• The EBITA guidance is revised in line<br />
with the non-recurring duty/tax<br />
provision of DKK 25 million. The<br />
EBITA guidance is changed from<br />
“DKK 450-500 million” to “DKK 425-<br />
475 million”<br />
25<br />
Slide 25
Revenue<br />
May 5, 2011<br />
Outlook for 2011<br />
- the EBITA guidance for <strong>GN</strong> <strong>Store</strong> <strong>Nord</strong> is unchanged<br />
<strong>GN</strong> Netcom: more than 10% organic growth<br />
<strong>GN</strong> ReSound: more than 6% organic growth<br />
<strong>GN</strong> <strong>Store</strong> <strong>Nord</strong>: more than 7% organic growth<br />
EBITA (DKK/USD 5.5)<br />
<strong>GN</strong> Netcom DKK 275-325 million<br />
<strong>GN</strong> ReSound DKK 425-475 million<br />
Other DKK (30) million<br />
<strong>GN</strong> Total DKK 675-775 million<br />
Amortization, finance etc. DKK (50)-(75)<br />
million<br />
• The guidance is based on a DKK/USD of 5.5. If the<br />
current exchange rate levels remain throughout<br />
2011, group EBITA will be negatively impacted<br />
• The guidance on amortization, finance etc is<br />
changed from “around DKK (50) million” to “DKK<br />
(50)-(75) million” as <strong>GN</strong> has decided to swap the<br />
interest rate on the current debt from floating to<br />
fixed interest rate<br />
DKK million<br />
800<br />
600<br />
400<br />
200<br />
0<br />
EBITA<br />
2007 2008 2009 2010* 2011<br />
Outlook<br />
* Excl. TPSA<br />
26<br />
Slide 26
May 5, 2011<br />
Safe Harbour Statement<br />
The forward-looking statements in this presentation reflect management's<br />
current expectations of certain future events and financial results.<br />
Statements regarding the future are, of course, subject to risks and<br />
uncertainties which may result in material deviations from the outlook set<br />
forth. Furthermore, some of these expectations are based on assumptions<br />
regarding future events which may prove incorrect.<br />
Factors that may cause actual results to deviate materially from expectations<br />
include – but are not limited to – general economic developments and<br />
developments in the financial markets, technological developments, changes<br />
and amendments to legislation and regulations governing <strong>GN</strong>’s markets,<br />
changes in the demand for <strong>GN</strong>'s products, competition, fluctuations in subcontractor<br />
supplies and developments in ongoing litigation (including but not<br />
limited to class action and patent infringement litigation in the United<br />
States).<br />
This presentation should not be considered an offer to sell or buy securities<br />
in <strong>GN</strong> <strong>Store</strong> <strong>Nord</strong>.<br />
27<br />
Slide 27
Q&A
Appendix
May 5, 2011<br />
<strong>GN</strong> Netcom<br />
- Financial Targets<br />
2011 guidance:<br />
• More than 10% organic growth<br />
• EBITA: DKK 275-325 million<br />
2013 targets:<br />
• Revenue: More than DKK 2.6 billion<br />
• EBITA margin: Around 18%<br />
Key assumptions:<br />
• Significant CC&O market growth – driven<br />
by Unified Communications.<br />
• Continued attractive gross margin –<br />
some pressure on ASPs from Unified<br />
Communications.<br />
• Mobile – mid single-digit EBITA margin.<br />
• High operational leverage.<br />
DKK 3,0<br />
billion<br />
2,5<br />
2,0<br />
1,5<br />
1,0<br />
0,5<br />
0,0<br />
20%<br />
15%<br />
10%<br />
5%<br />
0%<br />
-5%<br />
-10%<br />
-15%<br />
<strong>GN</strong> Netcom revenue<br />
<strong>GN</strong> Netcom EBITA margin<br />
More than<br />
2.6<br />
2009 2010 2011 2013<br />
Around<br />
18%<br />
2009 2010 2011 30 2013<br />
Slide 30
May 5, 2011<br />
<strong>GN</strong> ReSound<br />
- Financial Targets<br />
2011 guidance:<br />
• More than 6% organic growth<br />
• EBITA: DKK 425-475 million<br />
2013 targets:<br />
• Revenue: Around DKK 3.7 billion<br />
• EBITA margin: Around 20%<br />
Key assumptions:<br />
• Revenue growth in line with or above the<br />
market<br />
• Average value market growth of 3-5%<br />
per year<br />
• Stronger presence in top-end segment.<br />
• Supply chain transformation delivering<br />
up to DKK 200 million in cost reductions<br />
by end 2011<br />
• High operational leverage – while<br />
investing in cutting-edge technology<br />
DKK<br />
4,0<br />
billion<br />
3,0<br />
2,0<br />
1,0<br />
0,0<br />
25%<br />
20%<br />
15%<br />
10%<br />
5%<br />
0%<br />
<strong>GN</strong> ReSound revenue<br />
<strong>GN</strong> ReSound EBITA margin<br />
Around<br />
3.7<br />
2009 2010 2011 2013<br />
Around<br />
20%<br />
2009 2010 2011 312013<br />
Slide 31
DKK<br />
billion 7,0<br />
6,0<br />
5,0<br />
4,0<br />
3,0<br />
2,0<br />
1,0<br />
0,0<br />
May 5, 2011<br />
Financial Targets<br />
DOUBLING EBITA MARGIN BY 2013<br />
<strong>GN</strong> <strong>Store</strong> <strong>Nord</strong> revenue<br />
More than<br />
6.3<br />
2009 2010 2011 2013<br />
<strong>GN</strong> <strong>Store</strong> <strong>Nord</strong> EBITA margin*<br />
20%<br />
16%<br />
12%<br />
8%<br />
4%<br />
0%<br />
Around<br />
19%<br />
2009 2010 2011 2013<br />
* Excl. TPSA<br />
32<br />
Slide 32
May 5, 2011<br />
The First Two ReSound Alera Launch Waves<br />
Wave 1<br />
Receiver-in-the-ear<br />
Accessories<br />
Fusion BTE<br />
Wave 2<br />
Custom Remote Mic<br />
33
May 5, 2011<br />
Wave 2 in Details<br />
ReSound Alera custom remote mic:<br />
• Significant benefits due to the natural location<br />
of the external microphone<br />
• Elimination of wind noise<br />
• Improved speech clarity<br />
• Smaller than comparable custom models<br />
• Options for truly open fitting<br />
ReSound Alera fusion BTE:<br />
• The world’s first fusion BTE<br />
• Standard and power BTE in one device<br />
• Size of a standard BTE makes it an exceptional small<br />
power BTE<br />
• Open and closed fittings<br />
• Most comfortable power BTE ever<br />
34<br />
Slide 34
May 5, 2011<br />
ReSound Alera Wave 3<br />
Mini BTE Custom products<br />
ReSound Unite mini microphone<br />
35
May 5, 2011<br />
Claim Against German Federal Cartel Office<br />
Background<br />
• On October 2, 2006, <strong>GN</strong> signed an agreement to sell <strong>GN</strong> ReSound to<br />
Sonova for a total consideration of DKK 15.5 billion in cash on a debt and<br />
cash free basis<br />
• In April 2007, the German Federal Cartel Office decided to prohibit the<br />
transaction claiming that the transaction would allegedly result in<br />
collective market dominance in the German market<br />
• On April 20, 2010 the German Federal Supreme Court acknowledged <strong>GN</strong>'s<br />
appeal and overruled the prior decisions from the Oberlandesgericht in<br />
Düsseldorf and the Federal Cartel Office to prohibit the sale of <strong>GN</strong><br />
ReSound to Sonova<br />
Latest development<br />
• On December 22, 2010, <strong>GN</strong> filed a claim of around DKK 8.2 billion at the<br />
District Court (Landesgericht) in Bonn, Germany<br />
• The size of the claim is an estimate of the loss imposed on <strong>GN</strong> in<br />
connection with the German Federal Cartel Office’s illegal prohibition of<br />
the sale of <strong>GN</strong> ReSound<br />
• The defense brief from the Federal Cartel Office is due on June 21, 2011<br />
36<br />
Slide 36
May 5, 2011<br />
<strong>GN</strong> <strong>Store</strong> <strong>Nord</strong> – Income Statement<br />
DKK million Q1 2010 Q2 2010 Q3 2010 Q4 2010 FY 2010 Q1 2011<br />
Revenue 1,174 1,286 1,248 1,437 5,145 1,298<br />
Gross Profit 662 727 726 819 2,934 774<br />
SG&A, R&D etc. (576) (614) 1,462 (611) (339) (677)<br />
EBITA 86 113 2,188 208 2,595 97<br />
Amortisation,<br />
finance, etc.<br />
(7) (9) (16) (27) (59) (21)<br />
EBT 79 104 2,172 181 2,536 76<br />
37<br />
Slide 37
May 5, 2011<br />
<strong>GN</strong> <strong>Store</strong> <strong>Nord</strong> – Balance Sheet<br />
Balance sheet (DKK million) Q1 2010 Q2 2010 Q3 2010 FY 2010 Q1 2011<br />
Goodwill 2,754 2,991 2,738 2,861 2,697<br />
Other intangible assets 1,158 1,184 1,170 1,170 1,160<br />
Tangible & other non-current<br />
assets<br />
1,349 1,402 1,328 1,285 1,218<br />
Current assets 2,099 2,250 4,322 4,490 4,499<br />
Equity 4,684 5,006 6,245 6,504 6,182<br />
Liabilities 2,676 2,821 3,313 3,302 3,392<br />
Total assets 7,360 7,827 9,558 9,806 9,574<br />
NIBD 987 1,014 994 960 1,127<br />
38<br />
Slide 38
May 5, 2011<br />
<strong>GN</strong> Netcom – Balance Sheet and Cash<br />
Flow<br />
Balance sheet (DKK million)<br />
Q1<br />
2010<br />
Q2<br />
2010<br />
Q3<br />
2010<br />
Q4<br />
2010<br />
FY<br />
2010<br />
Q1<br />
2011<br />
Inventories 74 91 107 93 93 105<br />
Trade receivables 265 288 251 317 317 263<br />
Trade payables 127 168 133 149 149 128<br />
Cash flow (DKK million)<br />
Cash flow before working<br />
capital<br />
Change in working capital<br />
and non-recurring costs paid<br />
Cash flow from investing<br />
activities<br />
Free cash flow excl. tax &<br />
financial items<br />
61 84 70 129 344 73<br />
11 17 (8) (75) (55) (14)<br />
(13) (19) (17) (7) (56) (15)<br />
59 82 45 47 233 44<br />
39<br />
Slide 39
May 5, 2011<br />
<strong>GN</strong> ReSound – Balance Sheet and Cash<br />
Flow<br />
Balance sheet (DKK million)<br />
Q1<br />
2010<br />
Q2<br />
2010<br />
Q3<br />
2010<br />
Q4<br />
2010 FY 2010<br />
Q1<br />
2011<br />
Inventories 312 337 358 378 378 404<br />
Trade receivables 721 738 747 783 783 788<br />
Trade payables 172 202 175 221 221 197<br />
Cash flow (DKK million)<br />
Cash flow before working<br />
capital<br />
Change in working capital<br />
and non-recurring costs paid<br />
Cash flow from investing<br />
activities<br />
Free cash flow excl. tax &<br />
financial items<br />
134 133 115 179 561 113<br />
(66) (59) (42) (45) (212) (92)<br />
(42) (82) (79) (77) (280) (68)<br />
26 (8) (6) 57 69 (47)<br />
40<br />
Slide 40


