

salary-survey-10th-edition

Create successful ePaper yourself
Turn your PDF publications into a flip-book with our unique Google optimized e-Paper software.
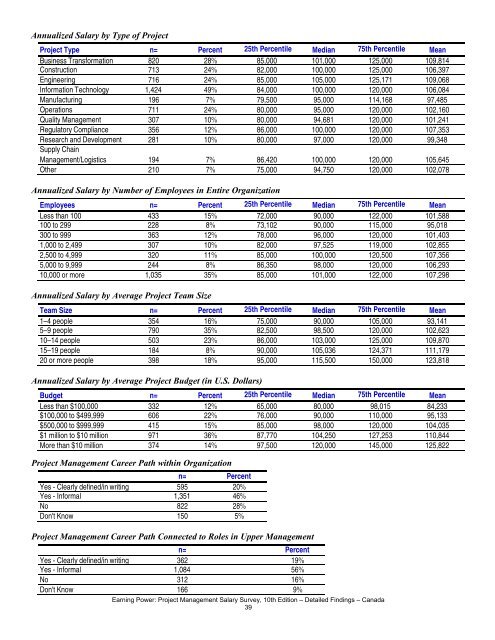
Annualized Salary by Type of Project<br />
Project Type n= Percent 25th Percentile Median 75th Percentile Mean<br />
Business Transformation 820 28% 85,000 101,000 125,000 109,814<br />
Construction 713 24% 82,000 100,000 125,000 106,397<br />
Engineering 716 24% 85,000 105,000 125,171 109,068<br />
Information Technology 1,424 49% 84,000 100,000 120,000 106,084<br />
Manufacturing 196 7% 79,500 95,000 114,168 97,485<br />
Operations 711 24% 80,000 95,000 120,000 102,160<br />
Quality Management 307 10% 80,000 94,681 120,000 101,241<br />
Regulatory Compliance 356 12% 86,000 100,000 120,000 107,353<br />
Research and Development 281 10% 80,000 97,000 120,000 99,348<br />
Supply Chain<br />
Management/Logistics 194 7% 86,420 100,000 120,000 105,645<br />
Other 210 7% 75,000 94,750 120,000 102,078<br />
Annualized Salary by Number of Employees in Entire Organization<br />
Employees n= Percent 25th Percentile Median 75th Percentile Mean<br />
Less than 100 433 15% 72,000 90,000 122,000 101,588<br />
100 to 299 228 8% 73,102 90,000 115,000 95,018<br />
300 to 999 363 12% 78,000 96,000 120,000 101,403<br />
1,000 to 2,499 307 10% 82,000 97,525 119,000 102,855<br />
2,500 to 4,999 320 11% 85,000 100,000 120,500 107,356<br />
5,000 to 9,999 244 8% 86,350 98,000 120,000 106,293<br />
10,000 or more 1,035 35% 85,000 101,000 122,000 107,298<br />
Annualized Salary by Average Project Team Size<br />
Team Size n= Percent 25th Percentile Median 75th Percentile Mean<br />
1–4 people 354 16% 75,000 90,000 105,000 93,141<br />
5–9 people 790 35% 82,500 98,500 120,000 102,623<br />
10–14 people 503 23% 86,000 103,000 125,000 109,870<br />
15–19 people 184 8% 90,000 105,036 124,371 111,179<br />
20 or more people 398 18% 95,000 115,500 150,000 123,818<br />
Annualized Salary by Average Project Budget (in U.S. Dollars)<br />
Budget n= Percent 25th Percentile Median 75th Percentile Mean<br />
Less than $100,000 332 12% 65,000 80,000 98,015 84,233<br />
$100,000 to $499,999 606 22% 76,000 90,000 110,000 95,133<br />
$500,000 to $999,999 415 15% 85,000 98,000 120,000 104,035<br />
$1 million to $10 million 971 36% 87,770 104,250 127,253 110,844<br />
More than $10 million 374 14% 97,500 120,000 145,000 125,822<br />
Project Management Career Path within Organization<br />
n= Percent<br />
Yes - Clearly defined/in writing 595 20%<br />
Yes - Informal 1,351 46%<br />
No 822 28%<br />
Don't Know 150 5%<br />
Project Management Career Path Connected to Roles in Upper Management<br />
n= Percent<br />
Yes - Clearly defined/in writing 362 19%<br />
Yes - Informal 1,084 56%<br />
No 312 16%<br />
Don't Know 166 9%<br />
Earning Power: Project Management Salary Survey, <strong>10th</strong> Edition – Detailed Findings – Canada<br />
39