Trading Report November 2018
Report on trading activity at BSP SouthPool Energy Exchange
Report on trading activity at BSP SouthPool Energy Exchange
- No tags were found...

You also want an ePaper? Increase the reach of your titles
YUMPU automatically turns print PDFs into web optimized ePapers that Google loves.
10 th Anniversary Monthly <strong>Report</strong> – <strong>November</strong> <strong>2018</strong><br />
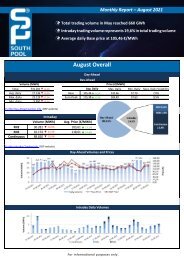
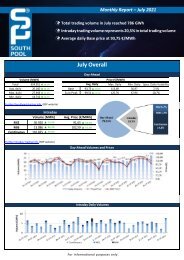
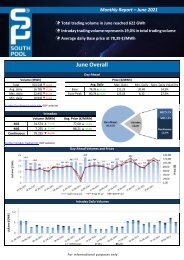
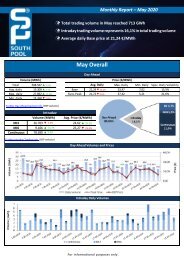
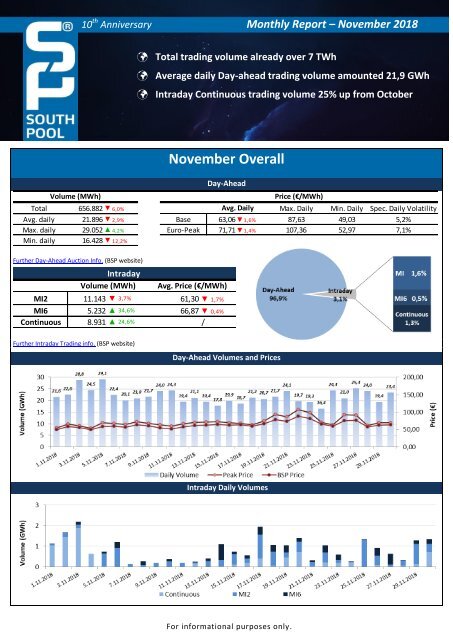
Total trading volume already over 7 TWh<br />
Average daily Day-ahead trading volume amounted 21,9 GWh<br />
Intraday Continuous trading volume 25% up from October<br />
Volume (MWh)<br />
Further Day-Ahead Auction Info. (BSP website)<br />
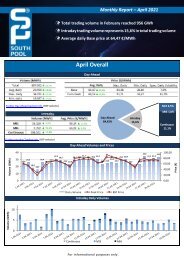
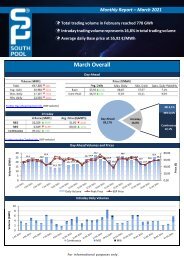
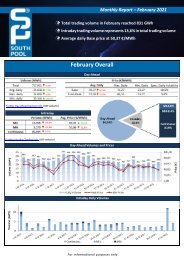
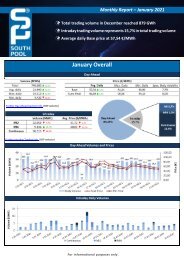
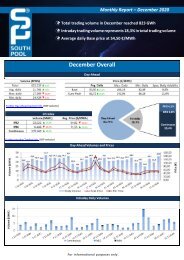
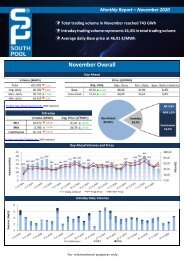
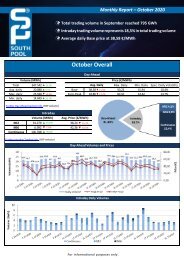
<strong>November</strong> Overall<br />
Day-Ahead<br />
Total 656.882 ▼ 6,0% Avg. Daily Max. Daily Min. Daily Spec. Daily Volatility<br />
Avg. daily 21.896 ▼ 2,9% Base 63,06▼1,6% 87,63 49,03 5,2%<br />
Max. daily 29.052 ▲ 4,2% Euro-Peak 71,71▼1,4% 107,36 52,97 7,1%<br />
Min. daily 16.428 ▼ 12,2%<br />
Intraday<br />
Volume (MWh)<br />
Avg. Price (€/MWh)<br />
MI2 11.143 ▼ 3,7% 61,30 ▼ 1,7%<br />
MI6 5.232 ▲ 34,6% 66,87 ▼ 0,4%<br />
Continuous 8.931 ▲ 24,6% /<br />
Price (€/MWh)<br />
Further Intraday <strong>Trading</strong> info. (BSP website)<br />
Day-Ahead Volumes and Prices<br />
Intraday Daily Volumes<br />
For informational purposes only.
Day-Ahead further Auction info.<br />
Average Hourly Volumes and Prices<br />
Hour (AM) 1 2 3 4 5 6 7 8 9 10 11 12<br />
Volume (MWh) 979 994 1007 1031 966 897 829 869 895 858 888 801<br />
Base price (€/MWh) 49,98 48,94 47,61 46,45 46,53 49,47 58,60 67,23 70,99 70,22 69,36 69,43<br />
Hour (PM) 13 14 15 16 17 18 19 20 21 22 23 24<br />
Volume (MWh) 826 870 839 914 950 945 953 936 904 895 901 947<br />
Daily volatility of base price<br />
Base price (€/MWh) 67,48 67,23 67,49 69,55 73,58 82,45 79,55 73,21 67,75 60,15 57,12 53,15<br />
Cross-Zonal Capacities<br />
SI→IT IT→SI SI→AT AT→SI SI→HR<br />
Offered (MWh) 437.413 481.600 833.889 523.511 772.837 1.243.163 4.292.413<br />
Allocated (MWh) 306.906 29.298 112.982 152.761 76.741 167.972 846.660<br />
% Allocated 70,16% 6,08% 13,55% 29,18% 9,93% 13,51%<br />
Daily Volatility of Base Price<br />
HR→SI<br />
Total<br />
Methodology used for calculation of volatility.<br />
MI2 & MI6 Implicit Auctions<br />
Allocated CZC Values on Slovenian-Italian Border<br />
Cross-Zonal-Capacities<br />
SI-IT IT-SI Total<br />
Offered (MWh) 159.803 380.777 540.580<br />
Allocated (MWh) 2.367 7.217<br />
9.584<br />
% Allocated 1,48% 1,90% /<br />
Read more about European Pilot Project<br />
Implicit Intraday Auctions (MI2 & MI6)<br />
Intraday Continuous <strong>Trading</strong><br />
Volumes by Products<br />
For informational purposes only.
Past 12 Months Trade Information<br />
Day-Ahead Auction<br />
Avg. Monthly Volume (MWh) 615.309<br />
Avg. Daily Volume (MWh) 20.229<br />
Avg. Base Price (€/MWh) 50,41<br />
Avg. Euro-Peak Price (€/MWh) 56,79<br />
Avg. SI-IT offered (MWh)/Avg. % Allocated 396.182 / 83,6%<br />
Avg. IT-SI offered (MWh)/Avg.% Allocated 471.308 / 3,5%<br />
Avg. SI-AT offered (MWh)/Avg. % Allocated 765.768 / 8,4%<br />
Avg. AT-SI offered (MWh)/Avg. % Allocated 346.663 / 42,5%<br />
Avg. SI-HR offered (MWh)/Avg. % Allocated 722.579 / 6,6%<br />
Avg. HR-SI offered (MWh)/Avg. % Allocated 996.381 / 16,2%<br />
Day-Ahead Market Volumes and Prices<br />
Intraday Continuous <strong>Trading</strong><br />
Avg. Monthly Volume (MWh) 11.335<br />
Avg. Nbr. Of Transactions 289<br />
MI2 & MI6 Implicit Auctions<br />
Avg. Monthly volume MI2 (MWh) 12.976<br />
Avg. Monthly volume MI6 (MWh) 4.683<br />
Avg. SI-IT offered (MWh)/Avg. % Allocated 80.959 / 5,5%<br />
Avg. IT-SI offered (MWh)/Avg.% Allocated 356.513 / 1,3%<br />
Intraday Volumes (MWh)<br />
Total Volume in the past 12 months Continuous ■ MI2 ■ MI6 ■<br />
Dec. 17 15.959 17.009 3.557<br />
Jan. 18 18.652 14.053 4.992<br />
Feb. 18 7.702 9.339 3.671<br />
Mar. 18 18.532 7.344 2.275<br />
Apr. 18 17.719 2.060 1.567<br />
May. 18 9.583 13.939 2.206<br />
137.845 131.315<br />
Jun. 18 10.364 17.154 7.369<br />
Jul. 18 4.813 4.634 1.694<br />
Aug. 18 11.295 13.680 5.714<br />
Sep. 18 7.132 9.393 3.883<br />
46.047 Oct. 18 7.166 11.569 3.888<br />
Nov. 18 8.931 11.143 5.232<br />
Absolute Difference Between MI and Day-Ahead Prices & MI Offered Cross-Zonal Capacities<br />
*Cross-Zonal Capacities not allocated on Day-Ahead Auction are later offered for MI2 and MI6 Auctions.<br />
For informational purposes only.
BSP Energy Exchange LL C<br />
Dunajska 156<br />
SI-1000 Ljubljana<br />
Slovenija<br />
+386 1 620 76 76<br />
+386 1 620 76 77<br />
www.bsp-southpool.com<br />
info@bsp-southpool.com<br />
For informational purposes only.