
You also want an ePaper? Increase the reach of your titles
YUMPU automatically turns print PDFs into web optimized ePapers that Google loves.
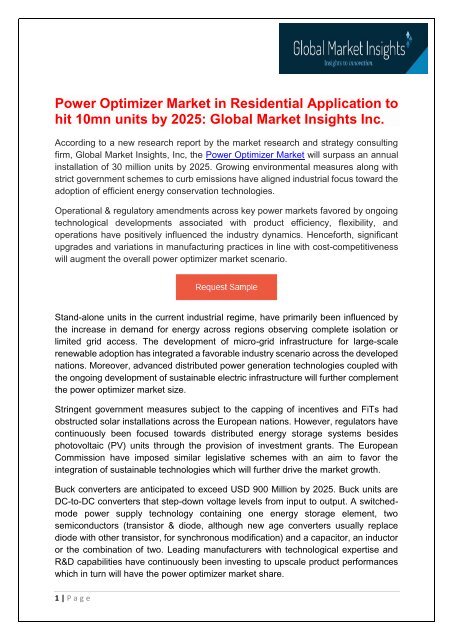
<strong>Power</strong> <strong>Optimizer</strong> <strong>Market</strong> in Residential Application to<br />
hit 10mn units by 2025: Global <strong>Market</strong> Insights Inc.<br />
According to a new research report by the market research and strategy consulting<br />
firm, Global <strong>Market</strong> Insights, Inc, the <strong>Power</strong> <strong>Optimizer</strong> <strong>Market</strong> will surpass an annual<br />
installation of 30 million units by 2025. Growing environmental measures along with<br />
strict government schemes to curb emissions have aligned industrial focus toward the<br />
adoption of efficient energy conservation technologies.<br />
Operational & regulatory amendments across key power markets favored by ongoing<br />
technological developments associated with product efficiency, flexibility, and<br />
operations have positively influenced the industry dynamics. Henceforth, significant<br />
upgrades and variations in manufacturing practices in line with cost-competitiveness<br />
will augment the overall power optimizer market scenario.<br />
Stand-alone units in the current industrial regime, have primarily been influenced by<br />
the increase in demand for energy across regions observing complete isolation or<br />
limited grid access. The development of micro-grid infrastructure for large-scale<br />
renewable adoption has integrated a favorable industry scenario across the developed<br />
nations. Moreover, advanced distributed power generation technologies coupled with<br />
the ongoing development of sustainable electric infrastructure will further complement<br />
the power optimizer market size.<br />
Stringent government measures subject to the capping of incentives and FiTs had<br />
obstructed solar installations across the European nations. However, regulators have<br />
continuously been focused towards distributed energy storage systems besides<br />
photovoltaic (PV) units through the provision of investment grants. The European<br />
Commission have imposed similar legislative schemes with an aim to favor the<br />
integration of sustainable technologies which will further drive the market growth.<br />
Buck converters are anticipated to exceed USD 900 Million by 2025. Buck units are<br />
DC-to-DC converters that step-down voltage levels from input to output. A switchedmode<br />
power supply technology containing one energy storage element, two<br />
semiconductors (transistor & diode, although new age converters usually replace<br />
diode with other transistor, for synchronous modification) and a capacitor, an inductor<br />
or the combination of two. Leading manufacturers with technological expertise and<br />
R&D capabilities have continuously been investing to upscale product performances<br />
which in turn will have the power optimizer market share.<br />
1 | P a g e
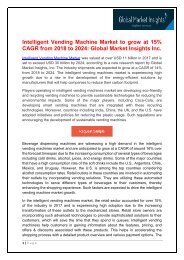
Europe <strong>Power</strong> <strong>Optimizer</strong> <strong>Market</strong> Size, By End Use, 2018 & 2025 (USD Million)<br />
<strong>Optimizer</strong>s have emerged in the power industry as a substitute for module level power<br />
monitoring & management, coagulating the benefits of MPPT with higher operational<br />
efficiencies of string inverters. In addition, features including module mismatch<br />
resonance, alleviation of module shading impact and over or under performing<br />
modules will strengthen the overall market potential.<br />
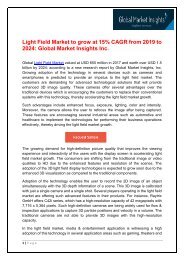
<strong>Power</strong> optimizer market from residential application, is predicted to witness an annual<br />
installation of over 10 million units until 2025. Government subsidies, FiT’s, & net<br />
metering positively influenced by the integration and manufacture of advance<br />
optimizer solutions will further stimulate the product penetration. Furthermore,<br />
government rollout plans & schemes including incremental energy efficiency grant to<br />
support residential roof-top installations will further complement the business outlook.<br />
Eminent market participants include SMA Solar, SolarEdge, Altenergy, Tigo, Ampt,<br />
Huawei, igrenEnergi, Kuby Renewable Energy, Maxim Integrated, Darfon Electronics,<br />
GreenBrilliance, Texas Instruments, Mornsun, Xandex, Alencon, ABB, Ferroamp and<br />
Fronious.<br />
Browse key industry insights spread across 575 pages with 893 market data tables &<br />
45 figures & charts from the report, “<strong>Power</strong> <strong>Optimizer</strong> <strong>Market</strong> Size By Connectivity<br />
(Standalone, On-grid), By Converter (Buck, Boost, Buck-Boost), By Application<br />
(Residential, Commercial, Utility), By End Use (Module Level MPPT, Advanced<br />
<strong>Power</strong> Line Communication, Monitoring Components, Safety Shutdown<br />
Components, Others) Industry Analysis Report, Regional Outlook (U.S.,<br />
Canada, Mexico, UK, France, Netherlands, Italy, Germany, Sweden, Russia,<br />
Spain, Austria, Ireland, Finland, Denmark, Belgium, Norway, Ukraine, China,<br />
2 | P a g e
Australia, India, Japan, South Korea, Thailand, Malaysia, Philippines, Cambodia,<br />
Saudi Arabia, UAE, South Africa, Turkey, Israel, Iran, Egypt, Yemen, Jordan,<br />
Morocco, Algeria, Brazil, Chile) Application Development Potential, Price Trend,<br />
Competitive <strong>Market</strong> Share & Forecast, 2019 – 2025” in detail along with the table<br />
of contents:<br />
https://bit.ly/2RGGOeq<br />
U.S. <strong>Power</strong> <strong>Optimizer</strong> Industry, By Application (USD Million)<br />
Table of Content (TOC-)<br />
Chapter 1<br />
Methodology & Scope<br />
1.1 Methodology<br />
1.2 <strong>Market</strong> definitions<br />
1.3 <strong>Market</strong> estimation and forecast parameters<br />
1.4 Data Sources<br />
1.4.1 Primary sources:<br />
1.4.2 Secondary sources<br />
1.4.2.1 Paid Sources<br />
3 | P a g e
1.4.2.2 Public Sources<br />
Chapter 2<br />
Executive Summary<br />
2.1 Global power optimizer market 360 0 synopsis, 2014 – 2025<br />
2.1.1 Business trends<br />
2.1.2 Connectivity trends<br />
2.1.3 Converter trends<br />
2.1.4 Application trends<br />
2.1.5 End use trends<br />
2.1.6 Regional trends<br />
Chapter 3<br />
Global <strong>Power</strong> <strong>Optimizer</strong> Industry Insights<br />
3.1 Industry segmentation<br />
3.2 Industry landscape, 2014 – 2025 (USD Million)<br />
3.3 Industry ecosystem analysis<br />
3.3.1 Vendor Matrix<br />
3.4 Technology & innovation landscape<br />
3.4.1 SolarEdge<br />
3.4.2 Tigo<br />
3.4.3 GreenBrilliance<br />
3.5 Regulatory Landscape<br />
3.5.1 U.S.<br />
3.5.1.1 U.S. Feed-in Tariff Programs<br />
3.5.2 Brazil<br />
3.5.2.1 Brazil Renewable Energy Targets<br />
4 | P a g e
3.5.3 Japan<br />
3.5.4 UK<br />
3.5.4.1 The UK’s National Energy Efficiency Action Plan<br />
3.5.4.2 Feed-In Tariff (FIT)<br />
3.5.4.3 Export Feed-In Tariff (FIT)<br />
3.5.5 Spain<br />
3.5.5.1 Spain’s Second Renewable Energy Auction 2017<br />
3.5.5.2 Support schemes<br />
3.5.5.3 Policies<br />
3.5.6 Mexico<br />
3.5.7 Smart Inverters<br />
3.5.7.1 Rule 21<br />
3.5.7.1.1 Applicability<br />
3.5.7.1.2 Overview of Tariff Provisions<br />
3.6 Feed in Tariff landscape<br />
3.7 Price trend analysis<br />
3.7.1 Cost structure analysis<br />
3.7.2 Price Learning Curve for PV technologies<br />
3.7.3 Capital cost breakdown analysis for solar PV plant, 2018<br />
3.8 Leading investment scenario in the solar industry, 2018 & 2017<br />
3.8.1 India<br />
3.8.2 China<br />
3.8.3 Chile<br />
5 | P a g e
6 | P a g e<br />
3.8.4 Saudi Arabia<br />
3.8.5 Egypt<br />
3.8.6 Russia<br />
3.8.7 Australia<br />
3.9 Invested capital in RE <strong>Market</strong>, 2018<br />
3.10 Investments across the global clean energy sector (USD Billion), 2017<br />
3.10.1 Investments across the global clean energy sector (USD Billion)<br />
3.10.2 Investments across the global clean energy sector, by region<br />
(USD Billion)<br />
3.10.3 Investments across the global clean energy sector, by technology<br />
(USD Billion)<br />
3.10.4 Investments across the global clean energy sector, by investment<br />
stage (USD Billion)<br />
3.10.5 VC/PE investments in clean energy sector, (USD Billion)<br />
3.10.6 Major VC/PE transactions, 2016<br />
3.10.7 Major VC/PE transactions, 2017<br />
3.11 Capex & Opex trend prevailing across solar PV industry<br />
3.11.1 U.S.<br />
3.11.1.1 Capex<br />
3.11.1.2 Opex<br />
3.11.2 Brazil<br />
3.11.2.1 Capex<br />
3.11.2.2 Opex<br />
3.11.3 Australia<br />
3.11.3.1 Capex
3.11.3.2 Opex<br />
3.11.4 Indonesia<br />
3.11.4.1 Capex<br />
3.11.4.2 Opex<br />
3.11.5 Mexico<br />
3.11.5.1 Capex<br />
3.11.5.2 Opex<br />
3.11.6 Vietnam<br />
3.11.6.1 Capex<br />
3.11.6.2 Opex<br />
3.12 LCOE trend<br />
3.12.1 U.S.<br />
3.12.2 Brazil<br />
3.12.3 Australia<br />
3.12.4 Japan<br />
3.12.5 Indonesia<br />
3.12.6 Mexico<br />
3.12.7 Vietnam<br />
3.13 Equity IRRs/financial returns of PV plants across major countries<br />
3.13.1 U.S.<br />
3.13.1.1 Assumptions<br />
3.13.2 Brazil<br />
3.13.2.1 Assumptions<br />
7 | P a g e
3.13.3 Australia<br />
3.13.3.1 Assumption<br />
3.13.3.2 IRR prevailing across key region (Australia)<br />
3.13.4 Japan<br />
3.13.4.1 Assumption<br />
3.14 Global average energy cost<br />
3.15 Average Solar PV CUF/PLF trend across leading countries<br />
3.15.1 U.S.<br />
3.15.2 Brazil<br />
3.15.3 Australia<br />
3.15.4 Japan<br />
3.16 Solar grid parity status<br />
3.17 Key Investors across solar PV industry<br />
3.18 Key Customer requirements<br />
3.19 Customer group requirement<br />
3.19.1 Residential & Commercial<br />
3.19.2 Industrial<br />
3.20 Entry barrier<br />
3.21 Degree of industrial competition<br />
3.21.1 North America<br />
3.21.2 Europe<br />
3.21.3 Asia Pacific<br />
3.21.4 Middle East<br />
8 | P a g e
9 | P a g e<br />
3.21.5 Africa<br />
3.21.6 Latin America<br />
3.22 Industry impact forces<br />
3.22.1 Growth drivers<br />
3.22.1.1 North America & Europe<br />
3.22.1.1.1 Positive clean energy outlook<br />
3.22.1.1.2 Favorable regulatory inclination towards<br />
sustainable energy<br />
3.22.1.2 Asia Pacific<br />
3.22.1.2.1 Large-scale renewable integration<br />
3.22.1.2.2 Growing energy demand across isolated areas<br />
3.22.1.3 Middle East & Africa<br />
3.22.1.3.1 Restructuring & revamping of existing electrical<br />
infrastructure<br />
3.22.1.3.2 Large scale renewable integration prospects<br />
3.22.1.4 Latin America<br />
3.22.2 Restraint<br />
3.22.1.4.1 Integration of a sustainable energy<br />
infrastructure<br />
3.22.2.1 Availability of auxiliary technologies<br />
3.23 Growth potential analysis<br />
3.24 Porter’s Analysis<br />
3.25 Competitive landscape, 2018<br />
3.25.1 Strategy Dashboard<br />
3.25.1.1 SolarEdge Technologies
3.25.1.2 ABB<br />
3.25.1.3 SMA Solar Technology<br />
3.25.1.4 Tigo Energy<br />
3.25.1.5 igrenEnergi<br />
3.26 PESTEL analysis<br />
Industry Coverage<br />
10 | P a g e
About Global <strong>Market</strong> Insights<br />
Global <strong>Market</strong> Insights, Inc., headquartered in Delaware, U.S., is a global market<br />
research and consulting service provider; offering syndicated and custom research<br />
reports along with growth consulting services. Our business intelligence and industry<br />
research reports offer clients with penetrative insights and actionable market data<br />
specially designed and presented to aid strategic decision making. These exhaustive<br />
reports are designed via a proprietary research methodology and are available for key<br />
industries such as chemicals, advanced materials, technology, renewable energy and<br />
biotechnology.<br />
Contact Us:<br />
Arun Hegde<br />
Corporate Sales, USA<br />
Global <strong>Market</strong> Insights, Inc.<br />
Phone: 1-302-846-7766<br />
Toll Free: 1-888-689-0688<br />
Email: sales@gminsights.com<br />
Web: https://www.gminsights.com<br />
Blog: www.industry-source.org<br />
11 | P a g e