SPICE User's Guide - IRSA
SPICE User's Guide - IRSA
SPICE User's Guide - IRSA

You also want an ePaper? Increase the reach of your titles
YUMPU automatically turns print PDFs into web optimized ePapers that Google loves.
SP ICE User’s <strong>Guide</strong><br />
pixels that comprise each wavelength in the spectrum. You should choose the appropriate<br />
file in the cal/ subdirectory of your <strong>SPICE</strong> installation. The file you choose should match<br />
both the Spitzer pipeline version with which your data were processed, and the IRS<br />
module with which you are working.<br />
-c The Profile module divides each pseudorectangle into this number of cuts and integrates<br />
the signal within each cut. Allowed values are integers between 1 and 2000. We<br />
recommend that users keep this at the default value (1000 for SL and LL modules, 200<br />
for SH and LH) adopted by the <strong>SPICE</strong> GUI.<br />
-m Size of sliding median. Allowed values are odd integers between 1 and 21. Default value<br />
is 7.<br />
-v Level of verbosity, integer. Default value is 1<br />
-ord This selects which orders are included in the median-combined profile. The default is to<br />
include only the targeted orders in the profile. For hi-res observations, this is all orders,<br />
but for lo-res observations it is usually not. You can specify up to 14 comma-separated<br />
integers – no spaces, where the lo-res orders are designated as 1, 2 and 3, and the hi-res<br />
ones run from 11-20.<br />
-n Name of a namelist file listing all the input parameters. This can be used instead of<br />
specifying all of the flags on the command line. Default is namelist.nl.<br />
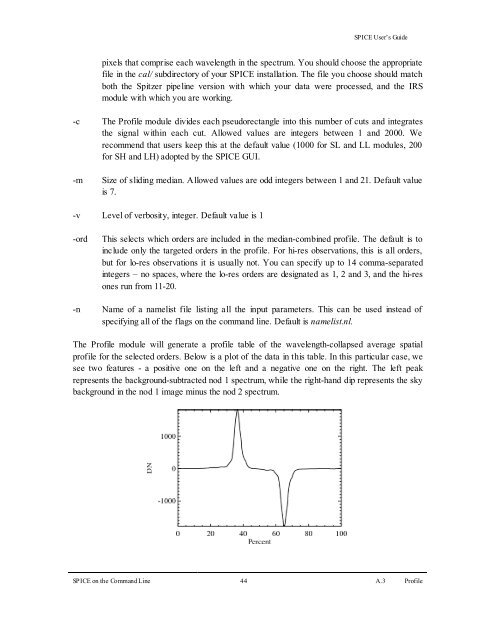
The Profile module will generate a profile table of the wavelength-collapsed average spatial<br />
profile for the selected orders. Below is a plot of the data in this table. In this particular case, we<br />
see two features - a positive one on the left and a negative one on the right. The left peak<br />
represents the background-subtracted nod 1 spectrum, while the right-hand dip represents the sky<br />
background in the nod 1 image minus the nod 2 spectrum.<br />
<strong>SPICE</strong> on the Command Line 44 A.3 Profile