FOCUS Oregon V2 I1
FOCUS Oregon. Oregon Professional Photographers Association Quarterly Magazine.
FOCUS Oregon. Oregon Professional Photographers Association Quarterly Magazine.

You also want an ePaper? Increase the reach of your titles
YUMPU automatically turns print PDFs into web optimized ePapers that Google loves.
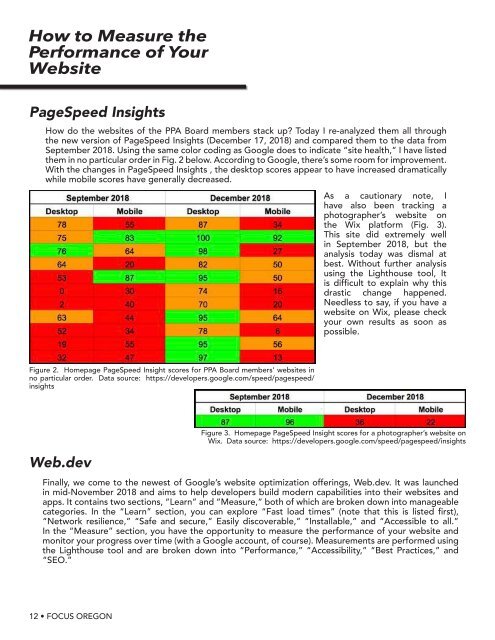
PageSpeed Insights<br />
How do the websites of the PPA Board members stack up? Today I re-analyzed them all through<br />
the new version of PageSpeed Insights (December 17, 2018) and compared them to the data from<br />
September 2018. Using the same color coding as Google does to indicate “site health,” I have listed<br />
them in no particular order in Fig. 2 below. According to Google, there’s some room for improvement.<br />
With the changes in PageSpeed Insights , the desktop scores appear to have increased dramatically<br />
while mobile scores have generally decreased.<br />
Figure 2. Homepage PageSpeed Insight scores for PPA Board members’ websites in<br />
no particular order. Data source: https://developers.google.com/speed/pagespeed/<br />
insights<br />
Web.dev<br />
As a cautionary note, I<br />
have also been tracking a<br />
photographer’s website on<br />
the Wix platform (Fig. 3).<br />
This site did extremely well<br />
in September 2018, but the<br />
analysis today was dismal at<br />
best. Without further analysis<br />
using the Lighthouse tool, It<br />
is difficult to explain why this<br />
drastic change happened.<br />
Needless to say, if you have a<br />
website on Wix, please check<br />
your own results as soon as<br />
possible.<br />
Figure 3. Homepage PageSpeed Insight scores for a photographer’s website on<br />
Wix. Data source: https://developers.google.com/speed/pagespeed/insights<br />
Finally, we come to the newest of Google’s website optimization offerings, Web.dev. It was launched<br />
in mid-November 2018 and aims to help developers build modern capabilities into their websites and<br />
apps. It contains two sections, “Learn” and “Measure,” both of which are broken down into manageable<br />
categories. In the “Learn” section, you can explore “Fast load times” (note that this is listed first),<br />
“Network resilience,” “Safe and secure,” Easily discoverable,” “Installable,” and “Accessible to all.”<br />
In the “Measure” section, you have the opportunity to measure the performance of your website and<br />
monitor your progress over time (with a Google account, of course). Measurements are performed using<br />
the Lighthouse tool and are broken down into “Performance,” “Accessibility,” “Best Practices,” and<br />
“SEO.”<br />
The workflow comes next, and includes 1) “Audit your web page,” 2) “Analyze for improvements,”<br />
and 3) “Learn how to fit it.” Once you plug in a URL, this tool will run Lighthouse and provide you<br />
with a detailed listing of metrics for 1) performance, 2) progressive web app, 3) best practices, 4)<br />
SEO, and 5) accessibility. If you have never heard of “progressive web apps,” don’t worry, you’re not<br />
alone. PWA is basically a means by which an app or a website can be viewed and used while a device<br />
is offline, allowing for a seamless experience even when the user is disconnected from the Internet.<br />
If you’re running WordPress, as usual, there’s a plugin for it called, Super PWA.<br />
Keep in mind that Web.dev is not for the faint of heart. It will give you an overwhelming amount of<br />
data about your website. Do not try to fix everything all at once. Try to pick one or two of the most<br />
important things to fix, and start there. You will never get perfect scores, but every little bit you can<br />
improve will help your SEO.<br />
Pingdom<br />
One of the old standby website performance analysis tools is Pingdom from Solar Winds. You can<br />
access the free version at https://tools.pingdom.com. Pingdom allows you to analyze your website<br />
from seven locations around the world, so pick one that is closest to your server’s physical location and<br />
your target audience. The free version is fairly limited and gives you four pieces of basic information<br />
(Fig. 4):<br />
The “performance grade” from Pingdom is basically<br />
your website’s grade from YSlow and gives you a relative<br />
measure of how you compare to other websites. YSlow<br />
is based on Yahoo’s rules for high performance websites<br />
and has been incorporated into both Pingdom and<br />
GTMetrix. You can also install an extension for it in most<br />
modern browsers (http://yslow.org). Pingdom’s “page<br />
size” is simply a measure of how much data has to be<br />
transmitted from the server to the browser. You want to<br />
keep this as small as possible. The “load time” simply<br />
Figure 4. Pingdom analysis of https://google.com<br />
tells you how fast Pingdom was able to load your data<br />
at your selected location. Finally, the “requests” tells<br />
you how many times the browser had to request an “asset” (file, image, video, etc.) in order to<br />
completely render the page. The more times the browser has to request an asset that requires<br />
round-trip communication between the browser and the server, the slower your website will load.<br />
It also makes a few limited suggestions to improve performance, but beyond that, you will get into<br />
Pingdom’s paid service.<br />
GTMetrix<br />
GTMetrix is one of my favorite tools because of the amount of information it gives you about how<br />
to improve your website. It also allows you to sign up for a free account from which you can run<br />
regular reports on your website and compare your results over time. The folks at GTMetrix have also<br />
provided several resource guides, including one for optimizing WordPress. GTMetrix gives you results<br />
for both Google’s PageSpeed and Yahoo’s YSlow. However, Google has not updated the PageSpeed<br />
Insights SDK in quite some time, so the version used by GTMetrix will yield different results than<br />
Lighthouse. One of the great things about GTMetrix is that it ranks its recommendations in order of<br />
priority. The biggest improvements in performance will come from this tool’s top recommendations.<br />
12 • <strong>FOCUS</strong> OREGON<br />
WINTER 2019 <strong>FOCUS</strong> OREGON • 13