Global Reefer Truck Market to Grow at 9% until 2023 | TechSci Research
Global reefer truck market stood at around USD 7 billion in 2017 and is forecast to grow at a CAGR of over 9% to reach $ 11.6 billion by 2023.
Global reefer truck market stood at around USD 7 billion in 2017 and is forecast to grow at a CAGR of over 9% to reach $ 11.6 billion by 2023.

You also want an ePaper? Increase the reach of your titles
YUMPU automatically turns print PDFs into web optimized ePapers that Google loves.
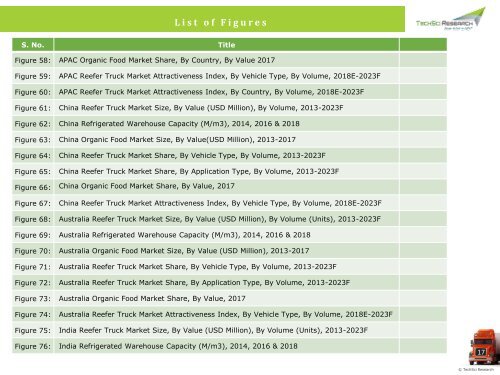
L i s t o f F i g u r e s<br />
S. No. Title<br />
Figure 58: APAC Organic Food <strong>Market</strong> Share, By Country, By Value 2017<br />
Figure 59:<br />
Figure 60:<br />
APAC <strong>Reefer</strong> <strong>Truck</strong> <strong>Market</strong> Attractiveness Index, By Vehicle Type, By Volume, 2018E-<strong>2023</strong>F<br />
APAC <strong>Reefer</strong> <strong>Truck</strong> <strong>Market</strong> Attractiveness Index, By Country, By Volume, 2018E-<strong>2023</strong>F<br />
Figure 61: China <strong>Reefer</strong> <strong>Truck</strong> <strong>Market</strong> Size, By Value (USD Million), By Volume, 2013-<strong>2023</strong>F<br />
Figure 62: China Refriger<strong>at</strong>ed Warehouse Capacity (M/m3), 2014, 2016 & 2018<br />
Figure 63: China Organic Food <strong>Market</strong> Size, By Value(USD Million), 2013-2017<br />
Figure 64: China <strong>Reefer</strong> <strong>Truck</strong> <strong>Market</strong> Share, By Vehicle Type, By Volume, 2013-<strong>2023</strong>F<br />
Figure 65: China <strong>Reefer</strong> <strong>Truck</strong> <strong>Market</strong> Share, By Applic<strong>at</strong>ion Type, By Volume, 2013-<strong>2023</strong>F<br />
Figure 66: China Organic Food <strong>Market</strong> Share, By Value, 2017<br />
Figure 67:<br />
China <strong>Reefer</strong> <strong>Truck</strong> <strong>Market</strong> Attractiveness Index, By Vehicle Type, By Volume, 2018E-<strong>2023</strong>F<br />
Figure 68: Australia <strong>Reefer</strong> <strong>Truck</strong> <strong>Market</strong> Size, By Value (USD Million), By Volume (Units), 2013-<strong>2023</strong>F<br />
Figure 69: Australia Refriger<strong>at</strong>ed Warehouse Capacity (M/m3), 2014, 2016 & 2018<br />
Figure 70: Australia Organic Food <strong>Market</strong> Size, By Value (USD Million), 2013-2017<br />
Figure 71: Australia <strong>Reefer</strong> <strong>Truck</strong> <strong>Market</strong> Share, By Vehicle Type, By Volume, 2013-<strong>2023</strong>F<br />
Figure 72: Australia <strong>Reefer</strong> <strong>Truck</strong> <strong>Market</strong> Share, By Applic<strong>at</strong>ion Type, By Volume, 2013-<strong>2023</strong>F<br />
Figure 73: Australia Organic Food <strong>Market</strong> Share, By Value, 2017<br />
Figure 74:<br />
Australia <strong>Reefer</strong> <strong>Truck</strong> <strong>Market</strong> Attractiveness Index, By Vehicle Type, By Volume, 2018E-<strong>2023</strong>F<br />
Figure 75: India <strong>Reefer</strong> <strong>Truck</strong> <strong>Market</strong> Size, By Value (USD Million), By Volume (Units), 2013-<strong>2023</strong>F<br />
Figure 76: India Refriger<strong>at</strong>ed Warehouse Capacity (M/m3), 2014, 2016 & 2018<br />
17<br />
© <strong>TechSci</strong> <strong>Research</strong>