PCC March 2019

Create successful ePaper yourself
Turn your PDF publications into a flip-book with our unique Google optimized e-Paper software.
<strong>March</strong>/April <strong>2019</strong><br />
Redefining IPM for the 21st Century<br />
Kasugamycin for<br />
Managing Walnut Blight<br />
How does kasugamycin-copper or -mancozeb<br />
mixtures compare to copper-mancozeb?<br />
Moving Toward Alternatives to Chlorpyrifos for<br />
Managing Maggots in Onions<br />
The Carbohydrate Observatory: A<br />
Citizen Science Research Project<br />
Understanding seasonal trends of starch and sugar<br />
in walnut, pistachio and almond under varying<br />
climatic conditions.<br />
Volume 4 : Issue 2<br />
<strong>March</strong>/April <strong>2019</strong><br />
www.progressivecrop.com<br />
1
2 Progressive Crop Consultant <strong>March</strong>/April <strong>2019</strong>
4<br />
IN THIS ISSUE<br />
Redefining IPM for the<br />
21st Century<br />
PUBLISHER: Jason Scott<br />
Email: jason@jcsmarketinginc.com<br />
EDITOR: Kathy Coatney<br />
ASSOCIATE EDITOR: Cecilia Parsons<br />
Email: article@jcsmarketinginc.com<br />
PRODUCTION: design@jcsmarketinginc.com<br />
Phone: 559.352.4456<br />
Fax: 559.472.3113<br />
Web: www.progressivecrop.com<br />
12<br />
16<br />
20<br />
26<br />
34<br />
Kasugamycin for<br />
Managing Walnut Blight-<br />
How does kasugamycincopper<br />
or -mancozeb<br />
mixtures compare to<br />
copper-mancozeb?<br />
Moving Toward<br />
Alternatives to Chlorpyrifos<br />
for Managing Maggots in<br />
Onions<br />
The Carbohydrate<br />
Observatory: A Citizen<br />
Science Research Project<br />
-Understanding seasonal<br />
trends of starch and sugar<br />
in walnut, pistachio and<br />
almond under varying<br />
climatic conditions.<br />
Climate Change and<br />
California Agriculture<br />
The Many Possible<br />
Causes of “Gummy<br />
Nuts” in Almonds<br />
12<br />
16<br />
34<br />
CONTRIBUTING WRITERS &<br />
INDUSTRY SUPPORT<br />
J. E. Adaskaveg<br />
Department of<br />
Microbiology and Plant<br />
Pathology, University of<br />
California, Riverside, CA, L.<br />
Wade, Arysta Life Science,<br />
Roseville, CA<br />
Surendra K. Dara<br />
CE Advisor—Entomology<br />
and Biologicals, University<br />
of California Cooperative<br />
Extension, San Luis Obispo<br />
and Santa Barbara counties<br />
Anna Davidson<br />
Postdoc, Manager of the<br />
Carbohydrate Observatory<br />
Maciej Zwieniecki,<br />
Professor, Founder of the<br />
Carbohydrate Observatory<br />
Tapan B. Pathak<br />
Division of Agriculture<br />
and Natural Resources,<br />
University of California,<br />
Merced, CA, Mahesh<br />
L. Maskey, Division of<br />
Agriculture and Natural<br />
Kevin Day<br />
County Director and<br />
UCCE Pomology Farm<br />
Advisor, Tulare/Kings County<br />
Dr. Brent Holtz<br />
County Director and UCCE<br />
Pomology Farm Advisor, San<br />
Joaquin County<br />
Steven T. Koike,<br />
Director, TriCal Diagnostics<br />
Emily J. Symmes<br />
UCCE IPM Advisor,<br />
Sacramento Valley<br />
Resources, University of<br />
California, Merced, CA,<br />
Department of Land, Air<br />
and Water Resources,<br />
University of California,<br />
Davis, CA, A. Dahlberg &<br />
Khaled M. Bali, Division<br />
of Agriculture and Natural<br />
Resources—Kearney<br />
Agricultural Research<br />
and Extension Center,<br />
University of California,<br />
Parlier, CA, Daniele<br />
Zaccaria, Department<br />
of Land, Air and Water<br />
Resources, University of<br />
California, Davis, CA<br />
Emily J. Symmes<br />
Sacramento Valley Area<br />
IPM Advisor University of<br />
California Cooperative<br />
Extension and Statewide<br />
IPM Program<br />
Rob Wilson<br />
UC ANR Intermountain<br />
Research and Extension<br />
Center Director & Farm<br />
Advisor<br />
UC COOPERATIVE EXTENSION<br />
ADVISORY BOARD<br />
Kris Tollerup<br />
UCCE Integrated Pest<br />
Management Advisor,<br />
Parlier, CA<br />
Surendra K. Dara<br />
CE Advisor—Entomology<br />
and Biologicals, University<br />
of California Cooperative<br />
Extension, San Luis Obispo<br />
and Santa Barbara<br />
counties<br />
The articles, research, industry updates, company profiles,<br />
and advertisements in this publication are the professional<br />
opinions of writers and advertisers. Progressive Crop Consultant<br />
does not assume any responsibility for the opinions<br />
given in the publication.<br />
<strong>March</strong>/April <strong>2019</strong><br />
www.progressivecrop.com<br />
3
PRODUCER<br />
Within<br />
the<br />
group<br />
Staying<br />
informed<br />
ECONOMICAL VIABILITY<br />
Acons<br />
Among<br />
growers<br />
COMMUNICATION<br />
PLANNING &<br />
ORGANIZATION<br />
Host Plant<br />
Resistance<br />
IPM<br />
Cultural<br />
Biological<br />
PEST<br />
MANAGEMENT<br />
KNOWLEDGE &<br />
RESOURCES<br />
CONSUMER<br />
Behavioral<br />
Chemical<br />
Microbial<br />
ENVIRONMETAL SAFETY<br />
Physical/<br />
Mechanical<br />
Pest<br />
Managing<br />
info<br />
Available<br />
opons<br />
Monitoring<br />
Tools &<br />
Technology<br />
SELLER<br />
SOCIAL ACCEPTABILITY<br />
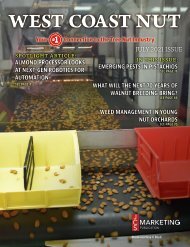
Redefining IPM for the 21st Century<br />
By: Surendra K. Dara | CE Advisor—Entomology and Biologicals, University of<br />
California Cooperative Extension, San Luis Obispo and Santa Barbara counties<br />
Integrated pest management, commonly<br />
referred to as IPM, is a<br />
concept of managing pests that has<br />
been in use for several decades. The<br />
definition and interpretation of IPM<br />
vary depending on the source, such as a<br />
university, institute, or a researcher, and<br />
its application varies even more widely<br />
depending on the practitioner. Here are<br />
a few examples of its definitions and<br />
interpretations:<br />
“IPM is an ecosystem-based strategy<br />
that focuses on long-term prevention<br />
of pests or their damage through a<br />
combination of techniques such as<br />
biological control, habitat manipulation,<br />
modification of cultural practices, and<br />
use of resistant varieties. Pesticides are<br />
4 Progressive Crop Consultant <strong>March</strong>/April <strong>2019</strong><br />
used only after monitoring indicates<br />
they are needed according to established<br />
guidelines, and treatments are made<br />
with the goal of removing only the<br />
target organism. Pest control materials<br />
are selected and applied in a manner<br />
that minimizes risks to human health,<br />
beneficial and nontarget organisms, and<br />
the environment.” UC IPM<br />
“Integrated Pest Management, or IPM,<br />
is an approach to solving pest problems<br />
by applying our knowledge about<br />
pests to prevent them from damaging<br />
crops, harming animals, infesting<br />
buildings or otherwise interfering<br />
with our livelihood or enjoyment of<br />
life. IPM means responding to pest<br />
problems with the most effective, leastrisk<br />
option.” IPM Institute of North<br />
America<br />
“A well-defined Integrated Pest<br />
Management (IPM) is a program<br />
that should be based on prevention,<br />
monitoring, and control which offers<br />
the opportunity to eliminate or<br />
drastically reduce the use of pesticides,<br />
and to minimize the toxicity of and<br />
exposure to any products which are<br />
used. IPM does this by utilizing a<br />
variety of methods and techniques,<br />
including cultural, biological and<br />
structural strategies to control a<br />
multitude of pest problems.” Beyond<br />
Pesticides<br />
“IPM is rotating chemicals from<br />
Continued on Page 6
fungicide<br />
THERE CAN ONLY BE ONE CHAMPION<br />
HELMSTAR PLUS SC is a true champion for disease control in almonds and grapes.<br />
Delivering the industry’s most powerful systemic active ingredients, HELMSTAR PLUS SC<br />
provides maximum protection to elevate crops to their to their highest potential. As a single simple solution<br />
for disease control, HELMSTAR PLUS SC offers the protection you expect with the economic value you demand.<br />
helmstarplus.com<br />
Always read and follow label directions. HELM® is a trademark of HELM AG. ©<strong>2019</strong> HELM Agro US, Inc. All rights reserved.<br />
<strong>March</strong>/April <strong>2019</strong><br />
www.progressivecrop.com<br />
5
Continued from Page 4<br />
different mode of action groups.” A<br />
grower<br />
These definitions and interpretations<br />
represent a variety of objectives and<br />
strategies for managing pests. IPM<br />
is not a principle that can/should be<br />
strictly and equally applied to every<br />
situation, but a philosophy that can<br />
guide the practitioner to use it as<br />
appropriate for the situation. For<br />
example, varieties that are resistant<br />
to arthropod pests and diseases are<br />
available for some crops, but not<br />
for others. Mating disruption with<br />
pheromones is widely practiced for<br />
certain lepidopteran and coleopteran<br />
pests, but not for several hemipteran<br />
pests. Biological control is more readily<br />
employed for greenhouse pests, but<br />
not to the same extent under field<br />
conditions. While chemical pesticides<br />
should be used as the last resort, in<br />
principle, sometimes they are the first<br />
line of defense to prevent damage to the<br />
transplants by certain pests or area-wide<br />
spread of certain endemic or invasive<br />
pests and diseases.<br />
Crop production is an art, science, and<br />
business, and by adding environmental<br />
and social factors, IPM—an approach<br />
used in agriculture—can also be<br />
influenced by a number of factors.<br />
Each grower has their own strategy for<br />
producing crops, minimizing losses,<br />
and making a profit in a manner that<br />
is acceptable to the society, safe for the<br />
consumers, and less disruptive to the<br />
environment. In other words, “IPM<br />
is an approach to manage pests in an<br />
economically viable, socially acceptable,<br />
and environmentally safe manner”.<br />
Keeping this simple, but loaded,<br />
definition in mind and considering<br />
recent advances in crop production and<br />
protection, communication technology,<br />
and globalization of agriculture and<br />
commerce, here is the new paradigm<br />
of IPM with its management, business,<br />
and sustainability aspects.<br />
I. Management Aspect<br />
There are four major<br />
components in the<br />
IPM model that<br />
address various pest<br />
management options,<br />
the knowledge and<br />
resources the grower has in order to<br />
address the pest issue, planning and<br />
organization of information to take<br />
appropriate actions, and maintaining<br />
good communication to acquire and<br />
disseminate knowledge about pests and<br />
their management.<br />
1. Pest Management<br />
The concept of<br />
pest control has<br />
changed to pest<br />
management over<br />
the years knowing<br />
that a balanced<br />
approach to managing<br />
pest populations<br />
to levels that do not cause economic<br />
losses is better than eliminating due to<br />
environmental and economic reasons.<br />
Although the term control is frequently<br />
used in literature and conversations,<br />
it generally refers to management. A<br />
thorough knowledge of general IPM<br />
principles and various management<br />
options for all possible pest problems is<br />
important as some are preventive and<br />
others are curative. It is also essential<br />
to understand inherent and potential<br />
interactions among these management<br />
options to achieve maximum control.<br />
The following are common control<br />
options that can be employed at different<br />
stages of crop production to prevent,<br />
reduce, or treat pest infestations. Each of<br />
them may provide only a certain level of<br />
control, but their additive effect can be<br />
significant in preventing yield losses.<br />
IPM strategies<br />
a. Host plant resistance: It involves the<br />
use of pest resistant and tolerant cultivars<br />
developed through traditional breeding<br />
or genetic engineering. These cultivars<br />
possess physical, morphological, or<br />
biochemical characters that reduce the<br />
plant’s attractiveness or suitability for<br />
the pest to feed, develop, or reproduce<br />
successfully. These cultivars resist or<br />
tolerate pest damage and thus reduce the<br />
yield losses.<br />
b. Cultural control: Modifying<br />
agronomic practices to avoid or<br />
reduce pest infestations and damage<br />
refers to cultural control. Adjusting<br />
planting dates can help escape pest<br />
occurrence or avoid most vulnerable<br />
stages of the crop to coincide with the<br />
pest occurrence. Modifying irrigation<br />
practices, fertilizer program, plant or<br />
row spacing, and other agronomic<br />
practices can create conditions that are<br />
less suitable for the pest. Destroying<br />
crop residue and thorough cultivation<br />
will eliminate breeding sites and control<br />
soil-inhabiting stages of the pest. Crop<br />
rotation with non-host or tolerant<br />
crops will break the pest cycles and<br />
reduce their buildup year after year.<br />
Choosing clean seed and plant material<br />
will avoid the chances of introducing<br />
pests right from the beginning of the<br />
crop production. Sanitation practices to<br />
remove infected/infested plant material,<br />
regular cleaning of field equipment,<br />
avoiding accidental contamination of<br />
healthy fields through human activity<br />
are also important to prevent the pest<br />
spread. Intercropping of non-host<br />
plants or those that deter pests or using<br />
trap crops to divert pests away from the<br />
main crop are some of the other cultural<br />
control strategies.<br />
c. Biological control: Natural enemies<br />
such as predatory arthropods and<br />
parasitic wasps can be very effective in<br />
causing significant reductions in pest<br />
populations in certain circumstances.<br />
Periodical releases of commercially<br />
available natural enemies or conserving<br />
natural enemy populations by providing<br />
refuges or avoiding practices that<br />
harm them are some of the common<br />
practices to control endemic pests. To<br />
address invasive pest issues, classical<br />
biological control approach is typically<br />
employed where natural enemies from<br />
the native region of the invasive pest are<br />
imported, multiplied, and released in<br />
the new habitat of the pest. The release<br />
of irradiated, sterile insects is another<br />
biological control technique that is<br />
successfully used against a number of<br />
pests.<br />
Chemical<br />
Microbial<br />
Host Plant<br />
Resistance<br />
PEST<br />
MANAGEMENT<br />
Mechanical/<br />
Physical<br />
Continued on Page 8<br />
Behavioral<br />
Cultural<br />
Biological<br />
6 Progressive Crop Consultant <strong>March</strong>/April <strong>2019</strong>
<strong>March</strong>/April <strong>2019</strong><br />
www.progressivecrop.com<br />
7
Continued from Page 6<br />
d. Behavioral control: Behavior of the<br />
pest can be exploited for its control<br />
through baits, traps, and mating<br />
disruption techniques. Baits containing<br />
poisonous material will attract and kill<br />
the pests when distributed in the field<br />
or placed in traps. Pests are attracted<br />
to certain colors, lights, odors of<br />
attractants or pheromones. Devices that<br />
use one or more of these can be used<br />
to attract, trap or kill pests. Pheromone<br />
lures confuse adult insects and disrupt<br />
their mating potential, and thus reduce<br />
their offspring.<br />
e. Physical or mechanical control:<br />
This approach refers to the use of<br />
a variety of physical or mechanical<br />
techniques for pest exclusion, trapping<br />
(in some cases similar to the behavioral<br />
control), removal, or destruction. Pest<br />
exclusion with netting, handpicking or<br />
vacuuming to remove pests, mechanical<br />
tools for weed control, traps for rodent<br />
pests, modifying environmental<br />
conditions such as heat or humidity<br />
in greenhouses, steam sterilization or<br />
solarization, visual or physical bird<br />
deterrents such as reflective material<br />
or sonic devices are some examples for<br />
physical or mechanical control.<br />
f. Microbial control: Using<br />
entomopathogenic bacteria, fungi,<br />
microsporidia, nematodes, and viruses,<br />
and fermentation byproducts of<br />
microbes against arthropod pests, fungi<br />
against plant parasitic nematodes, and<br />
bacterial and fungal antagonizers of<br />
plant pathogens generally come under<br />
microbial control. As repeated use of<br />
certain microbial control options can<br />
also lead to resistance development in<br />
KNOWLEDGE &<br />
RESOURCES<br />
Tools &<br />
Technology<br />
Pest<br />
Control<br />
opons<br />
pest populations, caution should be<br />
exercised while using them.<br />
g. Chemical control: Chemical<br />
control typically refers to the use of<br />
synthetic chemical pesticides, but<br />
to be technically accurate, it should<br />
include synthetic chemicals as well as<br />
chemicals of microbial or botanical<br />
origin. Although botanical extracts<br />
such as azadirachtin and pyrethrins,<br />
and microbe-derived toxic metabolites<br />
such as avermectin and spinosad are<br />
regarded as biologicals, they are still<br />
chemical molecules, similar to synthetic<br />
chemicals, and possess many of the<br />
human and environmental safety risks<br />
as chemical pesticides do. Chemical<br />
pesticides are categorized into different<br />
groups based on their mode of action<br />
and rotating chemicals from different<br />
groups is recommended to reduce<br />
the risk of resistance development.<br />
Government regulations restrict the<br />
time and amount of certain chemical<br />
pesticides and help mitigate the<br />
associated risks.<br />
The new RNAi (ribonucleic acid<br />
interference) technology where<br />
double-stranded RNA is applied to<br />
silence specific genes in the target<br />
insect is considered a biopesticide<br />
application. Certain biostimulants<br />
based on minerals, microbes, plant<br />
extracts, seaweed or algae impart<br />
induced systemic resistance to pests and<br />
diseases, but are applied as amendments<br />
without any claims for pest or disease<br />
control. These new products or<br />
technologies can fall into one or more<br />
abovementioned categories.<br />
As required by the crop and pest<br />
situation, one or more of these control<br />
options can be used throughout the<br />
production period for effective pest<br />
management. When used effectively,<br />
non-chemical control options delay,<br />
reduce, or eliminate the use of chemical<br />
pesticides.<br />
2. Knowledge and Resources<br />
The knowledge<br />
of various control<br />
options, pest biology<br />
and damage potential,<br />
and suitability of<br />
available resources<br />
enables the grower to make a decision<br />
appropriate for their situation.<br />
a. Pest: Identification of the pest,<br />
understanding its biology and seasonal<br />
Acons<br />
Managing<br />
Info<br />
PLANNING &<br />
ORGANIZATION<br />
Monitoring<br />
population trends, damaging life stages<br />
and their habitats, nature of damage and<br />
its economic significance, vulnerability<br />
of each life for one or more control<br />
options, host preference and alternate<br />
hosts, and all the related information<br />
is critical for identifying an effective<br />
control strategy.<br />
b. Available control options: Since not<br />
all control options can be used against<br />
every pest, the grower has to choose the<br />
ones that are ideal for the situation. For<br />
example, systemic insecticides are more<br />
effective against pests that mine or bore<br />
into the plant tissue. Pests that follow<br />
a particular seasonal pattern can be<br />
controlled by adjusting planting dates.<br />
Commercially available natural enemies<br />
can be released against some, while<br />
mating disruption works well against<br />
others. Entomopathogenic nematodes<br />
can be used against certain soil pests,<br />
bacteria and viruses against pests with<br />
chewing mouthparts such as lepidoptera<br />
and coleopteran, and fungi against<br />
sucking pests.<br />
c. Tools and technology: A particular<br />
pest can be controlled by certain<br />
options, but they may not all be<br />
available in a particular place, for a<br />
particular crop, or within the available<br />
financial means. For example, the<br />
release of natural enemies may be<br />
possible in high-value specialty crops,<br />
but not in large acreage field crops. A<br />
particular pesticide might be registered<br />
against a pest on some crops, but not on<br />
all. Use of netting or tractor-mounted<br />
vacuums can be effective, but very<br />
expensive limiting their availability to<br />
those who can afford.<br />
This is a critical component where<br />
diagnostic and preventive or curative<br />
decisions are made based on available<br />
and affordable control options.<br />
8 Progressive Crop Consultant <strong>March</strong>/April <strong>2019</strong>
3. Planning and Organization<br />
This component<br />
deals with the<br />
management<br />
aspect of the new<br />
IPM model for<br />
data collection,<br />
organization,<br />
and actual actions against pest<br />
infestations.<br />
a. Pest monitoring: Regularly<br />
monitoring the fields for pest<br />
occurrence and spread is a basic step<br />
in crop protection. Early detection in<br />
many cases can help address the pest<br />
situation by low-cost spot treatment<br />
or removal of pests or infected/<br />
infested plant material. When pest<br />
infestations continue to grow, regular<br />
monitoring is necessary to assess<br />
the damage and determine the<br />
time to initiate farm-wide control.<br />
Monitoring is also important to avoid<br />
calendar-based pesticide applications<br />
especially at lower pest populations<br />
that do not warrant treatments.<br />
b. Managing information: A good<br />
recordkeeping about pests, their<br />
damage, effective treatments, seasonal<br />
fluctuations, interactions with<br />
environmental factors, irrigation<br />
practices, plant nutrition, and all<br />
related information from year to year<br />
will build the institutional knowledge<br />
and prepares the grower to take<br />
preventive or curative actions.<br />
c. Corrective actions: Taking<br />
timely action is probably the most<br />
important aspect of IPM. Even with<br />
all the knowledge about the pest<br />
and availability of resources for its<br />
effective management, losses can<br />
be prevented only when corrective<br />
actions are taken at the right time. Good<br />
farm management will allow the grower<br />
to take timely actions. These actions are<br />
not only necessary to prevent damage<br />
on a particular farm, but also to prevent<br />
the spread to neighboring farms.<br />
When pest management is neglected,<br />
it leads to area-wide problems with<br />
larger regulatory, social, and economic<br />
implications.<br />
4. Communication<br />
Good communication to transfer<br />
the individual or<br />
collective knowledge<br />
for the benefit of<br />
everyone is the<br />
last component<br />
of the new IPM<br />
model. Modern<br />
and traditional<br />
communication tools can be used for<br />
outreach as university and private<br />
researchers develop information about<br />
endemic and invasive pests, emerging<br />
threats, and new control strategies.<br />
Continued on Page 10<br />
Within the<br />
group<br />
Within the<br />
community<br />
Staying upto-date<br />
COMMUNICATION<br />
<strong>March</strong>/April <strong>2019</strong><br />
www.progressivecrop.com<br />
9
Continued from Page 9<br />
a. Staying informed: Growers and<br />
pest control professionals should stay<br />
informed about existing and emerging<br />
pests and their management options.<br />
Science-based information can be<br />
obtained by attending extension<br />
meetings, webinars, or workshops,<br />
reading newsletter, trade, extension,<br />
or scientific journal articles, and<br />
keeping in touch with researchers and<br />
other professionals through various<br />
communication channels. Wellinformed<br />
growers can be well prepared<br />
to address pest issues.<br />
b. Communication within the group:<br />
Educating farm crew through periodical<br />
training or communication will help<br />
with all aspects of pest management,<br />
proper pesticide handling, ensuring<br />
worker safety, and preventing<br />
environmental contamination. A<br />
knowledgeable field crew will be<br />
beneficial for effective implementation<br />
of pest management strategies.<br />
c. Communication among growers:<br />
Although certain crop production and<br />
protection strategies are considered<br />
proprietary information, pests do<br />
not have boundaries and can spread<br />
to multiple fields when they are not<br />
effectively managed throughout<br />
the region. Sharing knowledge and<br />
resources with each other will improve<br />
pest control efficacy and benefit the<br />
entire grower community.<br />
In addition to these four components<br />
with an IPM model, factors that<br />
influence profitable, safe, and affordable<br />
food production at a larger scale and<br />
their implications for global food<br />
security should also be included. There<br />
are two layers surrounding these four<br />
components addressing the business<br />
and sustainable aspects of food<br />
production.<br />
II. Business Aspect<br />
Consumers want<br />
nutritious, healthy,<br />
and tasty produce<br />
that is free of pest<br />
damage at affordable prices. Growers<br />
try to meet this demand by producing<br />
food that meets all the consumer needs,<br />
while maintaining environmental and<br />
human safety and still being able to<br />
make a profit. Sellers evaluate the<br />
market demand and strategize their<br />
sales to satisfy consumers while<br />
making their own profit to stay in<br />
the business. In an ideal system,<br />
consumer, producer, and seller would<br />
maintain a harmonious balance of<br />
food production and sale. In such a<br />
system, food is safe and affordable<br />
to everyone, there will be food<br />
security all over the world, and both<br />
growers and sellers make a good<br />
profit with no or minimal risk to the<br />
environment in the process of food<br />
production.<br />
However, this balance is frequently<br />
disrupted due to 1) consumers’<br />
misunderstanding of various food<br />
production systems, their demand<br />
for perfectly shaped fruits and<br />
vegetables at affordable prices or their<br />
willingness to pay a premium price<br />
for food items that are perceived<br />
to be safe, 2) growers trying to find<br />
economical ways of producing<br />
high quality food while facing with<br />
continuous pest problems and other<br />
challenges, and 3) sellers trying to<br />
market organic food at a higher price<br />
as a safer alternative to conventionally<br />
produced food. If growers implement<br />
good IPM strategies to produce safe<br />
food and consumers are aware of this<br />
practice and gain confidence in food<br />
produced in an IPM system, then<br />
sellers would be able to market what<br />
informed-consumers demand.<br />
III. Sustainability Aspect<br />
As mentioned earlier,<br />
IPM is an approach to<br />
ensure economic viability<br />
at both consumer and<br />
producer level (seller is<br />
always expected to make<br />
a profit), environmental<br />
safety through a balanced use of all<br />
available pest control options, and<br />
social acceptability as food is safe and<br />
affordable.<br />
While organic food production<br />
is generally perceived as safe and<br />
sustainable, the following examples<br />
can explain why it is not necessarily<br />
true. Organic food production<br />
is not pesticide-free and some of<br />
the pesticides used in an organic<br />
system are as harmful to humans<br />
and non-target organisms as some<br />
chemical pesticides. Certain organically<br />
accepted pesticides have toxins or<br />
natural chemical molecules that are very<br />
similar to those in synthetic pesticides.<br />
In fact, some synthetic pesticides are<br />
manufactured imitating the pesticidal<br />
molecules of natural origin. Mechanical<br />
pest control practices such as<br />
vacuuming or tilling utilize fossil fuels<br />
and indirectly have a negative impact<br />
on the environment. For example,<br />
diesel-powered tractors are operated for<br />
vacuuming western tarnished bug in<br />
strawberry 2-3 times or more each week<br />
compared to a pesticide application<br />
typically requires the use of tractor<br />
once every 7-14 days. To control certain<br />
pests, multiple applications of organic<br />
pesticides might be necessary with<br />
associated costs and risks, while similar<br />
pest populations could be controlled by<br />
fewer chemical pesticide applications. It<br />
is very difficult to manage certain plant<br />
diseases and arthropod pests through<br />
non-chemical means and inadequate<br />
control not only leads to crop losses,<br />
but can result in their spread to larger<br />
areas making their control even more<br />
difficult. Many growers prefer a good<br />
IPM-based production to an organic<br />
production for the ease of operation and<br />
profitability. However, they continue<br />
to produce organic food to stay in<br />
business.<br />
While middle and upper-class<br />
consumers may be willing to pay<br />
higher prices for organically produced<br />
food, many of the low-income groups<br />
in developed and underdeveloped<br />
countries cannot afford such food.<br />
Organic food production can lead to<br />
social inequality and a false sense of<br />
wellbeing for those that can afford it.<br />
Food security for the growing world<br />
population is necessary through<br />
optimizing input costs, minimizing<br />
wastage, grower adoption of safe and<br />
sustainable practices, and consumer<br />
confidence in food produced through<br />
such practices. IPM addresses all<br />
the economic, environmental, and<br />
social aspects and provides safe and<br />
affordable food to the consumers and<br />
profits to producers and sellers, while<br />
maintaining environmental health.<br />
Comments about this article? We want<br />
to hear from you. Feel free to email us<br />
at article@jcsmarketinginc.com<br />
10 Progressive Crop Consultant <strong>March</strong>/April <strong>2019</strong>
IS IT POSSIBLE THIS FUNGICIDE<br />
MAKES EVEN<br />
MORE SENSE<br />
TODAY THAN THE DAY IT WAS INTRODUCED?<br />
A group 21 designation with no resistance issues<br />
puts RANMAN ® in a class of its own.<br />
Fungicide resistance is a growing problem. It’s also making a fungicide that’s<br />
been trusted for years more important than ever for protecting your cucurbit<br />
vegetables.<br />
RANMAN® 400 SC fungicide’s combination of zero resistance issues with proven<br />
protection against Downy mildew and Phytophthora blight, along with a 0-day<br />
PHI in cucurbits, make it the perfect choice for your disease control program.<br />
And, RANMAN is an ideal fit for onions, brassicas and leafy greens, potatoes,<br />
and other important crops.<br />
For excellent preventive disease control, along with the flexibility to use in<br />
mixture or alternation programs, make RANMAN a key part of your disease<br />
control and resistance management program.<br />
Cucurbits<br />
Carrots<br />
Onions<br />
KENJA®<br />
RANMAN FUNGICIDE IS SOLD<br />
EXCLUSIVELY THROUGH<br />
HELENA AGRI-ENTERPRISES AND<br />
TENKOZ MEMBER COMPANIES.<br />
Always read and follow label directions. RANMAN is an invention and registered trademark of Ishihara<br />
Sangyo Kaisha, Ltd., and is manufactured and developed by ISK Biosciences Corporation.<br />
©<strong>2019</strong> Summit Agro USA, LLC. All rights reserved<br />
<strong>March</strong>/April <strong>2019</strong><br />
www.progressivecrop.com<br />
11
Kasugamycin for Managing Walnut Blight<br />
How do kasugamycin-copper or -mancozeb mixtures compare to copper-mancozeb?<br />
By: J. E. Adaskaveg | Department of Microbiology and Plant Pathology, University of<br />
California, Riverside, CA, L. Wade | Arysta Life Science, Roseville, CA<br />
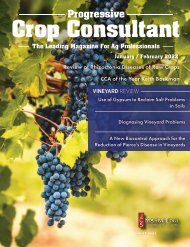
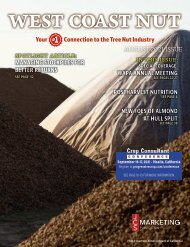
Figure 1. Pistillate<br />
flowers developing<br />
into healthy walnut<br />
fruitlets (left) and<br />
showing a primary<br />
infection (center)<br />
at the blossom end.<br />
Developing walnuts<br />
(right) with primary<br />
(blossom end) and<br />
secondary (fruitside)<br />
infections. All photos<br />
courtesy of Jim<br />
Adaskaveg.<br />
Kasugamycin (tradename Kasumin)<br />
was registered in 2018<br />
for managing walnut blight and<br />
bacterial canker and blast on sweet<br />
cherry. The bactericide was already federally<br />
registered for fire blight on pome<br />
fruit, but in 2018, registration for this<br />
disease was also approved in California.<br />
Kasugamycin is a unique bactericide because<br />
it is not used in animal or human<br />
medicine. Environmental monitoring<br />
studies have shown that it does not<br />
select for human bacterial pathogen<br />
resistance with uses in plant agriculture.<br />
Furthermore, kasugamycin has its own<br />
Fungicide Resistance Action Committee<br />
(FRAC) Code 24 or mode of action that<br />
is different from other registered plant<br />
agricultural bactericides like streptomycin<br />
(FRAC Code 25) and oxytetracycline<br />
(FRAC Code 41). Kasugamycin<br />
meets new toxicology standards for pollinating<br />
insects (e.g., honey bees), it has<br />
a low animal toxicity with a “Caution”<br />
rating and a 12 h re-entry time on the<br />
label. As with any cautionary pesticide,<br />
mixers and applicators need to have<br />
standard personal protective equipment<br />
(PPE) when handling the bactericide.<br />
Copper is classified as FRAC Code M1<br />
for the first element historically used<br />
for fungal and bacterial disease control.<br />
Copper affects many physiological<br />
pathways in plant pathogens and is<br />
classified as having a multi-site (M)<br />
mode of action. Not many bactericides<br />
have been developed for managing<br />
plant bacterial diseases, and fewer have<br />
been registered. Thus, there has been a<br />
great dependency on copper. Because<br />
of the multi-site classification, many<br />
agriculturalists thought that plant<br />
pathogens would not develop resistance<br />
to copper. Unfortunately, after many<br />
years of usage, bacterial pathogens<br />
such as the walnut blight pathogen,<br />
Xanthomonas arboricola pv. juglandis<br />
(Xaj), have developed resistance to<br />
copper. This is a direct result and lack<br />
of alternative bactericides available<br />
of overuse of one active ingredient<br />
(i.e., copper) and being limited with<br />
the lack of bactericides available to<br />
apply modern approaches to resistance<br />
management such as rotating between<br />
active ingredients with different modes<br />
of action and limiting the total number<br />
of applications of any one mode of<br />
action per season as part of following<br />
“RULES” (http://ipm.ucanr.edu/PDF/<br />
PMG/fungicideefficacytiming.pdf).<br />
Over-usage of any one active ingredient,<br />
such as copper, can create other<br />
environmental issues only including soil<br />
contamination, orchard water-runoff,<br />
higher concentrations in watersheds,<br />
and potential crop and non-crop<br />
phytotoxicity especially in perennial<br />
crop systems.<br />
After the industry used copper<br />
exclusively for approximately 50 years<br />
(1930s to 1980s), copper-maneb<br />
(e.g., Manex) mixtures were first<br />
identified for use on walnut in 1992<br />
and emergency registrations ensued<br />
for 22 years before a full registration<br />
was obtained for the related compound<br />
mancozeb in 2014. The walnut industry<br />
and University of California (UC)<br />
researchers knew that more alternatives<br />
were needed, otherwise someday the<br />
pathogen would develop resistance<br />
to copper-mancozeb. Because copper<br />
resistance had already developed, this<br />
selection pressure is maintained and<br />
resistance levels are increasing even<br />
when mancozeb is used in the mixture,<br />
because copper has been the only<br />
tank mix option. In effect, resistance<br />
management is not being effectively<br />
practiced since copper-resistance<br />
already exists and the use of mancozeb<br />
(M3) is selecting for resistant strains of<br />
the bacterial pathogen to the mancozeb<br />
mode of action. In the presence of<br />
copper resistance, having only one<br />
treatment (i.e., mancozeb) available<br />
to manage a disease not only can limit<br />
crop production each season but could<br />
economically devastate the entire<br />
industry by making harvests sporadic<br />
and inconsistent, lowering crop quality,<br />
and preventing profitability. Growers<br />
and the entire walnut industry consider<br />
walnut blight a threat to the industry<br />
and their livelihood.<br />
Why do we need kasugamycin for<br />
managing walnut blight? There is a<br />
great need to develop other modes of<br />
action for managing bacterial diseases<br />
including walnut blight that can be<br />
integrated into management programs.<br />
Kasugamycin was identified, developed,<br />
and registered for the purpose of<br />
resistance management, reducing<br />
over-usage of any one mode of action,<br />
and sustaining the walnut industry<br />
of California. The aminoglycoside<br />
bactericide has a unique mode of action<br />
(FRAC Code 24) as stated above and<br />
can be used in combination with copper<br />
or mancozeb. When kasugamycin is<br />
used in combination with mancozeb,<br />
12 Progressive Crop Consultant <strong>March</strong>/April <strong>2019</strong>
esistance management is being practiced<br />
since resistance has not been found in Xaj<br />
pathogen populations to either mode of<br />
action.<br />
Use on Walnuts<br />
Kasugamycin is labeled as Kasumin for<br />
managing walnut blight at 64 fl oz/A in a<br />
minimum of 100 gal water/A for ground<br />
application. The full 64 fl oz per acre labeled<br />
rate for kasugamycin should always be used.<br />
Adjuvants that are stickers may also be used,<br />
whereas spreaders and penetrants should<br />
be avoided. Reduced spray volumes may<br />
be utilized for small trees provided that the<br />
volume of water is sufficient to provide good<br />
coverage of treated foliage. Applications<br />
should be initiated when conditions favor<br />
disease development. This is the same timing<br />
as for copper-mancozeb. In orchards with a<br />
history of the disease and when high rainfall<br />
is forecasted, applications should be initiated<br />
at 20-40 percent catkin expansion. Under<br />
less favorable conditions for disease (i.e.,<br />
low rainfall forecasts and minimal dews),<br />
applications should start at 20-40 percent<br />
pistillate flower expansion (also known as<br />
the “prayer stage”). The preharvest interval is<br />
100 days or approximately mid- to late June<br />
depending on the walnut cultivar harvest<br />
date. The minimal re-application interval<br />
is seven days. The current labeled use of<br />
Kasumin allows for two applications or 128 fl<br />
oz of product per season with a label change<br />
for up to four (256 fl oz) per season planned<br />
later this year. Still, only two consecutive<br />
applications will be allowed without rotating<br />
to other modes of action. Alternate row<br />
applications, applications in orchards that are<br />
being fertilized with animal waste/manure,<br />
or animal grazing in orchards treated with<br />
Kasumin are not allowed. The first restriction<br />
is to prevent selection of resistant isolates<br />
of the target pathogen, Xaj; whereas, the<br />
latter two restrictions are to ensure that the<br />
selection of non-target, human-pathogen<br />
bacteria is prevented.<br />
For walnut blight management, the best<br />
way to use the bactericide is in combination<br />
with mancozeb or copper. Application<br />
management strategies for a four- or fivespray<br />
mixture, rotation program include, but<br />
are not limited to, the following:<br />
A) Copper/mancozeb—kasugamycin/<br />
mancozeb—kasugamycin/copper—copper/<br />
mancozeb<br />
B) Copper/mancozeb—kasugamycin/<br />
mancozeb—copper/mancozeb—<br />
kasugamycin/copper— copper/mancozeb<br />
Continued on Page 14<br />
<strong>March</strong>/April <strong>2019</strong><br />
www.progressivecrop.com<br />
13
Continued from Page 13<br />
How do kasugamycin treatments compare to coppermancozeb<br />
treatments in managing disease? The research<br />
used to develop kasugamycin was based on a 7- to 10-day<br />
re-application interval. The reason for this was that Kasumin<br />
is only locally systemic or translaminar and thus, is less likely<br />
to be re-distributed. With new growth increasing the canopy<br />
volume weekly in the spring as walnut trees come out of<br />
dormancy, multiple and frequent applications are necessary.<br />
Kasugamycin-mancozeb mixtures applied in our research<br />
trials were often the most effective of all treatments evaluated.<br />
In general, bactericides have a short residual life of a few<br />
days to a week or two. In toxicology in-vitro testing, Xaj is<br />
only moderately sensitive to kasugamycin with a mid-range<br />
to high minimum inhibitory concentration (MIC) value.<br />
When kasugamycin is mixed with mancozeb, the MIC of<br />
the mixture is approximately 5 parts per million (ppm).<br />
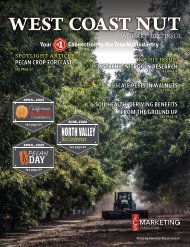
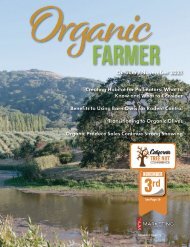
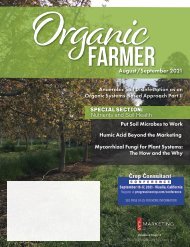
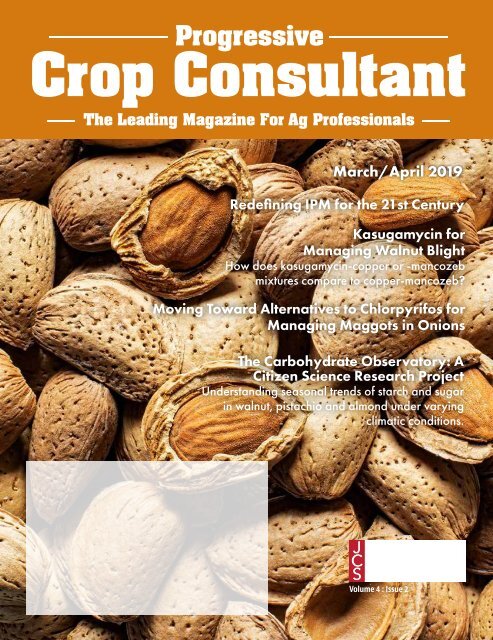
Figure 2. Radial streaks of 16 isolates of Xaj on each plate exposed to different toxicants. Right image: Copper 50 ppm (fixed concentration). Spiral<br />
gradient plates with highest concentration towards the center and lowest concentration at the edge of the plate. Middle image: Kasugamycin (gradient<br />
range 0.5 to 64.9 ppm); and Left image: Kasugamycin+mancozeb (concentration gradients). Lack of growth towards the center of each plate indicates<br />
inhibition. No inhibition for copper at 50 ppm whereas inhibition concentrations averaged 20 and 5 ppm for kasugamycin and the kasugamycinmancozeb<br />
mixture, respectively.<br />
PUBLICATION<br />
Radial streaks of 16 isolates of Xaj on<br />
each plate exposed to different<br />
toxicants. Top image: Copper 50 ppm<br />
(fixed concentration). Spiral gradient<br />
plates with highest concentration<br />
towrds the center and lowest<br />
concentration at the edge of the<br />
plate. Middle image: Kasugamycin<br />
(gradient range 0.5 to 64.9 ppm); and<br />
Bottom image: Kasugamycin +<br />
mancozeb (concentration gradients).<br />
Lack of growth towards the center of<br />
each plate indicates inhibition. No<br />
inhibition for copper at 50 ppm<br />
whereas inhibition concentrations<br />
averaged 20 and 5 ppm for<br />
kasugamycin and the kasugamycinmancozeb<br />
mixture, respectively.<br />
Free Monthly Publications & E-Newsletter<br />
SUBSCRIBE NOW!<br />
Are You an Organic Farmer?<br />
The #1 Choice for Organic Farmers<br />
www.organicfarmingmag.com<br />
WEST COAST NUT<br />
Are You Interested in the Nut Industry?<br />
California’s #1 Nut Publication<br />
www.wcngg.com<br />
PUBLICATION<br />
14 Progressive Crop Consultant <strong>March</strong>/April <strong>2019</strong>
Kasugamycin is applied at 64 fl oz per<br />
100 gal or 100 ppm. Thus, the labeled<br />
rate is kasugamycin-mancozeb mixtures<br />
are approximately 20X of the MIC value<br />
for Xaj. Because of the short residual<br />
activity and a moderate buffering residue<br />
(20X), the rotation needs of bactericide<br />
mixtures containing kasugamycin<br />
described above need to be applied in 7-<br />
to 10-day intervals (Figure 3).<br />
Kasugamycin and Resistance<br />
Resistance is a relative term indicating<br />
a change in sensitivity to an inhibitory<br />
compound. A moderately high MIC for<br />
a bactericide does not mean that the<br />
pathogen is resistant. We have conducted<br />
baseline studies with kasugamycin,<br />
kasugamycin-copper, and kasugamycinmancozeb<br />
for Xaj with MIC values of<br />
20, 8.3, 5.3 ppm, respectively (Figure 2,<br />
see page 14). This was done before the<br />
bactericide was registered in California<br />
to determine any change in sensitivity<br />
after registration and commercial usage.<br />
To date, resistance has not been found<br />
and isolates evaluated are all within<br />
the baseline distributions. Still, with a<br />
single site mode of action compound<br />
such as kasugamycin, there is a risk for<br />
selecting resistant sub-populations of<br />
the pathogen especially when resistance<br />
management strategies are not employed.<br />
This is the reason why we developed the<br />
mixture-rotation programs suggested<br />
above.<br />
Conclusions<br />
The integration of bactericides with<br />
different modes of action and application<br />
strategies of rotations of mixtures of<br />
bactericides with different modes of<br />
action with forecasting tools such as<br />
XanthoCast (http://www.agtelemetry.<br />
com/) should provide the stewardship<br />
necessary for having the tools available<br />
for managing walnut blight for years<br />
to come. The hope with the Kasumin<br />
registration is to provide resistance<br />
management and prevent or reduce the<br />
risk of resistance to copper-mancozeb<br />
while new approaches can be developed<br />
and integrated to protect all of these<br />
compounds. Walnut blight is the most<br />
serious disease impacting growers<br />
in California and multiple tools like<br />
kasugamycin, copper, and mancozeb<br />
need to be available to maintain a<br />
successful industry.<br />
Comments about this article? We want<br />
to hear from you. Feel free to email us<br />
at article@jcsmarketinginc.com<br />
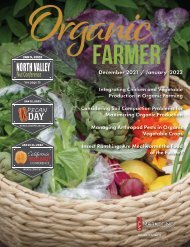
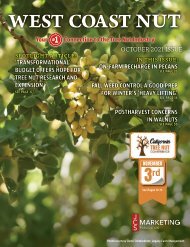
Treatment (Rate of ai oz/A)<br />
Control<br />
ATD - 12.9<br />
Kasugamycin - 1.3<br />
Kasugamycin + ATD - 1.3 + 12.9<br />
Copper + Mancozeb - 24 + 28.4<br />
Kasugamycin +Copper - 1.3 + 24<br />
Kasugamycin + Mancozeb - 1.3 + 28.4<br />
Copper - 24<br />
0<br />
d<br />
d<br />
cd<br />
bc<br />
bc<br />
b<br />
bc<br />
2 4 6 8 10<br />
Disease incidence (%)<br />
a<br />
Figure 3. Efficacy of<br />
treatments for managing<br />
walnut blight.<br />
Treatments applied<br />
using an air-blast<br />
sprayer (100 gal/A). The<br />
walnut blight pathogen<br />
was sensitive to copper.<br />
Disease incidence is<br />
the number of diseased<br />
nuts per 100 nuts<br />
evaluated. ATD = amino<br />
thiadiazole, an experimental<br />
bactericide. Bars<br />
followed by the same<br />
letter are not significantly<br />
different.<br />
Prevent Walnut Blight this Season!<br />
Blossom Protect <br />
Stop disease before it gets started.<br />
Beneficial microorganisms in Blossom Protect<br />
out-compete the walnut blight pathogen for<br />
space and nutrients, creating a protective barrier<br />
between the plant and potential disease.<br />
• No development of pathogen resistance<br />
• Ideal for Integrated Pest Management<br />
• No pre-harvest interval & exempt from MRLs<br />
• Safe for bees and beneficial insects<br />
• Approved for Certified Organic Crop Production<br />
Apply up to 6 applications of Blossom Protect<br />
starting at 10% pistillate bloom through 1 week<br />
past full bloom.<br />
Always use Blossom Protect with<br />
Buffer Protect to optimize efficacy<br />
and maximize consistent performance.<br />
®<br />
WALNUT BLIGHT<br />
Call to learn more:<br />
(800) 276-2767 • www.westbridge.com<br />
<strong>March</strong>/April <strong>2019</strong><br />
www.progressivecrop.com<br />
15
Yellow sticky traps work well for determining the number of<br />
seed corn maggot flies and onion maggot flies in onion fields.<br />
All photos courtesy of Rob Wilson.<br />
Moving Toward Alternatives<br />
to Chlorpyrifos for Managing<br />
Maggots in Onions<br />
By: Rob Wilson | UC ANR Intermountain Research and Extension<br />
Center Director & Farm Advisor<br />
Chlorpyrifos, an organophosphate<br />
pesticide used to kill of number<br />
of insect pests, has been the go-to<br />
insecticide for managing maggots in<br />
California onions. For many years,<br />
chlorpyrifos applied in-furrow at planting<br />
provided effective control of maggots<br />
in fresh market and dehy onions.<br />
Unfortunately, serious environmental<br />
concerns associated with chlorpyrifos<br />
and the potential for insecticide resistance<br />
is forcing the onion industry to<br />
find alternative insecticides. Starting on<br />
January 1, <strong>2019</strong>, the California Department<br />
of Pesticide Regulation (DPR)<br />
has recommended County Agricultural<br />
Commissioners implement interim re-<br />
strictions on chlorpyrifos use. Detailed<br />
information on the interim restrictions<br />
and regulations can be found on<br />
the DPR website at https://www.cdpr.<br />
ca.gov/docs/pressrls/2018/111518.htm.<br />
DPR is completing a formal regulatory<br />
process to list chlorpyrifos as a toxic air<br />
contaminant with permanent restrictions,<br />
but until the regulatory process<br />
is complete, interim restrictions are in<br />
place.<br />
Onion and Seed Corn Maggot<br />
Both onion maggot, Delia antiqua, and<br />
seed corn maggot, Delia platura, are<br />
problem pests in California onions.<br />
Larvae of both species feed on young<br />
onion plants, often resulting in<br />
seedling mortality and onion stand<br />
reduction by more than 50 percent<br />
of desired seeding rate. Seed corn<br />
maggot flies lay their eggs in fields in<br />
spring and larvae live in the soil and<br />
feed on seeds and developing plants<br />
of several crops. Onion maggot flies<br />
lay their eggs in young onion fields<br />
and larvae live in the soil feeding on<br />
onions belowground. Onion maggots<br />
are specific to onions and other<br />
allium crops. Preventative farming<br />
practices such as late plantings,<br />
increasing seeding rates, avoiding<br />
tilling manures and crop residues<br />
shortly before planting, and removing<br />
onion culls can prevent damage from<br />
maggots, but preventative measures<br />
alone are not always effective,<br />
especially in fields with heavy maggot<br />
pressure.<br />
Insecticide applied at planting<br />
provides the most consistent<br />
control of maggots. The key to<br />
effective insecticide use for maggot<br />
control is applying the insecticide<br />
prophylactically at the time of<br />
planting. Growers shouldn’t wait to<br />
apply insecticides until maggot larvae<br />
are found as maggot larvae feed on<br />
seeds, germinating plants, and young<br />
onions. This feeding results in rapid<br />
plant mortality, thus insecticide<br />
application after planting is rarely<br />
effective.<br />
Research<br />
Research studies at the University of<br />
California (UC) UC Intermountain<br />
Continued on Page 18<br />
Differences in onion stand caused by maggot feeding for various insecticide treatments in<br />
IREC research plots. The plot with few onions is the untreated control.<br />
16 Progressive Crop Consultant <strong>March</strong>/April <strong>2019</strong>
<strong>March</strong>/April <strong>2019</strong><br />
www.progressivecrop.com<br />
17
Continued from Page 16<br />
Research and Extension Center (IREC)<br />
in Tulelake, California are investigating<br />
insecticides and insecticide application<br />
methods to find alternatives to<br />
chlorpyrifos. This research effort has<br />
received admirable support from the<br />
California Garlic and Onion Research<br />
Advisory Board with the hopes of<br />
pro-actively finding alternatives before<br />
chlorpyrifos restrictions. Insecticide<br />
applications at planting can be made<br />
in-furrow, broadcast, or as a seed<br />
treatment. IREC research has shown<br />
the efficacy of different application<br />
methods is dependent on insecticide<br />
choice. For example, spinosad was<br />
only effective when applied as a<br />
seed treatment (Regard) as spinosad<br />
(Entrust) applied in-furrow at planting<br />
had similar onion stands compared to<br />
the untreated control.<br />
Insecticide Alternatives to<br />
Chlorpyrifos<br />
Seed treatment with spinosad (FarMore<br />
OI100 and FI500) or clothianidin<br />
(Sepresto) provided similar or better<br />
suppression of maggot compared to<br />
chlorpyrifos at the maximum labeled<br />
rate in-furrow. This trend was true<br />
multiple years in multiple studies<br />
conducted at IREC. Outside the<br />
research world, multiple Tulelake onion<br />
growers had success using spinosad or<br />
clothianidin seed treatments instead<br />
of chlorpyrifos in 2017 and 2018.<br />
Applying chlorpyrifos in combination<br />
with spinosad and clothianidin seed<br />
treatment did not increase onion<br />
stands compared to using either<br />
seed treatment alone. Cyromazine<br />
(Trigard) seed treatment is another<br />
alternative. Trigard provided similar<br />
maggot suppression compared to<br />
FarMore FI500 and Sepresto in 2018,<br />
and it is seed treatment used in other<br />
parts of the United States for maggot<br />
control. Bifenthrin was the only tested<br />
insecticide applied in-furrow that<br />
provided similar efficacy compared to<br />
chlorpyrifos. Unfortunately, bifenthrin<br />
is not currently labeled for use in<br />
California onions.<br />
Other Considerations<br />
Fungicides used in combination<br />
with insecticide seed treatment may<br />
influence onion stands. In 2018,<br />
Sepresto (insecticide) + FarMore F300<br />
(fungicide) + pro-gro (fungicide)<br />
resulted in the highest onion stands in a<br />
field with a combination of maggots and<br />
smut. In fields without smut, thiram<br />
and FarMore F300 fungicide package<br />
gave good early season disease control<br />
in IREC studies.<br />
Yellow sticky traps placed along field<br />
edges can offer growers an early<br />
warning for potential maggot problems<br />
(see picture). Seed corn maggot and<br />
onion maggot flies are readily captured<br />
on sticky traps and the traps (changed<br />
once a week) provide growers an<br />
indication of the number of flies during<br />
onion establishment. Tillage of green<br />
plants, plant residues, and manures<br />
attract thousands of egg-laying female<br />
flies and crop damage is often severe<br />
when crops are planted within the first<br />
Early season onion stand differences<br />
caused by maggot feeding.<br />
Seed corn maggot larvae feeding on<br />
onion seedling.<br />
few weeks of tillage. Cool, wet weather<br />
and delayed plant emergence are other<br />
factors that promote crop damage from<br />
seed corn maggot. First generation<br />
maggots are most problematic as their<br />
feeding kills seedling plants, but later<br />
generation maggots can feed on plants<br />
and bulbs in the summer. Damage from<br />
later generation onion maggot is rarely<br />
economically important in California<br />
except for fields with diseased, decaying<br />
onion bulbs making mid-season and<br />
late season disease control important to<br />
prevent late season maggot problems.<br />
Comments about this article? We want<br />
to hear from you. Feel free to email us<br />
at article@jcsmarketinginc.com<br />
Hand-harvesting onions to determine<br />
yield differences.<br />
Late season onion maggot feeding on an<br />
onion bulb.<br />
18 Progressive Crop Consultant <strong>March</strong>/April <strong>2019</strong>
<strong>March</strong>/April <strong>2019</strong><br />
www.progressivecrop.com<br />
19
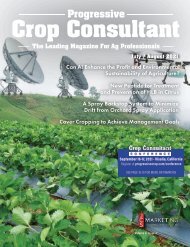
Santa Rosa<br />
Petaluma<br />
Redding<br />
Napa<br />
Yuba City<br />
Sacramento<br />
Vallejo<br />
Antioch Stockton<br />
San Francisco<br />
Hayward<br />
San Jose<br />
Tracy<br />
Santa Cruz<br />
Watsonville<br />
Salinas<br />
The Carbohydrate<br />
Observatory: A Citizen<br />
Science Research Project<br />
Reno<br />
Fresno<br />
St. George<br />
Salt Lake City<br />
Understanding seasonal trends of starch and<br />
sugar in walnut, pistachio and almond under<br />
varying climatic conditions.<br />
By: Anna Davidson | Postdoc, Manager of the Carbohydrate<br />
Observatory and Maciej Zwieniecki | Professor, Founder of the<br />
Carbohydrate Observatory<br />
Provo<br />
Las Vegas<br />
Topo<br />
Satellite<br />
Monterey Soledad<br />
Paso Robles<br />
Streets<br />
San Luis<br />
Obispo<br />
Santa Maria<br />
Lompoc<br />
Santa Barbara<br />
rsfield<br />
Lancaster<br />
Palmdale<br />
Victorville<br />
Kingman<br />
Lake Havasu<br />
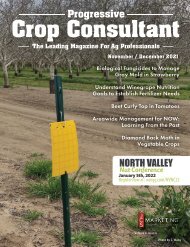
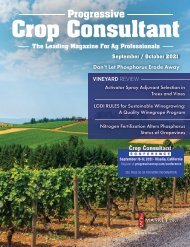
Almond Orchards<br />
Walnut Orchards<br />
Pistachio Orchards<br />
Pecan Orchards<br />
Figure 1. Map of the California Central Valley with all participating almond (red), pistachio (green) and walnut (blue) orchards.<br />
Background<br />
One can consider that the currency<br />
of nut trees are non-structural<br />
carbohydrates (NSCs), meaning<br />
sugar and starch. Carbohydrates provide<br />
the energy for growth, defense, and<br />
healthy flowering, ultimately resulting<br />
in yield. Soluble carbohydrates or sugar,<br />
can be considered as the cash that flows<br />
around the tree assuring growth and<br />
paying for services like defense from<br />
pests, frost, or mineral uptake. Starch is<br />
the form of currency that can be considered<br />
as the savings account, which is<br />
stored in the wood and roots of the tree<br />
during dormancy to be used in the following<br />
spring. Seasonal trends of sugars<br />
and starches are highly dynamic and<br />
can fluctuate with species, variety, tree<br />
age, temperature, climate, and management<br />
practices.<br />
The physiological changes in terms<br />
of carbohydrate dynamics a tree<br />
undergoes in preparation for dormancy<br />
especially in warmer climates, is still<br />
poorly understood. This is especially<br />
true due to the negative effects resulting<br />
from climate variability including<br />
the decrease in winter fog, chilling<br />
hours, winter drought, and an increase<br />
in annual temperatures. To better<br />
understand the seasonal fluctuations<br />
of carbohydrates, we decided to take<br />
an accelerated approach to do research<br />
in trees. Instead of having a single<br />
study with few variables, we use the<br />
entire Central Valley as our research<br />
laboratory. To accomplish such a task,<br />
we take a citizen scientist approach with<br />
the help from growers, farm advisors,<br />
and commodity boards. From ~450<br />
sites around the state, walnut, almond,<br />
and pistachio growers send us monthly<br />
samples of twigs and bark based on a<br />
very simple and fast protocol. Monthly<br />
samples allow us to track the seasonal<br />
trends over several years so that we may<br />
make well-informed decisions on the<br />
timing and nature of our management<br />
practices.<br />
Protocol<br />
Growers simply clip one twig from<br />
three representative trees, about four<br />
inches at the base of the current season’s<br />
growth, remove the bark and drop the<br />
three sticks and bark in an envelope and<br />
mail it to us with information including<br />
the name of the site, date, species and<br />
variety, orchard age, and latitude and<br />
longitude. Once the samples reach us<br />
through the mail, we dry them, grind<br />
them, weigh them, and perform a<br />
chemical analysis in the laboratory<br />
to determine the amount of sugar<br />
and starch of each sample. We then<br />
upload all results to our web-based<br />
interactive map (Figure 1) (https://<br />
mzwienie.shinyapps.io/Shiny_test/) and<br />
data analysis tool (https://zlab-carbobservatory.herokuapp.com/)<br />
where<br />
growers can access their data in real<br />
time and follow their own trends of<br />
starch and sugar in each orchard they<br />
sample. One can also compare multiple<br />
orchards at a time. All analyses are free<br />
of charge to participants.<br />
Results<br />
Figure 2 (see page 22) shows<br />
the 2016/17 seasonal trends of<br />
carbohydrates in in walnuts, almonds<br />
and pistachios. Higher levels of<br />
Continued on Page 22<br />
20 Progressive Crop Consultant <strong>March</strong>/April <strong>2019</strong>
<strong>March</strong>/April <strong>2019</strong><br />
www.progressivecrop.com<br />
21
NSC_wood<br />
300<br />
200<br />
100<br />
2016 winter level<br />
2017 boom<br />
Carbohydrate recovery<br />
2017 pre dormancy level<br />
species<br />
almond<br />
pistachio<br />
walnut<br />
Figure 2. Seasonal<br />
patterns of soluble<br />
sugars and starch<br />
concentration in<br />
three major tree<br />
crop species walnut,<br />
almond and<br />
pistachio during<br />
the 2016-2017<br />
seasons. Each<br />
data point represents<br />
a single<br />
orchard. Lines are<br />
running average<br />
content of the<br />
total carbohydrate<br />
concentration in<br />
wood.<br />
0<br />
300<br />
400<br />
Julian_Day<br />
500<br />
600<br />
Figure 3. Season<br />
dynamics and<br />
relative content of<br />
soluble sugars and<br />
starch in wood,<br />
bark, and total in<br />
walnut twigs. Despite<br />
high variation<br />
in total content<br />
ration between<br />
sugars and starch<br />
remains relatively<br />
constant throughout<br />
the year.<br />
Concentration [mg/g DW]<br />
Relative Content<br />
300<br />
200<br />
150<br />
100<br />
50<br />
0<br />
1.0<br />
0.8<br />
0.6<br />
0.4<br />
Wood<br />
NSCs<br />
Starch<br />
2016 2017<br />
Soluble carbohydrates<br />
Starch<br />
Bark<br />
Twig<br />
2016 2017 2016 2017<br />
0.2<br />
0.0<br />
2016 2017<br />
Oct Nov Dec Jan Feb Mar Apr May Jun Jul Aug Sep Oct<br />
2016 2017 2016 2017<br />
Oct Nov Dec Jan Feb Mar Apr May Jun Jul Aug Sep Oct Oct Nov Dec Jan Feb Mar Apr May Jun Jul Aug Sep Oct<br />
Continued from Page 20<br />
carbohydrate in the winters of 2016<br />
and 2017 provide the carbohydrates<br />
or energy to support spring bloom.<br />
During summer, all species reduced<br />
reserves to low levels reflecting a<br />
demand for carbohydrates to support<br />
yield and tree growth that exceeds or<br />
is equal to photosynthetic supply. In<br />
the fall, carbohydrate levels recover<br />
and accumulate reserves going into<br />
dormancy and ultimately for the<br />
following spring. Interestingly, walnut<br />
shows symptoms of very late recovery<br />
underlying the need for the postharvest<br />
management even in October.<br />
Pistachio (green) accumulated almost<br />
twice as much carbohydrate in the fall<br />
of 2017 compared to 2016 potentially<br />
reflecting its strong alternating crop<br />
behavior—2016 was considered an OFF<br />
year, 2017 was an ON year, and 2018<br />
was an OFF year, potentially supported<br />
by an increased accumulation of NSCs.<br />
We also found that from preliminary<br />
analyses of data from the Carbohydrate<br />
Observatory that starch to soluble<br />
sugars ratio is relatively constant during<br />
a year (Figure 3).<br />
The citizen science approach allows us<br />
to look across multiple variables like<br />
climate, tree age, rootstock, yield, etc.<br />
Initial looks at the accumulation of<br />
starch and sugar versus tree age revealed<br />
that older trees tend to accumulate<br />
much higher levels of carbohydrates in<br />
twigs potentially reflecting their reduced<br />
relative growth in relation to leaf<br />
biomass and increase of yield potential<br />
(tree investment in reproduction). This<br />
information also allows for assessing<br />
the goal of carbohydrate accumulation<br />
during post-harvest management while<br />
preparing trees for dormancy within<br />
each age group.<br />
Continued on Page 24<br />
22 Progressive Crop Consultant <strong>March</strong>/April <strong>2019</strong>
nitrogen you can<br />
rely on<br />
Nitrogen is one of the most important nutrients required by plants.<br />
It supports overall plant health, yet is easily lost. N-Sure ® is a slow<br />
release liquid fertilizer that can be applied as a foliar spray and<br />
delivers nitrogen for up to 10 weeks in the soil. The slow release<br />
formulation makes N-Sure ® a convenient and safe<br />
nitrogen source you can rely on.<br />
Crop Vitality Specialists can provide assistance regarding<br />
application, blending, field studies and technical data.<br />
Learn more about N-Sure ® on cropvitality.com<br />
Start a Conversation today with Your Crop Vitality Specialist<br />
Call (800) 525-2803, email info@cropvitality.com or visit CropVitality.com<br />
©<strong>2019</strong> Tessenderlo Kerley, Inc. All rights reserved. N-Sure ® is a registered trademark of Tessenderlo Kerley, Inc.<br />
<strong>March</strong>/April <strong>2019</strong><br />
www.progressivecrop.com<br />
23
Wood<br />
Bark<br />
Total<br />
NSCs concentration<br />
300<br />
250<br />
200<br />
150<br />
100<br />
50<br />
0<br />
2016<br />
2016<br />
2016<br />
Figure 4. Relationship<br />
between tree<br />
age (planting time)<br />
and 2017 carbohydrate<br />
content in<br />
twigs during winter<br />
months and during<br />
summer. Winter<br />
content of NSCs<br />
was much higher<br />
in older trees then<br />
in young trees<br />
however this difference<br />
was not as<br />
pronounced during<br />
summer.<br />
Year of planting Year of planting Year of planting<br />
Continued from Page 22<br />
Our newest data analysis tool (http://<br />
zlab-carb-observatory.herokuapp.com;<br />
Figure 5) allows anyone to compare<br />
different orchards of any of the three<br />
nut species with any combination of<br />
differences. For example, Figure 5<br />
compares two different walnut orchards,<br />
one old dry farmed-dying orchard<br />
(in green) located in Paso Robles and<br />
one young organic irrigated orchard<br />
in Winters. The old dry farm has no<br />
reserves in the summer and is using<br />
everything it possibly can to survive. It<br />
likely puts little effort into making new<br />
vegetative growth.<br />
Conclusions<br />
In the future, we hope to look further<br />
into how starch and sugar content relate<br />
to variety, climate variations, yield, and<br />
management practices. We need more<br />
data and more participation by growers<br />
to find the answers to these questions.<br />
Please consider joining our long-term<br />
study!<br />
Carbohydrates [mg/g DW]<br />
400<br />
350<br />
300<br />
250<br />
200<br />
150<br />
100<br />
50<br />
0<br />
Jul 2016 Jan 2017 Jul 2017 Jan 2018<br />
Date<br />
Jul 2018<br />
All farms<br />
Old Dry Farmed Walnuts<br />
Young Irrigated Walnuts<br />
Figure 5. Comparison<br />
of two<br />
different walnut<br />
orchards, one<br />
old dying orchard<br />
(in green)<br />
located in Paso<br />
Robles and one<br />
young organic<br />
irrigated orchard<br />
in Winters.<br />
Interested in Participating?<br />
Please contact Anna Davidson by email<br />
adavidson@ucdavis.edu or by phone<br />
(815) 212-4409.<br />
Please go to our website to access more<br />
information, our protocol, map and<br />
data analysis tools.<br />
http://www.plantsciences.ucdavis.edu/<br />
plantsciences_faculty/zwieniecki/CR/<br />
cr.html<br />
Comments about this article? We want<br />
to hear from you. Feel free to email us at<br />
article@jcsmarketinginc.com<br />
24 Progressive Crop Consultant <strong>March</strong>/April <strong>2019</strong>
40 Years of Farming Experience<br />
The Foundation of your Fertilizer Program<br />
High Phos is a unique source of phosphorus with<br />
potassium and chelated iron designed for use in the soil.<br />
Phosphorus is required in high levels to supply the many<br />
energy requiring reactions in the metabolism of the plant. The<br />
polyphosphate is readily converted into usable forms and is<br />
soluble in the soil solution for uptake into the plant.<br />
The balanced formulation of essential nutrients contains<br />
organic and amino acids to stabilize the nutrients and<br />
facilitate their chelation, uptake, translocation and use.<br />
• #1 choice for supplemental phosphorus<br />
• Enhance the phosphorous levels in your soil<br />
• Greater root growth and increased uptake<br />
of phosphorous<br />
• Growers use less and save valuable time<br />
and money due to the effectiveness of<br />
High Phos<br />
WRT Inc is a licensed distributor of<br />
Bio Si and Baicor products.<br />
Contact Joseph Witzke: 209.720.8040 or Visit <strong>March</strong>/April us online <strong>2019</strong> at www.progressivecrop.com<br />
www.wrtag.com25
Climate Change and<br />
California Agriculture<br />
By: Tapan B. Pathak | Division of Agriculture and<br />
Natural Resources, University of California, Merced,<br />
CA, Mahesh L. Maskey, Jeffery A. Dahlberg, Khaled M.<br />
Bali, Daniele Zaccaria | University of California, Division<br />
of Agriculture and Natural Resources (UCANR), Faith<br />
Kearns | Division of Agriculture and Natural Resources<br />
California Institute for Water Resources, University of<br />
California, Oakland, CA<br />
Introduction<br />
California is the largest and most<br />
diverse agricultural state that<br />
produces over a third of the<br />
country's vegetables and two-thirds of<br />
fruits and nuts. Among 400 different<br />
commodities, California is a leading<br />
producer of many of those commodities<br />
[1]. At the same time, changing climate<br />
signals such as temperatures, precipitation<br />
patterns, extreme calamities and<br />
water availability poses many challenges<br />
to the state’s agricultural sector, which<br />
would not only translate into national<br />
food security issues but also economic<br />
impacts that could disrupt state and<br />
national commodities systems.<br />
Recent publication by Pathak et al.<br />
[2] outlined a detailed literature<br />
review to document the most current<br />
understanding on California´s climate<br />
trends in terms of temperature,<br />
precipitation, snowpack, and extreme<br />
events such as heat waves, drought, and<br />
flooding, and their relative impacts on<br />
the state’s highly productive and diverse<br />
agricultural sector. For instance, both<br />
average and extreme temperatures<br />
and precipitation patterns influence<br />
crop yields, pest, and the length of the<br />
growing season. Because of climate<br />
change, extreme events, such as heat<br />
waves, floods, and droughts, may lead<br />
to larger production losses, earlier<br />
spring arrival, and warmer winters<br />
due to temperature increases allow<br />
disease and pest pressure increase,<br />
shrinking snowpack leading to a greater<br />
risk for agriculture water availability.<br />
This paper summarizes key findings<br />
from that paper in the context of: (a)<br />
historic trends and projected changes<br />
in temperature, precipitation and heat<br />
waves; (b) current situation and future<br />
expectations of drought and flood; and<br />
(c) consequent impacts on agriculture.<br />
Climate change trends in<br />
California<br />
The climate of California varies from<br />
hot desert to subarctic environments<br />
lying in the proximity to the Pacific<br />
Coast with Mediterranean climate<br />
influenced by the cold ocean currents<br />
and offshore winds. This section reviews<br />
historical and projected trends of key<br />
climatic parameters: temperature,<br />
precipitation, and extreme events like<br />
heat waves, drought and floods.<br />
Temperature<br />
Climate change in California is often<br />
exemplified by increased temperature in<br />
both space and time. While temperature<br />
has globally increased by 1.4°F since<br />
Degrees (F)<br />
2.0<br />
0.0<br />
-2.0<br />
1880, the rate of increase in minimum<br />
temperature is greater than that of<br />
mean or maximum temperatures.<br />
Figure 1 shows that observed mean<br />
temperature in the state has been<br />
increasing from 1.3 to 2.3 °F in the past<br />
century [3]. The recent severe drought<br />
in the state has been exaggerated by<br />
increased temperature and insignificant<br />
precipitation. As seen in Table 1 (see<br />
page 27), summer after spring happens<br />
with the largest warming trends and<br />
least warming is experienced during<br />
winter and spring after implying<br />
inter-annual variability for the period<br />
from 1895 to 2018 [4]. However, least<br />
warming during fall and winter has<br />
been reported for the period 1895-2010.<br />
Spatial variation of temperature also<br />
reveals that Southern part of the state<br />
1900 1910 1920 1930 1940 1950 1960 1970 1980 1990 2000 2010<br />
Figure 1: California statewide mean temperature departure in (°F), October through September<br />
[3]. Black line denotes 11-year running mean.<br />
26 Progressive Crop Consultant <strong>March</strong>/April <strong>2019</strong>
experiences greater warming than<br />
compared to Northern California.<br />
Outcome of different climate models<br />
reveals that there will be more<br />
pronounced increment in summer<br />
temperature than in winter resulting<br />
into more warming in inland areas<br />
than in coastal regions. The increasing<br />
temperature trends will decrease the<br />
snow-to-precipitation ratio [5]. The<br />
state’s Sierra snowpack starts to melt<br />
earlier and faster than usual due to<br />
frequent heat spells [6]. For instance,<br />
future trends for far north and far<br />
south of the state are presented in<br />
Figure 2 (see page 28) which suggests<br />
how temperatures will continue to<br />
increase until 2100 under different<br />
emission scenarios from different<br />
climate models. Precipitation is a<br />
crucial parameter to state’s water<br />
supply for the agricultural purposes<br />
and such parameter exhibits<br />
significant inter-annual variability<br />
[3]. The variability of precipitation in<br />
California is a unique phenomenon<br />
implying that such unpredictability<br />
is more notable in California than<br />
Table 1: California temperature departures, 1895-2018, for mean, max and min linear trends in °C<br />
within the period shown [4].<br />
Linear departures Annual Winter Spring Summer Fall<br />
A. Mean<br />
Temperature<br />
1895-2018 +1.88<br />
1949-2018<br />
1975-2018<br />
B. Max temperature<br />
1895-2018<br />
1949-2018<br />
1975-2018<br />
C. Min temperature<br />
1895-2018<br />
1949-2018<br />
1975-2018<br />
+2.03<br />
+1.32<br />
+1.58<br />
+1.18<br />
+0.79<br />
+2.18<br />
+2.87<br />
+1.85<br />
+1.55<br />
+4.74<br />
+2.12<br />
+1.68<br />
+4.74<br />
+2.39<br />
+1.42<br />
+4.74<br />
+1.85<br />
+1.20<br />
+0.46<br />
+0.89<br />
+0.80<br />
+0.29<br />
+2.39<br />
+1.60<br />
+1.21<br />
+1.72<br />
+3.07<br />
+2.02<br />
+1.59<br />
+2.82<br />
+0.86<br />
+0.75<br />
+3.31<br />
+3.18<br />
+2.43<br />
+1.70<br />
+0.89<br />
+0.68<br />
+1.02<br />
+0.59<br />
+0.04<br />
+2.39<br />
+2.36<br />
+1.40<br />
other parts of the country. Having Mediterranean climate, most of the rainfall<br />
happens during cool season (October to April). Despite having unnoticeable<br />
temporal pattern, study shows total annual precipitation has increased at an average<br />
rate of 5 millimeter (mm) per decade for the contiguous 48 states. In addition,<br />
there is increase in extreme single day precipitation events and increased temporal<br />
Continued on Page 28<br />
BANKABLE BLOOMS<br />
A strong bloom leads to improved<br />
set and higher yields.<br />
The investments you make now make all the difference later.<br />
Proven in your area to provide improved:<br />
plant vigor, nutrient uptake, root growth,<br />
and resistance to environmental stress.<br />
Choose Acadian ® for consistently higher yield<br />
• Trials and technical experts local to your area<br />
• Consistent quality and supply<br />
• 100% Ascophyllum nodosum<br />
• 30 years of lab and field trials<br />
Contact your local<br />
Acadian ® representative.<br />
Daniel Cathey (Northern CA)<br />
916-578-6207<br />
Chris Coolidge (Central CA)<br />
559-779-3579<br />
Taylor Hoover (Coastal CA)<br />
949-547-0880<br />
Annalisa Williams (CA)<br />
805-801-5238<br />
Jeff Downs (SoCal/AZ)<br />
559-285-8448<br />
Acadian Plant Health is a division of Acadian Seaplants Limited,<br />
Acadian ® is a registered trademark of Acadian Seaplants Limited.<br />
<strong>March</strong>/April <strong>2019</strong><br />
www.progressivecrop.com<br />
27
Maximum Temperature ( F)<br />
Maximum Temperature ( F)<br />
instance, future trends for far north and far south of the state are presented in Figure 2 which<br />
suggests how temperatures will continue to increase until 2100 under different emission scenarios<br />
from different climate models.<br />
86<br />
84<br />
82<br />
80<br />
78<br />
76<br />
74<br />
72<br />
86<br />
84<br />
82<br />
80<br />
78<br />
76<br />
74<br />
72<br />
1960 1980 2000 2020 2040 2060 2080<br />
94<br />
92<br />
90<br />
88<br />
86<br />
84<br />
82<br />
80<br />
78<br />
76<br />
74<br />
72<br />
1960 1980 2000 2020 2040 2060 2080<br />
94<br />
92<br />
90<br />
88<br />
86<br />
84<br />
82<br />
80<br />
78<br />
76<br />
74<br />
72<br />
1960 1980 2000 2020 2040 2060 2080 1960 1980 2000 2020 2040 2060 2080<br />
Figure 2: California<br />
historical<br />
and projected<br />
maximum temperature<br />
for the<br />
period 1950-2099<br />
for Shasta (top),<br />
and Los Angeles<br />
County (bottom).<br />
Left: projection<br />
based on RCP4.5<br />
and Right: RCP8.5<br />
[7]. These annual<br />
values are from<br />
four climate models:<br />
HadGEM2-ES<br />
(red), CNRM-CM5<br />
(cyan), CanESM2<br />
(dark yellow)<br />
and MIROC5<br />
(magenta).<br />
Figure 2: California historical and projected maximum temperature for the period 1950-2099 for<br />
Shasta (top), and Los Angeles County (bottom). Left: projection based on RCP4.5 and Right: RCP8.5<br />
[7]. These annual values from four climate models: HadGEM2-ES (red), CNRM-CM5 (cyan),<br />
CanESM2 (dark yellow) and MIROC5 (magenta).<br />
Year<br />
Region Name<br />
3.2. Precipitation 1900 1925 1950 1975 2000 2018<br />
North Precipitation Coast is a crucial 1664 parameter 1693 to state’s water 2168 supply for 1925 the agricultural 1509purposes 1427 and<br />
such North parameter Central exhibits 1132 significant inter-annual 1114 variability 1525 [3]. The 1294 variability 1156 of precipitation 912in<br />
California Northeastis a unique phenomenon 492 implying 478 that such 655 unpredictability 519 is more 491 notable in California 493<br />
than other parts of the country. Having Mediterranean climate, most of the rainfall happens during<br />
Sierra<br />
1049 956 1667 1140 1159 958<br />
cool season (October to April). Despite having unnoticeable temporal pattern, study shows total<br />
Sacramento-Delta 438 420 626 448 567 459<br />
annual precipitation has increased at an average rate of 5 millimeter (mm) per decade for the<br />
Central Coast 531 522 750 526 753 549<br />
contiguous 48 states. In addition, there is with increase in extreme single day precipitation events<br />
and San increased Joaquin Valley temporal 293 precipitation 256 variability as 296 observed in Table 246 2. 354 282<br />
South Coast 333 290 246 293 376 297<br />
South Table Interior 2: California annual 383 (calendar 376 year) precipitation 271 every 25 years 345except 2018383<br />
starting from 345 1900<br />
in mm in 11 climatological regions [4]<br />
Mohave Desert 127 158 95 101 116<br />
Sonoran Desert 61 Year 115 38 53 51<br />
Region Name<br />
1900 1925 1950 1975 2000 2018<br />
North Coast 1664 1693 2168 1925 1509 1427<br />
North Central 1132 1114 1525 1294 1156 912<br />
Northeast 492 478 655 519 491 493<br />
Continued from Page 27<br />
Sierra 1049 956 1667 1140 1159 958<br />
Sacramento-Delta 438 420 626 448 567 459<br />
precipitation variability as observed in<br />
Table 2.<br />
Projections depicted from global<br />
climate model surmise that the nature<br />
of state’s precipitation will probably<br />
change with more intense atmospheric<br />
rivers and longer dry spells between<br />
them. The simulations from general<br />
circulation models (GCM) suggest<br />
that California will maintain its<br />
Mediterranean climate with relatively<br />
cool and wet winters and hot dry<br />
summers. As expected, insignificant<br />
linear trends at a 95 percent confidence<br />
28 Progressive Crop Consultant <strong>March</strong>/April <strong>2019</strong><br />
interval is observed in Figure 3 (see<br />
page 29) implying that that variability<br />
of annual precipitation will continue<br />
during the next century and that the<br />
state will be vulnerable to both drought<br />
and flood.<br />
Extreme Heat Waves<br />
California is expected to have increased<br />
intensity and frequency of heat waves.<br />
As an illustration, Figure 4 (see<br />
page 30) shows how heat events are<br />
increasing and will continue under<br />
different emission scenarios for Kern<br />
County [7]. As seen, the number of<br />
such events will be increased more in<br />
129<br />
95<br />
Table 2: California<br />
annual (calendar<br />
year) precipitation<br />
every 25 years except<br />
2018 starting<br />
from 1900 in mm<br />
in 11 climatological<br />
regions [4].<br />
magnitude under RCP 8.5 than under<br />
RCP 4.5. Several studies show that if<br />
the night temperature sustained above<br />
normal, the plants keeps metabolizing<br />
starch as photosynthetic sugars may<br />
be used in the rapid plant growth,<br />
consequently resulting into reduced dry<br />
matter. Such may cause considerable<br />
damage to crop and yields depending<br />
on whether heat waves occur during the<br />
critical crop growth stage [8].<br />
Drought and Flood<br />
The effect of ongoing drought is not<br />
only limited to agricultural crop<br />
production but also risk of wild fires
Mediterranean climate with relatively cool and wet winters and hot dry summers. As expected,<br />
insignificant linear trends at a 95 percent confidence interval is observed in Figure 3 implying that<br />
that variability of annual precipitation will continue during the next century and that the state will<br />
Figure 3: Historical and projected precipitation trend for the Sacramento. Left: projection based on RCP4.5 and Right: RCP8.5 [7]. These annual<br />
values from be vulnerable four climate to models: both HadGEM2-ES drought and (red), flood. CNRM-CM5 (cyan), CanESM2 (dark yellow) and MIROC5 (magenta).<br />
Precipitation (inches/year)<br />
Emissions peak around 2040, then decline (RCP 4.5) Emissions continue to rise strongly through 2050<br />
and plateau around 2100(RCP 8.5)<br />
Range of annual average values from all 32 Modeled Data (2006-2099) Modeled Data (2006-2099)<br />
LOCA downscaled climate models HadGEM2-ES<br />
Range of annual average values from all 32<br />
Modeled Variability Envelope CNRM-CM5<br />
LOCA downscaled climate models HadGEM2-ES<br />
Observed Data (1950-2005) CanESM2<br />
Modeled Variability Envelope CNRM-CM5<br />
MIROC5<br />
Observed Data (1950-2005)<br />
CanESM2<br />
MIROC5<br />
50<br />
45<br />
40<br />
35<br />
30<br />
25<br />
20<br />
15<br />
10<br />
5<br />
Precipitation (inches/year)<br />
5<br />
1960 1980 2000 2020 2040 2060 2080 1960 1980 2000 2020 2040 2060 2080<br />
that dries out vegetation Figure 3: Historical due declining and projected ground precipitation water trend more for flooding the Sacramento. events Left: and projection further influence based on spring streamflow<br />
levels. Decision RCP4.5 makers and are Right: aware RCP8.5 of such [7]. These measure annual values [10]. from For four instance, climate models: in the HadGEM2-ES Sacramento River (red), basin experience<br />
referring popular CNRM-CM5 drought index (cyan), called CanESM2 the (dark Palmer yellow) and MIROC5 earlier peak (magenta). runoff time after last 40 decades of last century[11]<br />
Drought Severity Index (PDSI) [9]. The historical reducing the ability to refill reservoirs after the flood season is<br />
variability of the Extreme PDSI tells Heat us Waves the state’s most severe over and indicating a flood-drought pattern within the state<br />
drought conditions that happened during the 2013-14 which may potentially invite frequent flood events in California.<br />
winter over the last California 122 years of is expected record. to have increased intensity Figure 5 and frequency Table 3 (see of heat page waves. 31) illustrate As an how the monthly<br />
illustration, Figure 4 shows how heat events are stream increasing flow peaks and will continue be shifted under by the different end of the century for<br />
Warmer environments emission also scenarios possibly for increase Kern County both [7]. winter As seen, the number of such events will be increased more in<br />
flooding and summer magnitude water under deficits RCP and 8.5 there than under will be<br />
Continued on Page 30<br />
RCP 4.5. Several studies show that if the night temperature<br />
sustained above normal, the plants keeps metabolizing starch as photosynthetic sugars may be used<br />
in the rapid plant growth, consequently resulting into reduced dry matter. Such may cause<br />
Control Pocket Gophers in Tree Fruit & Nuts<br />
considerable damage to crop and yields depending on whether heat waves occur during the critical<br />
crop growth stage [8].<br />
55<br />
50<br />
45<br />
40<br />
35<br />
30<br />
25<br />
20<br />
15<br />
10<br />
- Effective Control<br />
- Preventative perimeter<br />
treatments intercept<br />
gophers before they<br />
enter the grove<br />
Photo by Wayne Lynch<br />
LEARN<br />
MORE<br />
25 lb. Pail — 60 / Pallet<br />
888-331-7900 • www.liphatech.com<br />
Reduce Tree Fruit Damage<br />
<strong>March</strong>/April <strong>2019</strong><br />
www.progressivecrop.com<br />
29
Continued from Page 29<br />
American River. As observed, while the peak happened in<br />
the month of May over the last 90 years, such will be shifted<br />
as earlier as January.<br />
Key impact on California Agriculture<br />
Global crop production needs to be double by 2050 to meet<br />
the projected demand for food from rising population,<br />
diet shifts, and increasing biofuels consumption [12].<br />
Increased temperature due to climate change can intensify<br />
this challenge. As defined in Table 4 (see page 31),<br />
individual crops have specific optimum temperature ranges<br />
for optimum production and exposure to extremely high<br />
temperatures during these growth stages can affect growth<br />
and yield.<br />
Figure 6 (see page 32) reveals the impacts of climate<br />
change on crop yields for different field crops such as<br />
alfalfa, cotton, maize, winter wheat, tomato, rice, and<br />
sunflower in Yolo County and throughout the Central<br />
Valley assessed through a process-based crop model<br />
[14-15]. Alfalfa yields were predicted to increase under<br />
climate change, while yields from tomato and rice remain<br />
unaffected. Overall, 4°C increase in temperature may<br />
reduce yields from most fruits by more than 5 percent,<br />
which may reach up to 40 percent in some important<br />
regions [16]. However, these modeling projections did not<br />
take into account technological trends, water stress, and<br />
other management practices. Therefore, the yield numbers<br />
55<br />
50<br />
45<br />
40<br />
35<br />
30<br />
25<br />
20<br />
15<br />
10<br />
80<br />
70<br />
60<br />
50<br />
Warm Days<br />
< Historical (1950-2005) Future (2006-2099) ><br />
5<br />
0 1960 1980 2000<br />
Historical (1950-2005) Future (2006-2099)<br />
Observed historical and Modeled future projections<br />
modeled historical data<br />
Warm Nights<br />
< Historical (1950-2005) Future (2006-2099) ><br />
Figure 4: Historical and projected Heat days and Warm nights for K<br />
based on RCP4.5 and Bottom: RCP8.5 [7].<br />
Drought and Flood<br />
15<br />
The effect of ongoing drought is not only limited to agricultu<br />
10<br />
wild<br />
5<br />
fires that dries out vegetation due to declining ground water<br />
0<br />
1960 1980 2000 2020 2040 2060 2080 2100<br />
of such measure referring popular drought index called the Palm<br />
[9]. 90 The historical variability of the PDSI tells us the state’s most s<br />
Historical (1950-2005) Future (2006-2099)<br />
80<br />
Observed historical and Modeled future projections<br />
modeled historical data<br />
happened during the 2013-14 winter over the last 122 years of rec<br />
40<br />
Warmer environments also possibly increase both winter flo<br />
30<br />
40<br />
and 30<br />
20<br />
there will be more flooding events and further influence spri<br />
20<br />
10<br />
the 10 Sacramento River basin experience earlier peak runoff time af<br />
0<br />
0<br />
1960 1980 2000 2020 2040 2060 2080 2100 [11] 1960 reducing 1980 the 2000 ability 2020to refill 2040 reservoirs 2060 2080after 2100 the flood season i<br />
Year<br />
Year<br />
flood-drought pattern within the state which may potentially inv<br />
Observed (1950-2005) HadGEM2-ES (Warm/Drier) CNRM-CM5 (Cooler/Wetter) CanESM2 (Average) MIROC5 (Complement) Observed (1950-2005) HadGEM2-ES (Warm/Drier) CNRM-CM5 (Cooler/Wetter) CanESM2 (Average) MIROC5 (Complement)<br />
Figure California. 4: Historical Figure and projected 5 and Heat Table days 3 illustrate and Warm nights how the for Kern monthly stream<br />
Figure 4: Historical and projected Heat days and County. Warm end Top: of nights projection the century for Kern based County. for on American RCP4.5 Top: and projection River. Bottom: As RCP8.5 observed, [7]. while the pe<br />
based on RCP4.5 and Bottom: RCP8.5 [7].<br />
over the last 90 year, such will be shifted as earlier as January.<br />
30 Progressive Crop Consultant <strong>March</strong>/April <strong>2019</strong><br />
Drought and Flood<br />
55<br />
50<br />
45<br />
40<br />
35<br />
30<br />
25<br />
20<br />
15<br />
10<br />
80<br />
70<br />
60<br />
50<br />
40<br />
30<br />
20<br />
10<br />
0<br />
55<br />
50<br />
45<br />
40<br />
35<br />
30<br />
25<br />
20<br />
2020 2040 2060 2080 2100<br />
100<br />
can swing, depending on the type of stress and adaptation<br />
measures implemented.<br />
Many fruit and nut crops require cold temperatures in<br />
winter to break dormancy, which defines a location’s<br />
suitability for the production of many tree crops. These<br />
fruit and nut species adapted to temperate or cool<br />
subtropical climates where chilling each winter is needed<br />
to achieve homogeneous and simultaneous flowering and<br />
steady crop yields. The lack of adequate chilling hours<br />
as projected by climate change can delay pollination and<br />
foliation that reduces fruit yield and quality. Climate<br />
change may have impact on the incidence and severity<br />
of plant pests and disease and influence the further coevolution<br />
of plants and their pathogens. Moreover, plant<br />
diseases could be used as indicators of climate change in<br />
which the environment can move from disease-suppressive<br />
to disease-conducive or vice versa.<br />
Conclusions and Future Recommendations<br />
A range of studies on trends and impacts of climate change<br />
on California agriculture presented in this paper justifies<br />
70<br />
60<br />
50<br />
Warm Days<br />
< Historical (1950-2005) Future (2006-2099) ><br />
5<br />
0 1960 1980 2000<br />
1960<br />
Historical (1950-2005) Future (2006-2099)<br />
Observed historical and Modeled future projections<br />
modeled historical data<br />
1980 2000 2020<br />
Year<br />
Continued on Page 32<br />
55 < Historical (195<br />
50<br />
45<br />
40<br />
35<br />
30<br />
25<br />
20<br />
15<br />
10<br />
5<br />
0<br />
2020 2040 2060 2080 2100 1960 1980<br />
100<br />
90<br />
80<br />
Observed<br />
70<br />
60<br />
50<br />
40<br />
30<br />
20<br />
10<br />
2040 2060 2080 5 of 2100 8<br />
0<br />
1960 1980<br />
Observed (1950-2005) HadGEM2-ES (Warm/Drier) CNRM-CM5 (Cooler/Wetter) CanESM2 (Average) MIROC5 (Complement) Observed (1950-2005) HadGEM2-ES<br />
Observed HadGEM2-ES (Warmer/Drier) CNRM-CM5 (Cooler/Wetter)<br />
CanESM2 (Average) CanESM2 (Average)<br />
9,000 10,000<br />
Historical<br />
modeled h
e last 122 years of record.<br />
over the last 90 year, such will be shifted as earlier as January.<br />
rease both winter flooding and summer water deficits<br />
Observed HadGEM2-ES (Warmer/Drier) CNRM-CM5 (Cooler/Wetter)<br />
CanESM2 (Average) CanESM2 (Average)<br />
urther influence spring streamflow [10]. For instance, in<br />
9,000<br />
10,000<br />
r peak runoff time after last 40 decades of last century Observed Data<br />
8,000<br />
1922-2014 9,000<br />
ter the flood 7,000<br />
8,000<br />
season is over and indicating a Model Projections<br />
6,000<br />
1950-2099 7,000<br />
may potentially invite frequent flood events in<br />
6,000<br />
5,000<br />
5,000<br />
w the monthly 4,000 stream flow peaks will be shifted by the 4,000<br />
3,000<br />
3,000<br />
served, while the peak happened in the month of May<br />
2,000<br />
2,000<br />
arlier as 1,000 January.<br />
1,000<br />
Oct Nov Dec Jan Feb Mar<br />
• Fire Blight<br />
r/Wetter)<br />
10,000<br />
ed Data<br />
14 9,000<br />
8,000<br />
rojections<br />
99 7,000<br />
6,000<br />
5,000<br />
4,000<br />
3,000<br />
2,000<br />
1,000<br />
Figure 5: Historical and projected monthly stream flow (cubic • feet Gummosis per second) • Bot for Diseases American Riv<br />
Observed Data<br />
Fair Oaks. Left: projection based on RCP4.5 1922-2014 and Right: RCP8.5 [7].<br />
Model Projections<br />
1950-2099<br />
ENHANCES FRUIT COLOR<br />
Table 3: Magnitude of monthly stream flow (cubic feet per second) at midpoint of the hydrograp<br />
shown in Figure 5 [7]<br />
Use for, Tree Nuts, Stone<br />
Fruits, Apples, Pears, Citrus,<br />
Emission Scenario Observed HadGEM2-ES CNRM-CM5 Avocados, CanESM2 MIRO<br />
RCP 4.5 21,635 26,613 36,031 and Blueberries. 33,496 25,794<br />
Aug Sep Oct Nov Dec Jan Feb Mar Apr May Jun Jul Aug Sep<br />
Month<br />
Figure 5: Historical and projected monthly stream flow (cubic feet per second) for American<br />
River RCP at Fair 8.5 Oaks. Left: projection based 21,635 on RCP4.5 and Right: RCP8.5 27,290 [7].<br />
29,274 ALSO HELPS TO CONTROL 36,665 GROUND 25,556<br />
tream flow (cubic feet per second) for American River at<br />
SQUIRRELS, GOPHERS, MICE, AND VOLES.<br />
and Right: RCP8.5 [7].<br />
(cubic feet per second) at midpoint of the hydrographs<br />
ORGANIC TREE WASH<br />
ELIMINATES FOOD SOURCES THAT CAN CAUSE:<br />
• Canker<br />
Apr May Jun Jul Aug Sep Oct Nov Dec Jan Feb Mar Apr May Ju<br />
Month<br />
Month<br />
Emission Scenario Observed HadGEM2-ES CNRM-CM5 CanESM2 MIROC5<br />
RCP 4.5 21,635 26,613 36,031 33,496 25,794<br />
RCP 8.5<br />
21,635 27,290 29,274 36,665 25,556<br />
Begin Spraying at bud break or<br />
2 to 4 inch shoot growth, two<br />
quarts per 100 GPA.<br />
Table 3: Magnitude of monthly stream flow (cubic feet per second) at midpoint of the hydrographs<br />
shown in Figure 5 [7].<br />
M2-ES CNRM-CM5 CanESM2 MIROC5<br />
36,031 33,496 25,794<br />
Climatic<br />
Classification<br />
29,274 Crop 36,665 Temperature for 25,556<br />
Hot<br />
Warm<br />
Cool-Warm<br />
Cool<br />
Watermelon<br />
Melon<br />
Sweet<br />
potato<br />
Cucumber<br />
Pepper<br />
Sweet corn<br />
21-35<br />
21-32<br />
16-35<br />
16-35<br />
16-35<br />
Snap beans 16-30<br />
Tomato 16-30<br />
Onion<br />
Garlic<br />
10-30<br />
7-25<br />
20-25<br />
Turnip 10-35<br />
18-25<br />
Pea 10-30<br />
Potato 7-26<br />
Lettuce 5-26<br />
16-25<br />
Cabbage<br />
Broccoli<br />
Spinach<br />
Acceptable<br />
O<br />
Germination ( C)<br />
10-30<br />
10-30<br />
4-16<br />
Optimal<br />
Temperature<br />
O<br />
for yield( C)<br />
25-27 18-35<br />
20-25 12-30(35)<br />
16-18(25)<br />
Acceptable<br />
Temperature<br />
Growth Range<br />
O<br />
( C)<br />
7-30<br />
5-25<br />
5-25(30)<br />
5-25<br />
Repeat every 14 days, mixes<br />
well with fertilizers, we<br />
recommend using,<br />
PURE PROTEIN DRY 15-1-1<br />
Table 4: Temperature thresholds for selected vegetable crops [13].<br />
<strong>March</strong>/April <strong>2019</strong><br />
www.progressivecrop.com<br />
31
Continued from Page 30<br />
the importance of enhancing adaptive<br />
capacity of agriculture to reduce<br />
vulnerability to climate change and<br />
gain substantial benefits. The observed<br />
changes in climate added and will<br />
continue to add increasing pressure<br />
on agricultural production systems in<br />
California.<br />
Reduced chill, increased pest pressures,<br />
increased water demand and waterinduced<br />
stress, as well as variable and<br />
unreliable water supply are examples of<br />
factors that are projected to adversely<br />
impacting yield and quality of various<br />
crops grown in California. Such impacts<br />
may further intensify the challenges to<br />
meet the local and global food demands.<br />
For this reason, there is urgent need<br />
to address such issues with resource<br />
limitations and food security challenges.<br />
There is a clear need for localized<br />
agricultural adaptation research that<br />
could alleviate agricultural risks due to<br />
increased temperatures and extreme<br />
heat. Water being a central issue for<br />
California, there needs to be a priority<br />
on agricultural adaptation to water<br />
shortages. To help growers manage<br />
risks, it is important to develop locally<br />
relevant, need-based decision support<br />
tools that can effectively integrate<br />
various stressors to help growers make<br />
informed choices. Research only has<br />
value if it leads to informed decisionmaking,<br />
so stakeholder engagement<br />
should be the central component of<br />
climate and agricultural research.<br />
References<br />
1.CDFA (California Department of<br />
Food and Agriculture). California<br />
Agricultural Statistics Review<br />
2015-2016. Available online:<br />
https://www.cdfa.ca.gov/statistics/<br />
PDFs/2016Report.pdf (accessed on 16<br />
June 2017).<br />
2.Pathak, T.; Maskey, M.; Dahlberg,<br />
J.; Kearns, F.; Bali, K.; Zaccaria, D.<br />
Climate change trends and impacts on<br />
California agriculture: a detailed review.<br />
Agronomy, 2018, 8(3), 25.<br />
3.DWR (California Department<br />
of Water Resources). Hydroclimate<br />
Report. Water Year 2017.<br />
4.California Climate Tracker. Generate<br />
Products Available online: https://wrcc.<br />
dri.edu/Climate/Tracker-/CA/ (accessed<br />
on 19 January <strong>2019</strong>)<br />
5.DWR (California Department of<br />
Water Resources). California Climate<br />
Science and Data for Water Resources<br />
Percent Change<br />
10<br />
0<br />
-10<br />
-20<br />
-30<br />
10<br />
0<br />
-10<br />
-20<br />
-30<br />
10<br />
0<br />
-10<br />
-20<br />
-30<br />
Alfalfa<br />
2020 2040 2060 2080 2100 2020 2040 2060 2080 2100 2020 2040 2060 2080 2100<br />
Tomato<br />
2020 2040 2060 2080 2100 2020 2040 2060 2080 2100<br />
Cotton<br />
Safflower<br />
Rice<br />
Sunflower<br />
2020 2040 2060 2080 2100 2020 2040 2060<br />
2080 2100<br />
Maize<br />
2020 2040 2060<br />
Figure 6: Crop Yield response to warming Year in California’s Central Valley [14].<br />
Management. Available online:<br />
http://www.water.ca.gov/climatechange/<br />
docs/CA_-Climate_Science_and_Data_<br />
Final_Release_June_2015. pdf (accessed<br />
on 19 June 2017).<br />
6.Reid, C.E.; O’Neill, M.S.; Gronlund,<br />
C.J.; Brines, S.J.; Brown, D.G.; Diez-<br />
Roux, A.V.; Schwartz, J. Mapping<br />
community determinants of heat<br />
vulnerability. Environ. Health Perspect,<br />
2009, 117, 1730–1736.<br />
7.Cal-adapt. Exploring California’s<br />
Climate Change Research. Available<br />
online: http://cal-adapt.org/tools/<br />
annual-averages/#climatevar-=tasm<br />
ax&scenario=rcp45&lat=38.59375&l<br />
ng=-121.<br />
8.Wreford, A.; Adger, W.N. Adaptation<br />
in agriculture: historic effects of heat<br />
waves and droughts on UK agriculture.<br />
International Journal of Agricultural<br />
Sustainability, 2010, 8(4), 278-289.<br />
9.Zargar, A.; Sadiq, R.; Naser, B.;<br />
Khan, F.I. A review of drought indices.<br />
Environmental Reviews, 2011, 19, 333-<br />
349.<br />
10.Sommer, L. With Climate<br />
Change, California Is Likely To<br />
See More Extreme Flooding.<br />
Available online: http://www.npr.<br />
org/2017/02/28/517495739/withclimate-change-california-is-likelyto-see-mo-re-extreme-f<br />
looding, 2017<br />
(accessed on 19 June 2017).<br />
11.DWR (California Department of<br />
Water Resources). California Climate<br />
Science and Data for Water Resources<br />
Management. Available online: http://<br />
www.water.ca.gov/climatechange/docs/<br />
CA_-Climate_Science_and_Data_<br />
Final_Release_June_2015. pdf<br />
Wheat<br />
2080 2100<br />
A2 Higher Emissions Scenario<br />
B1 Lower Emissions Scenario<br />
12.Ray, D.K.; Mueller, N.D.; West,<br />
P.C.; Foley, J.A. Yield trends are<br />
insufficient to double crop production<br />
by 2050. PLoS One, 2013, 8, 1-7.<br />
13.Hatfield, J.; Boote. K.; Fay, P.;<br />
Hahn, L.; Izaurralde, C.; Kimball,<br />
B.A.; Mader, T.; Morgan, J.; Ort, D.;<br />
Polley, W.; Thomson, A.; Wolfe, D;<br />
Agriculture, In: The effects of climate<br />
change on agriculture, land resources,<br />
water resources, and biodiversity. A<br />
report by the U.S. Climate Change<br />
Science Program and the Subcommittee<br />
on Global Change Research,<br />
Washington DC., USA, pp 21-74, 2008<br />
14.Lee, J.; De Gryze, S; Six, J. Effect of<br />
climate change on field crop production<br />
in California’s Central Valley. Climatic<br />
Change, 2011, 109(1), 335-353.<br />
15.Jackson, L.E.; Wheeler, S.M.;<br />
Hollander, A.D.; O’Geen, A.T.; Orlove,<br />
B.S.; Six, J.; Sumner, D.A.;<br />
Santos-Martin, F.; Kramer, J.B.;<br />
Horwath, W.R.; Howitt, R.E.; Tomich,<br />
T.P. Case study on potential agricultural<br />
responses to climate change in a<br />
California landscape, Climatic Change,<br />
2011, 109(1), S407-S427.<br />
16.Zilberman, D.; Kaplan, S.<br />
Giannini Foundation of Agricultural<br />
Economics, University of California.<br />
An Overview of California’s<br />
Agricultural Adaptation to Climate<br />
Change. Available online: https://s.<br />
giannini.ucop.edu/uploads/giannini_<br />
public/73/c8/73c82d70-b296-4424-<br />
82f6-2c04c7859aa4/-v18n1<br />
_6.pdf (accessed on 26 June 2017).<br />
Comments about this article? We want<br />
to hear from you. Feel free to email us at<br />
article@jcsmarketinginc.com<br />
32 Progressive Crop Consultant <strong>March</strong>/April <strong>2019</strong>
Start your<br />
clean streak.<br />
A successful season starts with clean floors. Set up a profitable<br />
harvest with Tuscany ® SC, the foundational herbicide that ensures<br />
long-lasting, residual control of over 60 tough weeds. Tankmix<br />
it with other agents in Nufarm’s strong portfolio to see a winning<br />
season this year.<br />
Visit nufarm.com/us to learn more.<br />
For specific application rates, directions, mixing instructions and precautions, read the product label.<br />
Please visit www.nufarm.com/us to download a full label. ©2018 Nufarm. Important: Always read<br />
and follow label instructions. Tuscany ® SC, Grapple, Cheetah ® and Credit ® Xtreme are<br />
trademarks or registered trademarks of Nufarm Americas.<br />
<strong>March</strong>/April <strong>2019</strong><br />
www.progressivecrop.com<br />
33
Photo 1. Anthracnose infection symptoms on<br />
almond hull. Photos courteys of B. Holtz, University<br />
of California Cooperative Extension.<br />
The Many Possible<br />
Causes of<br />
“Gummy Nuts”<br />
in Almonds<br />
By: Emily J. Symmes | Sacramento Valley<br />
Area IPM Advisor University of California<br />
Cooperative Extension and Statewide IPM<br />
Program<br />
Beginning in <strong>March</strong>, there are a<br />
number of biological factors and<br />
non-biological conditions that<br />
may cause “gumming” in almonds.<br />
When we refer to “gummy nuts”, we are<br />
actually referring to a suite of different<br />
symptoms depending on which part of<br />
the fruit is affected. To distinguish those<br />
in this article, the term “hull gummosis”<br />
refers to the exudates (typically clear to<br />
amber in color) that are visible on the<br />
outside of the fruit. Depending on the<br />
cause and extent of fruit damage, we<br />
may also observe gumming evident on<br />
the shell and in the kernel, in addition<br />
to other symptoms.<br />
In order to develop the best approach<br />
to maintaining crop health and kernel<br />
quality, it is important to be able to<br />
distinguish among the various causes<br />
of hull, shell, and kernel gumming.<br />
In general, dissection of the fruit, as<br />
well as a holistic approach to assessing<br />
the orchard is necessary to determine<br />
the cause of symptom expression and<br />
potential for significant crop damage.<br />
Often, once hull gummosis and possible<br />
underlying kernel damage are observed,<br />
the window of opportunity or ideal<br />
treatment timing to prevent or mitigate<br />
the cause of already-damaged fruit has<br />
passed. However, understanding how<br />
to best identify the cause of symptoms,<br />
relationships to other orchard<br />
factors that lead to the development<br />
of symptoms and damage, and the<br />
timing of initial onset will allow you to<br />
develop improved monitoring and crop<br />
protection strategies.<br />
Diseases<br />
With most hull gummosis arising from<br />
disease infection, there will typically<br />
be other signs and disease symptoms<br />
apparent on other parts of the plant.<br />
Additional factors such as orchard<br />
history of disease, timing of symptom<br />
development, cultivars affected,<br />
and weather patterns conducive to<br />
particular disease development can help<br />
distinguish the cause(s) of symptoms<br />
being observed in the orchard. The most<br />
common pathogen-induced infections<br />
that can lead to hull gummosis include<br />
anthracnose and bacterial spot.<br />
Anthracnose<br />
When small nuts are infected, they<br />
shrivel and turn a rusty orange color.<br />
When larger nuts are infected, they<br />
exhibit round, sunken, orangish lesions<br />
and profuse hull gummosis as the<br />
infection progresses into the kernel.<br />
Anthracnose gummosis is typically<br />
amber in color with multiple exudate<br />
sites on the hull (Photo 1). Eventually,<br />
infected nuts die and remain attached to<br />
the spur as mummies.<br />
Other signs and symptoms of<br />
anthracnose infection may be evident<br />
on flowers, foliage, spurs, shoots,<br />
limbs, and branches. Blossom blight<br />
of infected flowers looks similar to<br />
brown rot strikes. Infected leaves tend<br />
to develop water-soaked lesions that<br />
eventually fade in color, developing into<br />
marginal necrosis. Leaves die but often<br />
remain attached to branches. Dieback<br />
often occurs on shoots and branches<br />
that bear infected nuts.<br />
Prolonged warm (>59°F), rainy weather,<br />
especially extending well into spring,<br />
are most conducive to disease spread<br />
and development. Summer infections<br />
can occur if irrigation contacts the tree<br />
canopy. All varieties are susceptible,<br />
with Butte, Fritz, Monterey, Peerless,<br />
Price, and Winters among the most<br />
susceptible, and Nonpareil considered<br />
less susceptible to anthracnose<br />
infection. Symptom development<br />
on the outside of the fruit (i.e., hull<br />
gummosis) is dependent on the timing<br />
of initial infection and rate of disease<br />
progression. In most years, it is evident<br />
by mid- to late-April.<br />
Bacterial Spot<br />
The most obvious symptoms of<br />
infection occur on nuts. Typically, hull<br />
lesions begin as small water-soaked<br />
circular spots. Infections enlarge and<br />
become necrotic, with obvious lesions<br />
Continued on Page 36<br />
34 Progressive Crop Consultant <strong>March</strong>/April <strong>2019</strong>
<strong>March</strong>/April <strong>2019</strong><br />
www.progressivecrop.com<br />
35
Photo 2A. Necrotic lesions under almond hull caused by bacterial spot infection.<br />
Continued from Page 34<br />
Continued from Page 34<br />
developing inward into the hull, shell,<br />
and kernel (Photo 2A). Infection sites<br />
on the hull exhibit profuse amber<br />
colored gumming, often from multiple<br />
exudate sites (Photo 2B). Early-season<br />
infections can cause fruit drop.<br />
Leaf and shoot symptoms may occur,<br />
but are less common than fruit<br />
symptoms. Small, water-soaked,<br />
circular leaf lesions develop along<br />
the midrib and toward the tip and<br />
Photo 2B. Bacterial spot infection symptoms<br />
on almond hull.<br />
margin of the leaf, eventually becoming<br />
chlorotic then necrotic, leaving<br />
irregular shaped holes (Photo 2C). If<br />
the disease is severe, defoliation can<br />
occur. Twig lesions may develop on<br />
green shoots.<br />
High moisture conditions and warm<br />
temperatures (> 68°F) favor infection.<br />
Severe infections are most common<br />
with frequent periods of rainfall or<br />
irrigation during fruit development.<br />
Fritz is highly susceptible to bacterial<br />
spot infection and symptom<br />
development. Other varieties such as<br />
Butte, Carmel, Monterey, Nonpareil,<br />
Padre, and Price are also susceptible<br />
but generally exhibit less disease<br />
severity. Hull gummosis symptoms<br />
are first visible one to three weeks<br />
after initial infection, therefore<br />
appearance will be related to<br />
when the favorable conditions<br />
for infection occurred that<br />
season. In most years, bacterial<br />
spot hull gummosis symptoms<br />
become apparent by mid- to late-<br />
April.<br />
Insects<br />
A number of insects of different<br />
types can cause hull gummosis. We<br />
Photo 2C. Foliar symptoms of bacterial spot<br />
infection.<br />
tend to most commonly associate its<br />
appearance with Hemipteran insects,<br />
or “true bugs” (i.e., those with piercingsucking<br />
mouthparts), particularly<br />
leaffooted bugs and stink bugs. In<br />
addition to these, a number of other<br />
“bugs” may be present in orchards and<br />
cause some extent of hull gummosis<br />
(e.g., box elder bugs, Phytocoris species,<br />
Calocoris species) but often without<br />
significant kernel or crop damage.<br />
Entries by Lepidopteran (worm) pests<br />
may also result in hull gummosis<br />
(i.e., peach twig borer and oriental<br />
fruit moth). What follows focuses on<br />
distinguishing leaffooted and stink bug<br />
feeding in almond.<br />
Hull gummosis expression and the<br />
extent of shell and kernel damage<br />
caused by bug feeding differs depending<br />
upon the insect species and life stage<br />
(adults or nymphs), the growth size and<br />
Continued on Page 38<br />
36 Progressive Crop Consultant <strong>March</strong>/April <strong>2019</strong>
September 26th-27th<br />
Visalia Convention Center<br />
303 E. Acequia Ave. Visalia, CA 93291<br />
You’re invited to join us at the first annual Crop Consultant<br />
Conference. It is taking place on September 26th, and<br />
27th at the Visalia Convention Center.<br />
This 2-day conference provides Education and Networking opportunities for PCAs, CCAs, and Ag<br />
Retailers from across California. Join us for our Opening Reception and Gala Dinner, the first night,<br />
followed by our seminars and Industry Lunch the next day. Attendees will learn about current issues<br />
impacting California’s Agriculture Industry, the latest technologies, and more at our workshops and<br />
seminars while earning 6 CE Credits (Pending DPR Approval).<br />
powered by:<br />
WEST COAST NUT<br />
Workshops and Seminars<br />
6 Hours of CE Credit (Pending DPR Approval)<br />
Mixer & Networking<br />
Meals Included (Gala Dinner, Lunch, Breakfast, and snacks)<br />
For more information and to register visit progressivecrop.com/conference<br />
<strong>March</strong>/April <strong>2019</strong><br />
www.progressivecrop.com<br />
37
varieties are more susceptible to kernel<br />
damage for a longer period during the<br />
season.<br />
Photo 3. Leaffooted bug egg mass on almond. Photo courtesy of<br />
Integral Ag, Inc.<br />
Continued from Page 36<br />
stage of the fruit being fed on (therefore,<br />
seasonal timing of damage), and the<br />
variety. The key factors for differential<br />
fruit symptom expression involve the<br />
length of the insect mouthpart and<br />
what part of the fruit tissue it can reach<br />
(differs based on species, and among<br />
adults and nymphs of a species); hull<br />
thickness and shell hardness (which<br />
both vary in time and among varieties);<br />
and stage of kernel development when<br />
the feeding occurred. In addition,<br />
feeding wounds caused by bugs can<br />
provide openings for secondary<br />
pathogens to invade the fruit (e.g.,<br />
bacteria, yeast, fungi) and some plantfeeding<br />
bugs are known to inject<br />
salivary enzymes which may exacerbate<br />
damage symptoms.<br />
In general, when evaluating insectcaused<br />
hull gummosis, shell, and<br />
kernel damage, darkened feeding<br />
channels are evident upon dissection<br />
into the hull, and may extend into the<br />
shell and kernel (based on the factors<br />
noted above). The most accurate<br />
way to distinguish which bug species<br />
are causing the damage is by visual<br />
observation of the presence of the<br />
insects themselves (adults, nymphs,<br />
or egg masses), but other factors such<br />
as timing, extent of damage, and<br />
landscape characteristics can assist in<br />
the evaluation.<br />
Leaffooted Bugs (Family<br />
Coreidae)<br />
Leaffooted bug (LFB) feeding on young<br />
fruit prior to shell hardening can cause<br />
the kernel to wither and abort, and may<br />
lead to nut drop. LFB feeding impacts<br />
lessen as the season progresses, with<br />
kernel damage decreasing as shells<br />
harden. After shells begin to harden,<br />
feeding may still cause dark spots and<br />
gumming of the kernel, or wrinkled and<br />
misshaped kernels.<br />
Hull gummosis caused by LFB feeding<br />
is clear to light-yellow, originating<br />
from each feeding site. Therefore,<br />
there can be single or multiple hull<br />
gummosis sites, but we often observe<br />
multiple exudates on individual nuts<br />
arising from LFB infestation. The extent<br />
of kernel damage depends on if the<br />
feeding entry made it through the shell<br />
and into the kernel. Softer shell almond<br />
LFB damage typically occurs in a fairly<br />
distinct window of time, usually during<br />
<strong>March</strong> and April. Hull gummosis<br />
caused by LFB usually manifests 3 to 10<br />
days after the initial feeding occurrence.<br />
As season progresses into May and<br />
June, the LFB feeding decreases while<br />
stink bug feeding by species commonly<br />
encountered in almond orchards can<br />
increase. Monitor for visual evidence<br />
of LFB adults, nymphs, and egg masses<br />
(Photo 3) from <strong>March</strong> to early May.<br />
Basing treatments on the appearance of<br />
significant hull gummosis or aborted<br />
nuts on the ground may be ineffective,<br />
as there can be more than a one-week<br />
lag time between feeding and evidence<br />
of symptoms, and dispersing insects<br />
may have moved out of the orchard by<br />
that time.<br />
Stink Bugs (Family<br />
Pentatomidae)<br />
There are a number of species of stink<br />
bugs that can be found in almond<br />
orchards. These include green stink<br />
bug (most commonly encountered),<br />
redshouldered stink bug, Uhler stink<br />
bug, and rough stink bug. Be aware that<br />
rough stink bugs are not plant pests;<br />
they are predators of other insects.<br />
More recently, the invasive brown<br />
marmorated stink bug (BMSB) has been<br />
reported in a few almond orchards in<br />
the northern San Joaquin Valley. BMSB<br />
will be addressed in a separate section<br />
in this article.<br />
Feeding by the more common stink<br />
bugs in almond orchards typically<br />
occurs from May through July.<br />
Movement into orchards in spring<br />
occurs when other hosts (weeds, other<br />
plants, crops) dry down, so this can<br />
be earlier in years with dry winters/<br />
springs. The appearance of hull<br />
gummosis is similar to LFB (clear to<br />
light-colored gumming, often exuding<br />
from multiple puncture holes), but<br />
the timing of incidence is a key factor<br />
in separating the two. Because stink<br />
bug feeding occurs later in the season<br />
than LFB feeding, it typically only<br />
extends into the hull, and nut abortion<br />
and kernel damage are rare. However,<br />
severe feeding may impact quality<br />
Continued on Page 40<br />
38 Progressive Crop Consultant <strong>March</strong>/April <strong>2019</strong>
FORTIFIED<br />
THAT’S HOW ALMONDS FEEL WITH MOVENTO. ®<br />
Movento ® insecticide is the only foliar application with downward movement<br />
within the tree to protect roots by suppressing nematodes. With Movento,<br />
trees will show improved vigor and produce high yields year after year.<br />
For more information, contact your retailer or Bayer representative or visit www.Movento.us.<br />
© <strong>2019</strong> Bayer CropScience LP, 800 North Lindbergh Boulevard, St. Louis, MO 63167. Always read and follow label instructions. Bayer, the Bayer Cross, and Movento<br />
are registered trademarks of Bayer. For additional product information, call toll-free 1-866-99-BAYER (1-866-992-2937) or visit our website at www.CropScience.Bayer.us.<br />
<strong>March</strong>/April <strong>2019</strong><br />
www.progressivecrop.com<br />
39
Continued from Page 38<br />
due to misshapen or wrinkled kernels,<br />
perhaps due to increases in secondary<br />
pathogens. Stink bugs are generally<br />
less mobile than LFB, so feeding tends<br />
to be more localized (clustered) in the<br />
orchard. Additionally, monitoring or<br />
observing visual evidence of stink bug<br />
adults (Photo 4), nymphs, and barrelshaped<br />
egg masses, can help indicate<br />
whether they were the likely cause of<br />
fruit symptoms.<br />
Brown Marmorated Stink Bug<br />
BMSB has been present in California<br />
since 2008, but has only recently<br />
begun to move into some agricultural<br />
commodities (commercial kiwifruit<br />
detection beginning in 2014, peach in<br />
2016, and almond in 2017). Because this<br />
is an invasive species with a very wide<br />
host range, minimal natural controls,<br />
and highly aggregative behavior, there<br />
is considerable concern as to the<br />
potential impacts should it become<br />
more widespread and established in<br />
California agricultural crops.<br />
To date in almond, reports of serious<br />
infestation and damage have been<br />
limited to a few orchards in Stanislaus<br />
and Merced counties, but it is important<br />
to be aware of how to determine the<br />
possible presence of this pest in almond<br />
orchards, and how to distinguish<br />
damage caused by BMSB versus other<br />
bug feeding. Evidence of feeding (hull<br />
gummosis from multiple feeding<br />
sites) and shell and kernel damage by<br />
BMSB seems to be similar to LFB (if<br />
occurring earlier in the season, before<br />
shell hardening) or other stink bugs<br />
(if occurring later in the season, after<br />
shell hardening), although the severity<br />
may appear greater for BMSB due to<br />
its aggregative nature (infest in larger<br />
numbers in clustered areas of orchards).<br />
Recent research by University of<br />
California Cooperative Extension<br />
(UCCE) Area IPM Advisor Jhalendra<br />
Rijal in the impacted orchards indicates<br />
that BMSB may move into almonds<br />
and begin feeding as early as mid-<br />
<strong>March</strong>, and may continue well into<br />
summer. Therefore, it may be difficult to<br />
distinguish whether hull gummosis, nut<br />
drop, and/or kernel damage observed<br />
in <strong>March</strong> and April was caused by LFB<br />
or BMSB feeding. If hull gummosis<br />
is occurring later in the summer,<br />
it may be difficult to distinguish<br />
between BSMB or other stink bugs.<br />
Researchers are actively working on<br />
traps and lures for LFB, but to date,<br />
none are commercially available.<br />
Fortunately, there are traps and lures<br />
available for BMSB. In addition to<br />
trapping and visual observations of<br />
the pests themselves (adults, nymphs,<br />
egg masses), taking into account<br />
landscape-scale characteristics and<br />
location of the damage in the orchard<br />
may help indicate the source of damage<br />
if occurring during the same time<br />
period as either LFB or other stink bugs.<br />
For BMSB, pay particular attention<br />
to border rows next to overwintering<br />
Continued on Page 42<br />
Photo 4. Adult green stink bug on almond. Photo courtesy of<br />
Integral Ag, Inc.<br />
40 Progressive Crop Consultant <strong>March</strong>/April <strong>2019</strong>
<strong>March</strong>/April <strong>2019</strong><br />
www.progressivecrop.com<br />
41
Continued from Page 40<br />
aggregation shelters (e.g., structures,<br />
wood piles), other known hosts (e.g.,<br />
tree of heaven is known to harbor high<br />
populations of BMSB), and riparian/<br />
natural environment interfaces.<br />
Other Causes of Hull Gummosis<br />
A number of other factors may result in<br />
the expression of hull gummosis. These<br />
include physical causes (such as hail<br />
or tractor strikes to the fruit), nutrient<br />
deficiency (i.e., boron), herbicide<br />
damage, and physiological responses.<br />
Boron deficiency will typically manifest<br />
as clear gummosis on the sides of the<br />
hull or at the suture line. Copious<br />
internal gumming and discoloration<br />
the of developing kernel will be visible<br />
upon dissection (Photo 5). Fruit drop<br />
may occur, or, if nuts remain in the<br />
tree, internal gumming will harden and<br />
cause misshapen kernels. Boron status<br />
can be evaluated by analyzing hull<br />
samples.<br />
Physiological processes, not relating<br />
to any of the aforementioned sources,<br />
may result in hull gummosis. This is<br />
thought to be due to rapid expansion<br />
of the growing kernel, causing<br />
increased pressure on the shell and<br />
hull. Dissection of the fruit will show<br />
a water-soaked gummy area on the<br />
outside of the shell, clear gummosis<br />
exuding from the suture line or side of<br />
hull, and no apparent feeding channel<br />
(that would indicate bug as the culprit).<br />
Kernels appear healthy and affected<br />
nuts often remain on the tree with no<br />
negative impacts.<br />
In summary, hull gummosis in almonds<br />
can be caused by a number of different<br />
biological and non-biological factors.<br />
Appearance of hull gummosis may be<br />
indicative of more severe crop damage<br />
if kernels are also impacted, but this<br />
is not always the case. Understanding<br />
how to best identify the sources of<br />
such symptoms is a key component for<br />
effective integrated pest management<br />
and crop production programs.<br />
More detail on identification and<br />
management of all of the potential<br />
causes of hull gummosis, shell, and<br />
kernel gumming damage can be found<br />
on the UC Statewide IPM Program<br />
online Pest management Guidelines<br />
for Almonds (ipm.ucanr.edu/PMG/<br />
selectnewpest.almonds.html), and in<br />
multiple posts at the Sacramento Valley<br />
Orchard Source Website (http://www.<br />
sacvalleyorcards.com/) and the Almond<br />
Doctor Blog (http://thealmonddoctor.<br />
com/).<br />
Photo 5. Symptoms of boron deficiency<br />
in almond kernel. Photo courtesy<br />
of D. Lightle, University of California<br />
Cooperative Extension.<br />
Comments about this article? We want<br />
to hear from you. Feel free to email us at<br />
article@jcsmarketinginc.com<br />
GET AN<br />
ROI<br />
So<br />
BIG<br />
Its Like Finding Buried Treasure!<br />
NEED AN EXTRA<br />
SEE HOW ITS DONE:<br />
HumaGro.com/<strong>PCC</strong>319<br />
per<br />
acre<br />
ROI?<br />
42 Progressive Crop Consultant <strong>March</strong>/April <strong>2019</strong>
GET READY<br />
for our <strong>2019</strong>-2020 Trade Shows<br />
New Names, Same Great Experiences!<br />
In 2018-<strong>2019</strong> we had:<br />
Date TBD (Orland, CA)<br />
January 10, 2020 (Yuba City, CA)<br />
June 5, <strong>2019</strong> (Turlock, CA)<br />
June 19-21, <strong>2019</strong> (Monterey, CA)<br />
1,268<br />
PCA/CCA Attendance<br />
3,336<br />
Total Attendees<br />
Come experience our<br />
shows for YOURSELF!<br />
June 12, <strong>2019</strong> (Fresno, CA)<br />
September 26-27 (Visalia, CA)<br />
November 20, <strong>2019</strong> (Tulare, CA)<br />
For more info visit: www.wcngg.com/events<br />
October 24, <strong>2019</strong> (Bakersfield, CA)<br />
AG MARKETING SOLUTIONS<br />
@jcsmarketing<br />
JCS Marketing Inc.<br />
@jcs_marketing<br />
<strong>March</strong>/April <strong>2019</strong><br />
www.progressivecrop.com<br />
43
44 Progressive Crop Consultant <strong>March</strong>/April <strong>2019</strong>