Global Screw Pumps Market is projected to reach USD 4.6 billion by 2023 | Techsci Research
Global screw pumps market stood at $ 3 billion in 2017 and is projected to reach $ 4.6 billion by 2023. Anticipated increase in screw pump sales can be attributed to robust growth in water treatment industry and rising oil & gas exploration activities.
Global screw pumps market stood at $ 3 billion in 2017 and is projected to reach $ 4.6 billion by 2023. Anticipated increase in screw pump sales can be attributed to robust growth in water treatment industry and rising oil & gas exploration activities.

You also want an ePaper? Increase the reach of your titles
YUMPU automatically turns print PDFs into web optimized ePapers that Google loves.
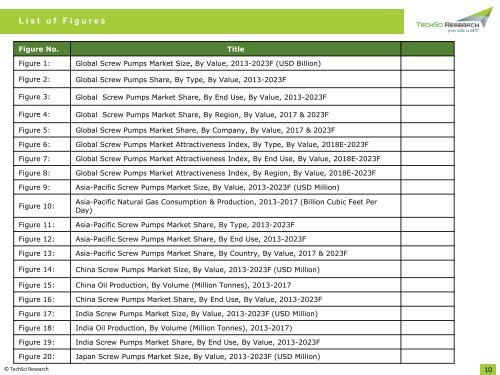
L i s t o f F i g u r e s<br />
Figure No.<br />
Figure 1:<br />
Title<br />
<strong>Global</strong> <strong>Screw</strong> <strong>Pumps</strong> <strong>Market</strong> Size, By Value, 2013-<strong>2023</strong>F (<strong>USD</strong> Billion)<br />
Figure 2: <strong>Global</strong> <strong>Screw</strong> <strong>Pumps</strong> Share, By Type, By Value, 2013-<strong>2023</strong>F<br />
Figure 3: <strong>Global</strong> <strong>Screw</strong> <strong>Pumps</strong> <strong>Market</strong> Share, By End Use, By Value, 2013-<strong>2023</strong>F<br />
Figure 4:<br />
Figure 5:<br />
Figure 6:<br />
Figure 7:<br />
Figure 8:<br />
Figure 9:<br />
Figure 10:<br />
<strong>Global</strong> <strong>Screw</strong> <strong>Pumps</strong> <strong>Market</strong> Share, By Region, By Value, 2017 & <strong>2023</strong>F<br />
<strong>Global</strong> <strong>Screw</strong> <strong>Pumps</strong> <strong>Market</strong> Share, By Company, By Value, 2017 & <strong>2023</strong>F<br />
<strong>Global</strong> <strong>Screw</strong> <strong>Pumps</strong> <strong>Market</strong> Attractiveness Index, By Type, By Value, 2018E-<strong>2023</strong>F<br />
<strong>Global</strong> <strong>Screw</strong> <strong>Pumps</strong> <strong>Market</strong> Attractiveness Index, By End Use, By Value, 2018E-<strong>2023</strong>F<br />
<strong>Global</strong> <strong>Screw</strong> <strong>Pumps</strong> <strong>Market</strong> Attractiveness Index, By Region, By Value, 2018E-<strong>2023</strong>F<br />
Asia-Pacific <strong>Screw</strong> <strong>Pumps</strong> <strong>Market</strong> Size, By Value, 2013-<strong>2023</strong>F (<strong>USD</strong> Million)<br />
Asia-Pacific Natural Gas Consumption & Production, 2013-2017 (Billion Cubic Feet Per<br />
Day)<br />
Figure 11: Asia-Pacific <strong>Screw</strong> <strong>Pumps</strong> <strong>Market</strong> Share, By Type, 2013-<strong>2023</strong>F<br />
Figure 12: Asia-Pacific <strong>Screw</strong> <strong>Pumps</strong> <strong>Market</strong> Share, By End Use, 2013-<strong>2023</strong>F<br />
Figure 13:<br />
Figure 14:<br />
Asia-Pacific <strong>Screw</strong> <strong>Pumps</strong> <strong>Market</strong> Share, By Country, By Value, 2017 & <strong>2023</strong>F<br />
China <strong>Screw</strong> <strong>Pumps</strong> <strong>Market</strong> Size, By Value, 2013-<strong>2023</strong>F (<strong>USD</strong> Million)<br />
Figure 15: China Oil Production, By Volume (Million Tonnes), 2013-2017<br />
Figure 16: China <strong>Screw</strong> <strong>Pumps</strong> <strong>Market</strong> Share, By End Use, By Value, 2013-<strong>2023</strong>F<br />
Figure 17:<br />
India <strong>Screw</strong> <strong>Pumps</strong> <strong>Market</strong> Size, By Value, 2013-<strong>2023</strong>F (<strong>USD</strong> Million)<br />
Figure 18: India Oil Production, By Volume (Million Tonnes), 2013-2017)<br />
Figure 19: India <strong>Screw</strong> <strong>Pumps</strong> <strong>Market</strong> Share, By End Use, By Value, 2013-<strong>2023</strong>F<br />
Figure 20:<br />
© TechSci <strong>Research</strong><br />
Japan <strong>Screw</strong> <strong>Pumps</strong> <strong>Market</strong> Size, By Value, 2013-<strong>2023</strong>F (<strong>USD</strong> Million)<br />
10