Global Screw Pumps Market is projected to reach USD 4.6 billion by 2023 | Techsci Research
Global screw pumps market stood at $ 3 billion in 2017 and is projected to reach $ 4.6 billion by 2023. Anticipated increase in screw pump sales can be attributed to robust growth in water treatment industry and rising oil & gas exploration activities.
Global screw pumps market stood at $ 3 billion in 2017 and is projected to reach $ 4.6 billion by 2023. Anticipated increase in screw pump sales can be attributed to robust growth in water treatment industry and rising oil & gas exploration activities.

Create successful ePaper yourself
Turn your PDF publications into a flip-book with our unique Google optimized e-Paper software.
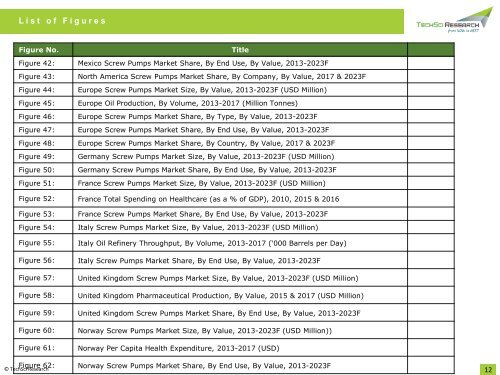
L i s t o f F i g u r e s<br />
Figure No.<br />
Title<br />
Figure 42: Mexico <strong>Screw</strong> <strong>Pumps</strong> <strong>Market</strong> Share, By End Use, By Value, 2013-<strong>2023</strong>F<br />
Figure 43: North America <strong>Screw</strong> <strong>Pumps</strong> <strong>Market</strong> Share, By Company, By Value, 2017 & <strong>2023</strong>F<br />
Figure 44: Europe <strong>Screw</strong> <strong>Pumps</strong> <strong>Market</strong> Size, By Value, 2013-<strong>2023</strong>F (<strong>USD</strong> Million)<br />
Figure 45: Europe Oil Production, By Volume, 2013-2017 (Million Tonnes)<br />
Figure 46: Europe <strong>Screw</strong> <strong>Pumps</strong> <strong>Market</strong> Share, By Type, By Value, 2013-<strong>2023</strong>F<br />
Figure 47: Europe <strong>Screw</strong> <strong>Pumps</strong> <strong>Market</strong> Share, By End Use, By Value, 2013-<strong>2023</strong>F<br />
Figure 48: Europe <strong>Screw</strong> <strong>Pumps</strong> <strong>Market</strong> Share, By Country, By Value, 2017 & <strong>2023</strong>F<br />
Figure 49: Germany <strong>Screw</strong> <strong>Pumps</strong> <strong>Market</strong> Size, By Value, 2013-<strong>2023</strong>F (<strong>USD</strong> Million)<br />
Figure 50: Germany <strong>Screw</strong> <strong>Pumps</strong> <strong>Market</strong> Share, By End Use, By Value, 2013-<strong>2023</strong>F<br />
Figure 51: France <strong>Screw</strong> <strong>Pumps</strong> <strong>Market</strong> Size, By Value, 2013-<strong>2023</strong>F (<strong>USD</strong> Million)<br />
Figure 52: France Total Spending on Healthcare (as a % of GDP), 2010, 2015 & 2016<br />
Figure 53: France <strong>Screw</strong> <strong>Pumps</strong> <strong>Market</strong> Share, By End Use, By Value, 2013-<strong>2023</strong>F<br />
Figure 54:<br />
Figure 55:<br />
Italy <strong>Screw</strong> <strong>Pumps</strong> <strong>Market</strong> Size, By Value, 2013-<strong>2023</strong>F (<strong>USD</strong> Million)<br />
Italy Oil Refinery Throughput, By Volume, 2013-2017 (‘000 Barrels per Day)<br />
Figure 56: Italy <strong>Screw</strong> <strong>Pumps</strong> <strong>Market</strong> Share, By End Use, By Value, 2013-<strong>2023</strong>F<br />
Figure 57:<br />
Figure 58:<br />
United Kingdom <strong>Screw</strong> <strong>Pumps</strong> <strong>Market</strong> Size, By Value, 2013-<strong>2023</strong>F (<strong>USD</strong> Million)<br />
United Kingdom Pharmaceutical Production, By Value, 2015 & 2017 (<strong>USD</strong> Million)<br />
Figure 59: United Kingdom <strong>Screw</strong> <strong>Pumps</strong> <strong>Market</strong> Share, By End Use, By Value, 2013-<strong>2023</strong>F<br />
Figure 60:<br />
Figure 61:<br />
Norway <strong>Screw</strong> <strong>Pumps</strong> <strong>Market</strong> Size, By Value, 2013-<strong>2023</strong>F (<strong>USD</strong> Million))<br />
Norway Per Capita Health Expenditure, 2013-2017 (<strong>USD</strong>)<br />
Figure 62:<br />
© TechSci <strong>Research</strong> Norway <strong>Screw</strong> <strong>Pumps</strong> <strong>Market</strong> Share, By End Use, By Value, 2013-<strong>2023</strong>F<br />
12